Market State Vector

MSV — Market State Vector

Сначала о том, чего здесь нет

Здесь нет стрелок «покупай» и «продавай». Нет процента выигрышных сделок. Нет скриншота, где десять зелёных сделок подряд — такой скриншот делается за пять минут: достаточно полистать историю и найти удачный месяц.

Это не скромность. Это устройство инструмента. MSV не знает, куда пойдёт цена, и не делает вид, что знает. Он знает другое — где рынок сейчас находится. А решение остаётся за тобой, и это, пожалуй, единственное честное разделение труда между человеком и программой.

Что он делает

Открой любой график без индикаторов. Свечи, свечи, свечи — лес, в котором каждое дерево похоже на соседнее. Трейдер смотрит на этот лес и пытается разглядеть в нём дорогу.

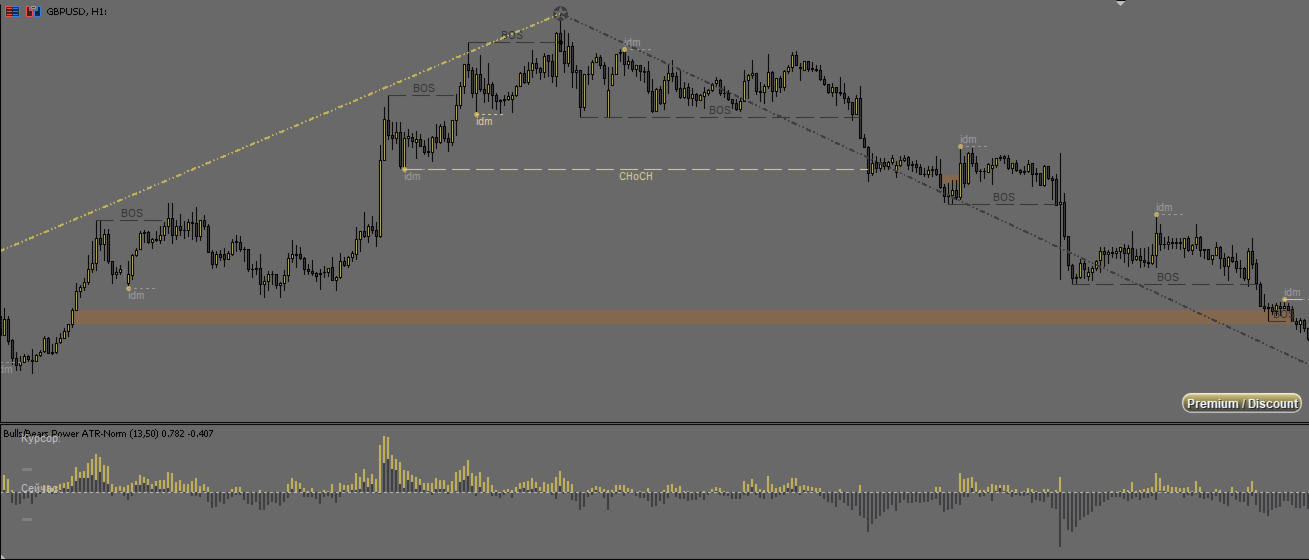
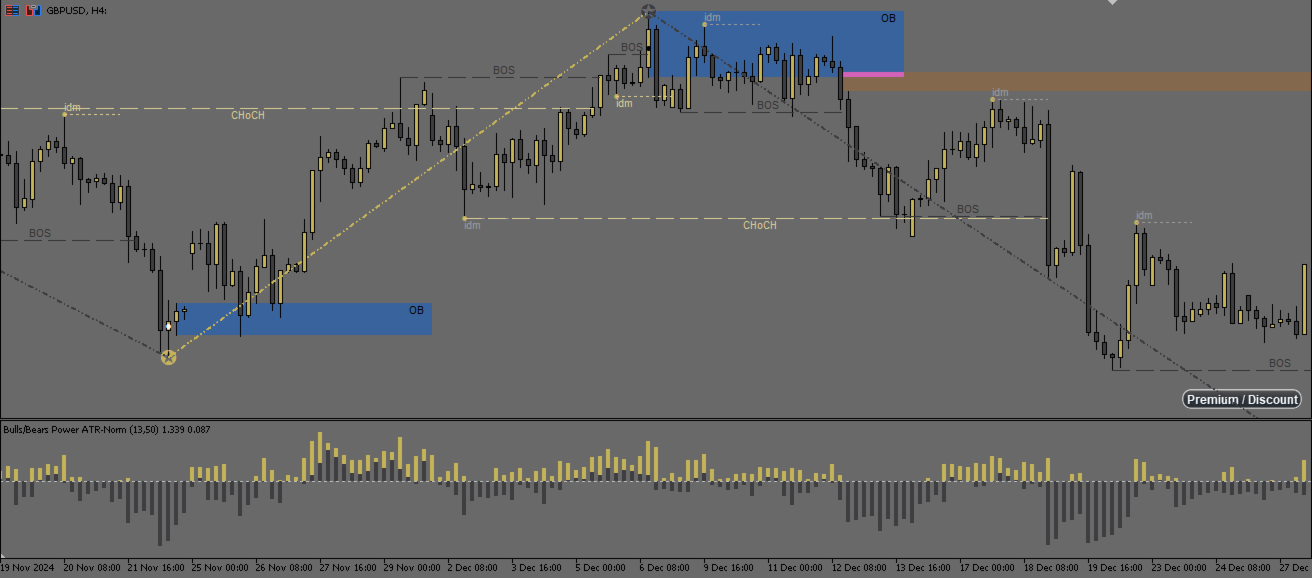
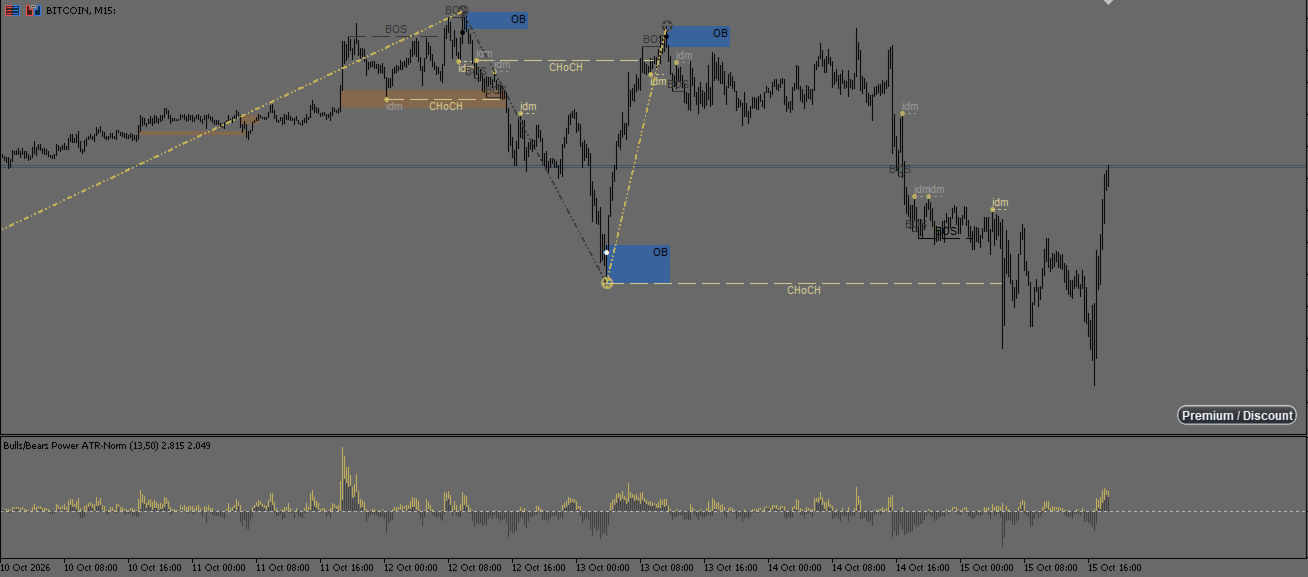
MSV рисует дорогу. Он разбирает движение цены на части и показывает их имена: вот отсюда движение началось, вот досюда дошло, вот здесь откатилось, а вот здесь — сменило характер. То, что опытный глаз размечает карандашом за полчаса, индикатор делает на каждой свече и не устаёт.

Структура в два уровня

В основе — одно правило, и оно простое настолько, что его можно рассказать за минуту.

Минимум считается началом движения вверх, если после него цена поднялась до какой-то вершины, откатилась — но не ниже этого минимума — и затем закрылась выше той вершины. Пробой вершины и доказывает, что минимум был настоящим началом, а не случайной ямкой. Вниз всё зеркально.

Хитрость в том, что это правило применяется дважды. Сначала к свечам — так получаются мелкие точки, уровни IDM, каждый откат внутри движения. Потом то же самое правило применяется уже не к свечам, а к полученным точкам — и получается структура на ступень крупнее, настоящие начала движений.

Ни порогов, ни множителей, ни «периода в N свечей». Крупность берётся из вложенности, а не из настройки, которую пришлось бы подбирать под каждый инструмент.

Волна

Из этой структуры собирается Волна — главная сущность индикатора. У неё есть Опорная точка (где началась), Структурная точка (докуда дошла), последний IDM и последний свинг.

Волна заканчивается, когда цена закрывается за уровень последнего свинга — это CHoCH, смена характера. Но не раньше, чем у волны появился собственный IDM и цена его сняла: без этого условия встречное движение, родившееся на развороте, закрывалось бы мгновенно, и обычное продолжение тренда помечалось бы как разворот.

Опорной точкой следующей волны становится Структурная точка предыдущей. Волны сцепляются в цепь, и график перестаёт быть лесом.

Счёт идёт слева направо и в будущее не заглядывает. Завершённая волна больше не меняется. Двигается только последняя, незакрытая — её вершина тянется дальше, пока движение продолжается. Это не перерисовка, это просто незаконченное движение.

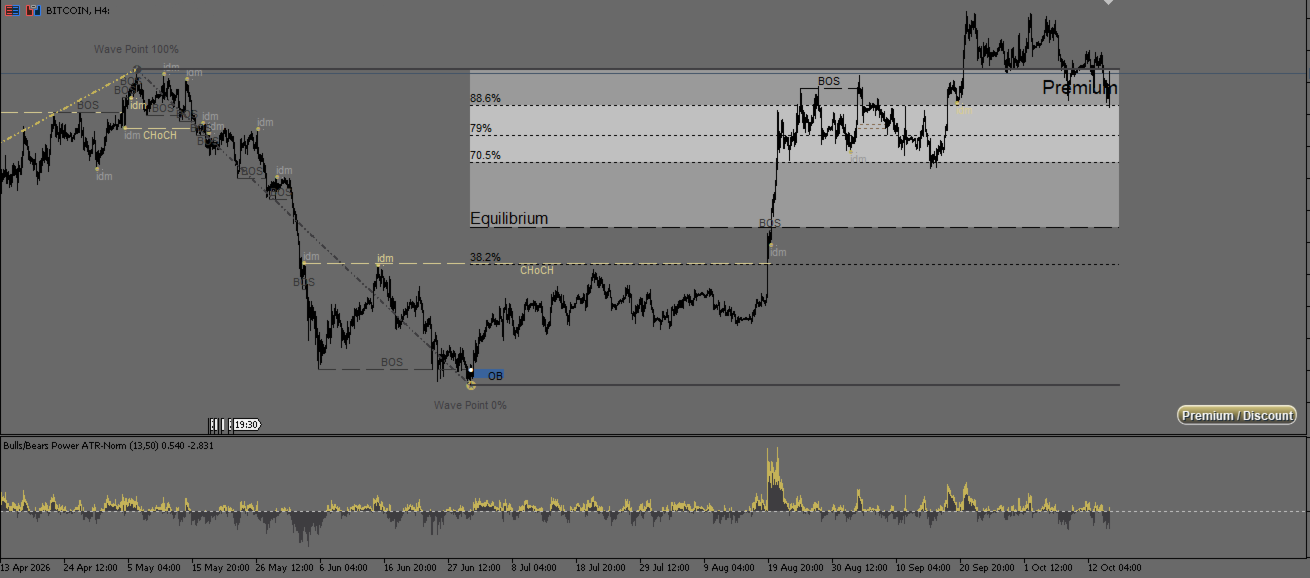
Канал Premium / Discount

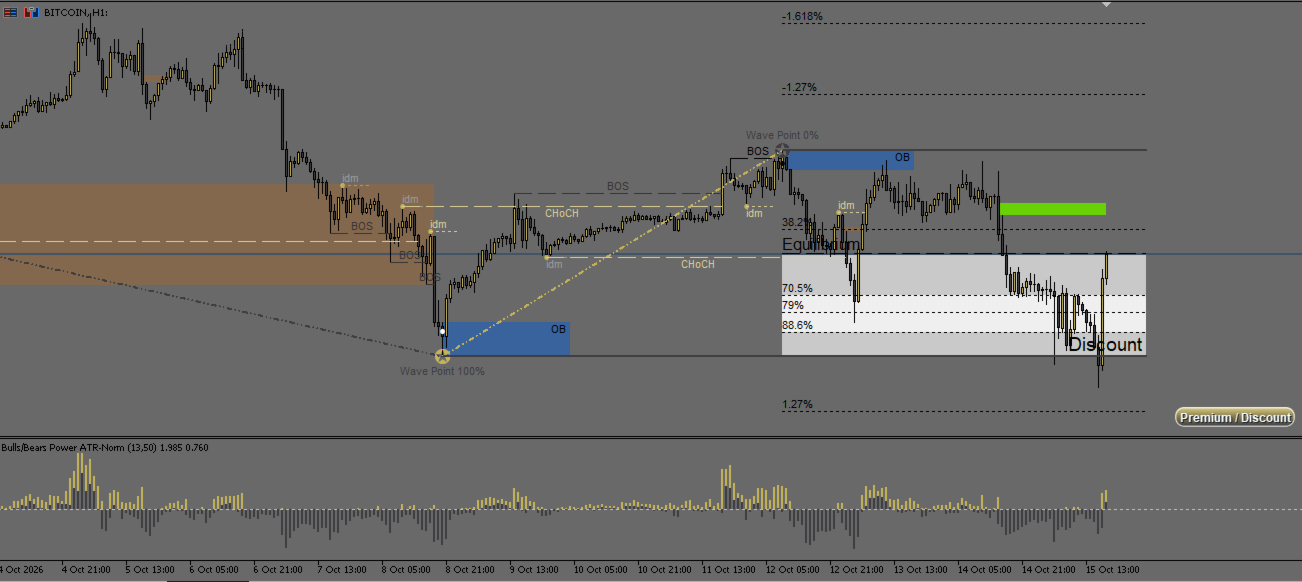
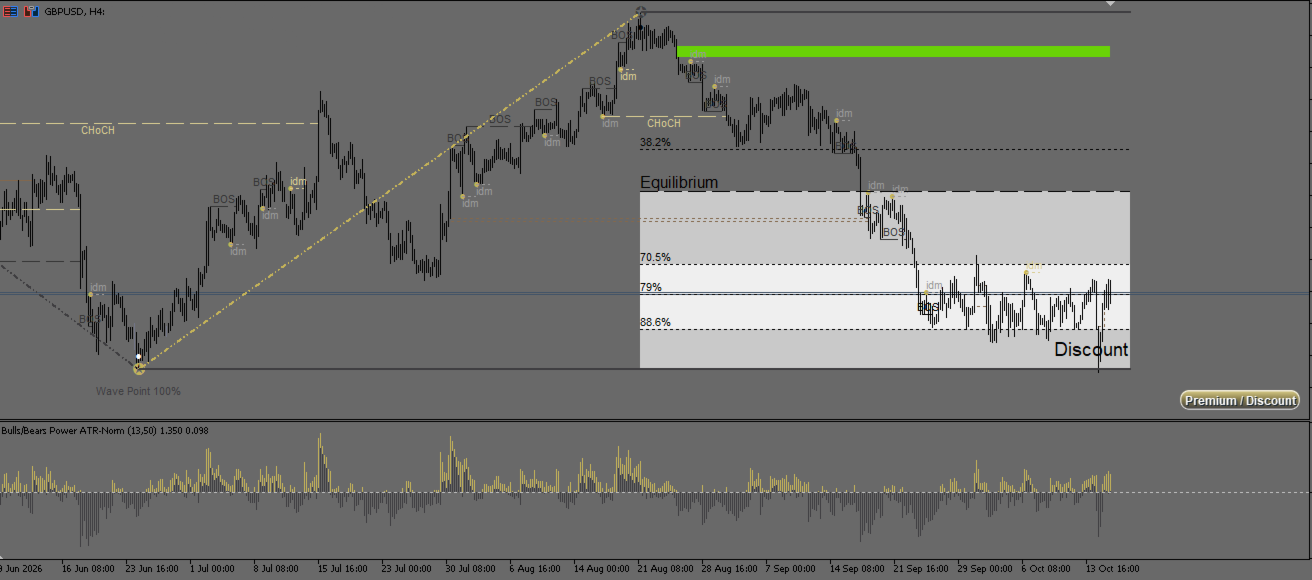
На последнюю завершённую волну (между двумя точками привязки) натягивается канал с равновесием посередине: выше — дорого, ниже — дёшево. Внутри отмечена полоса OTE (Оптимальная Точка Входа) между 70.5% и 88.6% — глубина отката, на которой движение чаще всего возобновляется (но это не точно). Отдельно нарисованы уровни расширения — куда цена может уйти дальше. Канал убирается и возвращается одной кнопкой прямо на графике.

Ордер блоки и брейкеры

В окрестности каждой точки Волны индикатор ищет ближайший разрыв цены и берёт первую свечу его тройки — это и есть ордер блок. Если цену потом провели сквозь зону насквозь, блок становится брейкером и работает в обратную сторону.

Важная деталь, которую обычно не делают: состояние блока фиксируется в момент появления следующего блока. Старая зона не может перекраситься от свечи, случившейся спустя полгода. Иначе на графике было бы нарисовано будущее — то, чего в тот момент знать было нельзя.

Грейд-зоны

Разрывы цены оцениваются по четырём осям: размах импульсной свечи, всплеск объёма, положение в локальном диапазоне и подтверждение структурой. По сумме выставляется грейд — от A до D. Показывать можно только сильные.

Шкала объёма у каждого инструмента своя: индикатор сначала смотрит, какие всплески на этом символе вообще бывают, и уже потом сравнивает. «Вдвое» на спокойном форексе и «вдвое» на биткоине — разные события. А на символах, где брокер рисует объём условно, ось объёма отключается сама: оценивать там нечего, и лучше честно считать по трём признакам, чем по четырём, один из которых — шум.

Зона живёт, пока цена её не пробьёт. В этот момент зона помечается снятой.

Окно силы

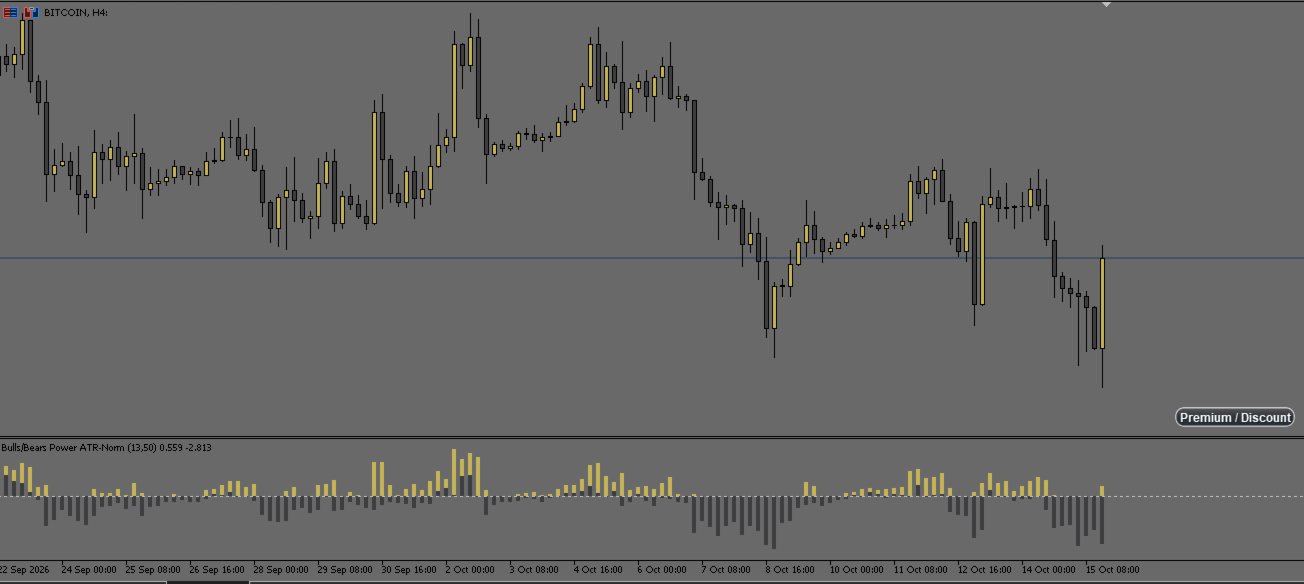
Снизу открывается отдельное окно: сила покупателей и продавцов, нормированная на средний размах цены. Нормировка нужна, чтобы столбики на спокойном рынке и на бурном можно было сравнивать между собой. Основным способом сравнения считаю Дивергенцию. Расхождение цены с показателями (гистограммой) индикатора Силы. Окно открывается само, отдельный индикатор ставить не нужно.

Чего он не умеет

Нет панели с текстом «сильная зона покупки, жди свечу подтверждения». Нет оповещений на телефон. Нет виджета с направлением на всех таймфреймах сразу. Нет автоматического поиска дивергенций — расхождение цены с гистограммой силы ты ищешь глазами.

Всё это делается и, может быть, появится. Но пока этого нет.

Технические данные

Платформа

MetaTrader 5

Инструменты

любые

Таймфреймы

любые

Глубина разбора

20 000 баров по умолчанию, настраивается

Настроек

124 в 11 группах

Оформление графика

своя палитра, включается одной галкой

Сделки

не открывает, не закрывает, не сопровождает

Сигналов на вход

не даёт

Для кого

Для тех, кто торгует по структуре рынка и устал размечать её руками. Для тех, кто уже знает, что такое BOS, CHoCH и ордер блок, но хочет видеть их одинаково размеченными на всех инструментах, а не по настроению.

Если ты ищешь кнопку «заработать» — её здесь нет, и в честных местах её вообще не бывает.

С чего начать

Поставь на свой рабочий инструмент и неделю просто смотри. Не торгуй по нему сразу. Разметка либо совпадёт с тем, что ты и так видишь на графике, либо нет — и это выяснится за неделю, а не за три месяца.

Если совпала — дальше инструмент будет экономить Вам полчаса в день. Если нет — значит, он размечает рынок не так, как Вы думаете.

На что обратить внимание

1. Как строится Волна

Всё начинается с Опорной свечи — той, что поставила текущую вершину движения. Дальше каждая новая свеча отвечает на один вопрос: что она сделала с диапазоном Опорной?

Пробила её максимум — вершина переезжает, эта свеча становится новой Опорной. Движение продолжается, и ничего интересного пока не случилось.

Пробила её минимум — это правильный откат. Цена всерьёз пошла назад, и у отката появляется дно.

Не сделала ни того, ни другого — свеча целиком внутри диапазона Опорной. Это неправильный откат, и он не анализируется вовсе. Здесь легко обмануться глазом: три убывающие свечки подряд выглядят как откат, но если они все умещаются внутри Опорной, цена никуда не ходила.

Дальше цена возвращается и закрывается выше вершины. Вот теперь дно правильного отката получает имя — IDM. Это уровень, который рынок в тот раз не отдал.

И здесь главное, что стоит усвоить: IDM сам по себе ничего не закрывает. Он не точка разворота и не место, где волна сформировалась. Он всего лишь предвестник — отметка, что откат был настоящим. Волна продолжает идти как шла, а IDM просто висит на графике и ждёт своего часа.

2. Когда Волна закрывается

Чтобы волна завершилась, должны совпасть две вещи, и ни одной меньше.

Первое: снятие IDM. Цена должна закрыться за его уровень — для волны вверх ниже, для волны вниз выше. Проткнуть тенью IDM мало, нужно чтобы цена закрылась ниже.

Второе: закрытие за уровень последнего свинга. Вот это и есть CHoCH — смена характера. Не пробой IDM, не пробой основания волны, а именно уход за начало последнего крупного движения.

Почему так строго? Без первых двух условий встречная волна, появившись на развороте, пропадала бы мгновенно: построить она ничего не успела, а пробой её тоненького уровня помечался бы как смена характера — хотя на деле это обычное продолжение прежнего движения. Два лишних условия и отделяют настоящий разворот от рядового отката.

Когда CHoCH случился, Структурная точка закрытой волны становится Опорной точкой в новой создающейся Волне. Волны сцепляются в цепь.

3. Ордер блоки

Блок ищется не по всему графику, а рядом с точками Волны — её основанием и вершиной. В окрестности каждой такой точки индикатор находит ближайший разрыв цены и берёт первую свечу его тройки. Это и есть ордер блок: место, откуда ушёл импульс.

Если цену потом провели сквозь зону насквозь, блок становится брейкером и работает в обратную сторону: несостоявшаяся поддержка становится сопротивлением.

Смотреть на блоки стоит так: у основания волны они отмечают, откуда движение стартовало; у вершины — где его развернули. Второе обычно интереснее.

4. Грейды

Не всякий разрыв цены одинаково весом. Каждый оценивается по четырём признакам: размах импульсной свечи, всплеск объёма, положение в локальном диапазоне и подтверждение структурой. По сумме выставляется грейд — от A до D.

Грейд A означает «сильно по всем четырём признакам сразу», и таких зон мало. Это и задумано: если бы их было много, грейд ничего бы не означал.

Полезно помнить, что грейд A — лучшее для этого инструмента, а не абсолютная планка. Шкала объёма считается отдельно по каждому символу, потому что «вдвое» на EURUSD и «вдвое» на биткоине — события разного веса. Поэтому сравнивать грейд между инструментами напрямую не стоит.

Зона живёт, пока цена её не пробила. Пробила — помечается снятой.

5. Индикатор Силы и дивергенции

В нижнем окне — сила быков и медведей, нормированная на средний размах цены. Сама по себе высота столбика говорит немного. Работает сравнение столбиков с ценой.

Главное, что там стоит искать, — дивергенция: цена идёт выше, а сила — ниже. Движение продолжается по инерции, но толкает его всё меньше народу.

На продажу — две-три вершины цены идут всё выше, а столбики Силы быков на этих самых вершинах всё ниже. На покупку — зеркально: впадины цены всё ниже, а столбики Силы медведей на них всё мельче.

Два важных правила. Первое: значение берётся строго с того же бара, где стоит вершина цены, — не рядом, не «примерно там». Второе: вершинами считаются точки структуры, а не всякий мелкий зубец между ними.

Короткая и длинная дивергенция различаются не расстоянием между вершинами, а нулевой линией.

Короткая — все столбики между вершинами лежат по одну сторону от нуля. Сила слабеет, но сторона своё не отдаёт: это признак передышки внутри движения.

Длинная — между вершинами ноль пересекается. Инициатива в середине успела перейти к противоположной стороне и вернуться. Это уже не передышка, а борьба, и такое расхождение весит больше.

Напомню: автоматически индикатор дивергенции не размечает. Вы смотрите на две панели сразу и сравниваете их глазами — вершину цены с её же столбиком.

Удачной торговли!
Produtos recomendados
What Is Trend Master Pro? Trend Master Pro   is a professional-grade trend trading indicator built for MetaTrader 5. It was designed with one goal in mind — to keep you on the right side of the market at all times by combining three powerful technical tools into a single, clean, easy-to-read display directly on your price chart. Instead of cluttering your screen with multiple separate indicators, Trend Master Pro fuses an   EMA Ribbon trend filter , a   ZigZag swing point engine , and a   breako
RBreaker
Zhong Long Wu
RBreaker Gold Indicators é uma estratégia de negociação intradiária de curto prazo para futuros de ouro que combina duas abordagens: o seguimento de tendência e as reversões intradiárias. Ela permite capturar lucros durante mercados em tendência e também realizar lucros oportunamente e operar na direção oposta quando o mercado se reverte. Esta estratégia foi classificada por 15 anos consecutivos entre as dez estratégias de negociação mais lucrativas pela revista americana Futures Truth. Ela pos
RevTech
Bashier Awny Husein Ismail Alhafy
Revtech MT5 Indicator brings together institutional concepts, market-structure logic, and classic price action patterns in one advanced trading tool. From Fair Value Gaps and Order Blocks to Head & Shoulders and Triangle formations, Revtech helps traders identify quality setups with clear chart visuals and execution levels. With dashboard monitoring, alerts, and timeframe-based strategy alignment, Revtech is designed to turn raw price action into a structured trading opportunity. The indicator
Este indicador encontra os padrões de retração AB = CD. O padrão AB = CD Retracement é uma estrutura de preço de 4 pontos em que o segmento de preço inicial é parcialmente retraído e seguido por um movimento equidistante da conclusão da retirada, e é a base básica para todos os padrões harmônicos. [ Guia de instalação | Guia de atualização | Solução de problemas | FAQ | Todos os produtos ] Tamanhos de padrão personalizáveis Proporções AC e BD personalizáveis Períodos de interrupção personali
This trading indicator is non-repainting, non-redrawing, and non-lagging, making it an ideal choice for both manual and automated trading. It is a Price Action–based system that leverages price strength and momentum to give traders a real edge in the market. With advanced filtering techniques to eliminate noise and false signals, it enhances trading accuracy and potential. By combining multiple layers of sophisticated algorithms, the indicator scans the chart in real-time and translates comple
Royal Wave Pro M5
Vahidreza Heidar Gholami
3.5 (4)
Royal Wave is a Trend-Power oscillator which has been programmed to locate and signal low-risk entry and exit zones. Its core algorithm statistically analyzes the market and generates trading signals for overbought, oversold and low volatile areas. By using a well-designed alerting system, this indicator makes it easier to make proper decisions regarding where to enter and where to exit trades. Features Trend-Power Algorithm Low risk Entry Zones and Exit Zones Predictions for Overbought and Over
Structure King AI Signal Structure King AI Signal is a professional MetaTrader 5 trading indicator designed to help traders analyze market structure, trend direction, multi-timeframe confirmation and trade management from one clean dashboard. Key Features • Market Structure & Trend Analysis • BUY / SELL Signals • Multi-Timeframe (HTF) Confirmation • Entry Price Levels • Dynamic Stop Loss (SL) • TP1 / TP2 / TP3 Levels • ATR Volatility Analysis • ADX Trend Strength Filter • Adaptive Market Filter
Fib Auto Trendline
Nhlanhla Brilliant Mashavha
INTRODUCTION The  Fib Autotrendline   is a basic tool that analysts use to find out when a security's trend is reversing. By determining the   support and resistance areas , it helps to identify significant changes in price while filtering out short-term fluctuations, thus eliminating the noise of everyday market conditions. It is an excellent tool for any trader who follows indicators that use   swing highs  and   swing lows . How to Use the fib Auto Trendline Indicator The Fib Auto Trendline
Adjustable Consecutive Fractals  looks for 2 or more fractals in one direction and sends out a on screen alert, sound alert and push notification, for strong reversal points . Adjustable Consecutive Fractals, shows the fractals on chart along with a color changing text for buy and sell signals when one or more fractals appear on one side of price. Adjustable Consecutive Fractals is based Bill Williams Fractals . The standard Bill Williams fractals are set at a non adjustable 5 bars, BUT withe th
ATrend
Zaha Feiz
4.83 (18)
ATREND: Como Funciona e Como Usá-lo #### Como Funciona O indicador "ATREND" para a plataforma MT5 é projetado para fornecer aos traders sinais robustos de compra e venda, utilizando uma combinação de metodologias de análise técnica. Este indicador aproveita principalmente o Intervalo Verdadeiro Médio (ATR) para medir a volatilidade, juntamente com algoritmos de detecção de tendências para identificar possíveis movimentos de mercado. Deixe uma mensagem após a compra e receba um brinde especial.
GDS Renko Entry Helper - Free Renko Price Interaction Indicator for MetaTrader 5 GDS Renko Entry Helper is a free Renko price interaction indicator for MetaTrader 5. It helps traders highlight important areas where price reacts, slows down, returns to a zone or changes behavior around support and resistance. The tool is designed for manual Renko analysis. It does not generate buy or sell signals and does not tell the trader when to enter the market. Its purpose is to help focus attention on area
Part of the Shved Market Analysis System (SMAS). Identifies areas of maximum Supply and Demand zone density and confluence, providing deeper market insight as part of the integrated SMAS ecosystem. Shved Supply and Demand Cluster Profile is a revolutionary, high-performance visualization tool designed to map market volume density and supply/demand zone clusters, created by a professional trader for traders. The Shved Supply and Demand Cluster Profile is a core component and the analytical hear
Cycle Projection Pro is a cyclical analysis indicator for MetaTrader 5, designed for the Daily timeframe. It identifies and projects recurring price cycles forward in time, helping you estimate when — not how much — the market may be approaching a turning point. How it works The indicator sums six harmonic cycles with explicit periods — Weekly, Biweekly, Monthly, Quarterly, Semiannual, Annual — each independently adjustable and can be turned on or off. Their combination produces a composite wav
Pullback Hunter
Anton Polkovnikov
PULLBACK HUNTER What is every trader's cherished dream? To see without delay the places where the reversal will happen. This, of course, is from the category of magic, though... nothing is impossible. But for now I've prepared for you an indicator that marks in real time the end of corrections to the current movement or in short - catches pullbacks.What is the main point? Many people practice rebounds when the price moves in the direction of the open position. And they do them on the formation o
WBS SMC Without Repaint – Ultimate XAUUSD Scalping Engine (M5 Timeframe) Take your Gold trading to the institutional level with "WBS SMC Without Repaint", a highly advanced premium indicator engineered specifically for XAUUSD (Gold) on the M5 (5-Minute) timeframe.  Built upon the core pillars of Smart Money Concepts (SMC) combined with precise algorithmic candle pattern recognition, this tool identifies high-probability institutional footprints in real-time. Best of all: 100% ABSOLUTELY
RVE Echo Indicator MT5 — Rejection Velocity Echo RVE Echo Indicator is a custom MetaTrader 5 technical indicator designed to detect abnormal price rejection, sharp velocity changes, and possible reversal zones in the market. RVE stands for Rejection Velocity Echo . The indicator studies how strongly price moves compared to its recent rejection behavior, then highlights moments where the current price movement appears unusually aggressive. This can help traders identify possible exhaustion, rejec
Smart tp sl signals
Layth Adil Khalaf Khalaf
Smart TP SL Signals is a professional, institutional-grade execution and visualization indicator designed for MetaTrader 5. Built on proven Smart Money Concepts (SMC) and ICT market structure principles , this tool automatically identifies high-probability entry levels and projects clean, dynamic Risk-to-Reward targets directly onto your chart in real time. No more guessing where to enter, where to place your stop loss, or when to take profits. The indicator handles all price projection calculat
FREE
Shved Structure Engine Part of the Shved Market Analysis System (SMAS) Shved Structure Engine is a professional market structure analysis module designed to automatically build dynamic market channels based on Supply & Demand technology. Unlike traditional channel indicators that rely on moving averages, regression lines, or price extremes, Structure Engine analyzes market structure and automatically generates adaptive channels that reflect changing market conditions. Using proprietary market st
MercariaPattern1-2-3 відстежує рух ціни, знаходить трьоххвильові структури 1-2-3 та підсвічує момент, коли сценарій підтверджується пробоєм ключового рівня. MercariaPattern1-2-3 tracks price movement, detects three-leg 1-2-3 structures and highlights the moment when the scenario is confirmed by a key level breakout. Індикатор збирає локальні свінги в компактну фігуру 0–1–2–3 , чекає підтвердженого пробою та будує стрілку входу з готовими рівнями SL/TP. The indicator combines local swings into a
GDS Renko ATR - ATR-Based Renko Chart Indicator for MetaTrader 5 GDS Renko ATR is a free ATR-based Renko chart indicator for MetaTrader 5. It helps traders build and study Renko movement using a volatility-adaptive brick size based on Average True Range. The purpose of this tool is to provide a flexible Renko chart foundation for manual market analysis. It does not predict the market, does not generate buy or sell signals and does not decide whether a trade should be opened. Renko EDGE EA Golde
Daily Volume Profile - See Where Smart Money Trades Stop guessing support and resistance. Start seeing where REAL volume is. The Daily Volume Profile indicator reveals the hidden structure of the market by showing exactly where trading activity concentrates at each price level. While most traders use lagging indicators, you'll see where institutional money positions itself - BEFORE the move happens. What You Get: → POC (Point of Control) - The most powerful S/R level of each day, shown as a cle
Fibaction
Abdelkhalek Orabi
Indicator Name: Fibaction – price action candle Detector Description: Fibo Signal Boxes is a powerful Smart Money Concept (SMC)-inspired indicator that auto-detects price action candles. bullish hammers and shooting stars, then draws precise Fibonacci entry zones and multiple take-profit levels directly on the chart. as for the SL personally i use 40 pips rules  Key Features: Detects bullish hammer and shooting star reversal candles. Automatically draws Fibonacci entry and TP boxes. as
Kalman Cone Forecast MT5 Adaptive forecast cone, trend pressure, and exhaustion detection in one clean trading panel. Kaman Cone Forecast is an adaptive predictive indicator for MetaTrader 5. It uses Kalman filter smoothing to reduce market noise, estimate current trend pressure, and project a forward price cone based on live volatility conditions. Instead of showing only a moving average line or a basic volatility band, Kalman Cone Forecast gives you a clearer answer to three important questi
JTC Smart Gold Indicator is a professional trading indicator designed exclusively for the XAUUSD (Gold) 5-minute timeframe on MetaTrader 5. It focuses on identifying high-quality trading opportunities during the New York session while helping traders maintain a disciplined and structured trading approach. Unlike indicators that generate excessive signals, JTC is designed to prioritise quality over quantity, typically highlighting a small number of carefully selected opportunities during active
STRICTLY FOR BOOM INDEX ONLY!!!!! Here I bring the Maximum Trend Arrows OT1.0 MT5 indicator. This indicator is made up of a combination of different trend indicators for entries and exits, for entries an orange arrow will paint on the chart below the current market and a red flag for closing of trades and it produces buy arrows only. When the orange arrow appears, it will appear along with it's sound to notify you. The 1H timeframe is recommended, don't use it anywhere else than on the 1H timefr
Advanced Fibonacci Golden Zone Advanced Fibonacci Golden Zone is a professional smart-structure Fibonacci indicator for MetaTrader 5 designed to help traders identify high-probability retracement zones, market structure shifts, and confirmation-based entries. The indicator automatically detects bullish and bearish impulse legs, draws Fibonacci retracement levels, highlights the Golden Zone area, and provides confirmation signals based on price action and higher timeframe market bias. It is suita
Bollinger Trend Lines – MT4 & MT5 Bollinger Trend Lines is a professional volatility-based trend indicator designed to clearly identify trend direction and dynamic stop levels using Bollinger Bands. Fuses on one core principle: follow the trend, ignore noise, and let volatility define the stop. How it works The indicator builds trailing trend lines using Bollinger Bands: In an uptrend , the lower band trails price and can only rise In a downtrend , the upper band trails price and can only
Matrix Currency
Augusto Martins Lopes
Matrix Currency - Ferramenta de Análise Multi-Timeframe O Matrix Currency é um indicador avançado para análise de força das moedas no mercado Forex, projetado para oferecer monitoramento eficiente e suporte estratégico nas suas operações de trading. Características Principais: Análise Multi-Timeframe : Monitora múltiplos períodos simultaneamente (M1 a MN1) com atualização em tempo real em uma matriz intuitiva. Sistema de Alertas : Notificações configuráveis, via pop-up, email e dispositivos móv
FREE
Footprint — é um indicador para análise de order flow e volume. Ele ajuda a identificar a estrutura do mercado no nível de clusters, encontrar zonas-chave com alta atividade e trabalhar com filtros diretamente no gráfico, sem a necessidade de abrir constantemente a janela de configurações. Recursos do indicador Footprint gráfico de clusters Bid x Ask, Delta; painel de controle no gráfico; controles deslizantes (sliders) para ajuste de filtros; Absorption; Initiative; Stacked Imbalances; Big Trad
KasTon Trend System: The Complete 2-in-1 Trading Strategy Identify the Trend, Confirm the Signal, and Trade with Confidence! Do you suffer from confusion while trading? Do you find it difficult to determine the market's direction? Are you tired of losing money on false signals? The KasTon Trend System is here as an integrated solution to all these problems. This is not just an indicator; it is a complete trading strategy built on the synergy of two powerful, custom-built indicators. Our main g
Os compradores deste produto também adquirem
Trend Sniper X
Sarvarbek Abduvoxobov
4.9 (41)
Trend Sniper X é um indicador de acompanhamento de tendência para múltiplos tempos gráficos no MetaTrader 5 que ajuda os traders a identificar a direção da tendência e potenciais pontos de reversão com clareza e precisão. para MT4: https://www.mql5.com/en/market/product/193245 Informações sobre o preço: O preço atual é promocional e está sujeito a alterações à medida que novas atualizações e funcionalidades forem lançadas. Oferta Bônus: Para obter o Auto-Trade Assistant EA GRATUITO para este in
Smart Trend Trading System — MetaTrader 5 Após a compra, envie-me uma mensagem no MQL5 para receber Smart Universal Expert Advisor GRÁTIS, além do curso online, do manual em PDF e do acesso ao grupo privado. O STTS reúne a direção da tendência, sinais de entrada e saída, zonas de reversão e níveis de preço importantes diretamente no seu gráfico. Siga o sistema manualmente ou conecte um EA compatível separado para executar operações automaticamente com as configurações que você escolher. UM SISTE
A lenda está de volta: Entry Points Pro 10. O relançamento do lendário indicador que se manteve por 3 anos no Top-3 do MQL5 Market. Centenas de avaliações entusiasmadas (589 nas duas versões), milhares de traders operam com ele todos os dias, 31.000+ downloads da versão demo   MT4+MT5 . Li cada avaliação de vocês ao longo de cinco anos — e, em vez de promessas, coloquei as respostas dentro da versão 10. Do autor que está no mercado desde 1999 e valoriza a honestidade, a própria reputação e os se
Neuro Poseidon MT5
Daria Rezueva
4.75 (52)
Neuro Poseidon is a new indicator by Daria Rezueva. It combines precise trading signals with adaptive TP/SL levels - creating best possible trades as a result! Message me and get  Neuro Poseidon Assistant  as a gift to automize your trading process! What makes it stand out? 1. Proven profitability on all assets and timeframes 2. Only confirmed BUY and SELL signals present on the chart 3. Adaptive TP & SL levels generated by the software for each trade 4. Easy to understand - suitable for al
Adaptive Price Action Engine Compre um indicador, ganhe o EA de graça Análise Auto-Otimizada de Tendências e Padrões de Candlestick em Múltiplos Timeframes Os mercados estão em constante mudança, e nem todos os padrões de Price Action têm o mesmo valor em todas as condições de mercado. O Adaptive Price Action Engine foi desenvolvido para se adaptar às mudanças nas condições do mercado, combinando estrutura de tendência, análise Multi-Timeframe, padrões de candlestick e otimização estatística em
Auto Optimized SpeedAngle é um sistema de vetorização de momentum de nível institucional que elimina o sobreajuste ( curve-fitting ) por meio da otimização contínua de avanço ( Walk-Forward Optimization , WFO). Em vez de depender de entradas estáticas que se degradam quando os regimes de mercado mudam, o indicador recalibra dinamicamente seus parâmetros utilizando validação fora de amostra ( Out-of-Sample , OOS), garantindo que os sinais exibidos representem vantagens estatísticas genuínas e não
M1 Sniper MT5
Oleg Rodin
5 (7)
O   M1 SNIPER   é um sistema indicador de negociação fácil de usar. É um indicador de seta projetado para o período M1. O indicador pode ser usado como um sistema independente para scalping no período M1 e pode ser usado como parte do seu sistema de negociação existente. Embora este sistema de negociação tenha sido projetado especificamente para negociação no M1, ele também pode ser usado em outros períodos. Originalmente, desenvolvi este método para negociar XAUUSD e BTCUSD. Mas considero-o úti
Gann Made Easy   é um sistema de negociação Forex profissional e fácil de usar, baseado nos melhores princípios de negociação usando a teoria do sr. W. D. Gann. O indicador fornece sinais precisos de COMPRA e VENDA, incluindo níveis de Stop Loss e Take Profit. Você pode negociar mesmo em movimento usando notificações PUSH. Entre em contato comigo após a compra para receber instruções de negociação e ótimos indicadores extras gratuitamente! Provavelmente você já ouviu muitas vezes sobre os método
ARIPoint
Temirlan Kdyrkhan
1 (4)
ARIPoint is a powerful trading companion designed to generate high-probability entry signals with dynamic TP/SL/DP levels based on volatility. Built-in performance tracking shows win/loss stats, PP1/PP2 hits, and success rates all updated live. Key Features: Buy/Sell signals with adaptive volatility bands Real-time TP/SL/DP levels based on ATR Built-in MA Filter with optional ATR/StdDev volatility Performance stats panel (Success, Profit/Loss, PP1/PP2) Alerts via popup, sound, push, or email Cu
Scalper Vault   é um sistema profissional de escalpelamento que fornece tudo o que você precisa para um escalpelamento bem-sucedido. Este indicador é um sistema de negociação completo que pode ser usado por comerciantes de forex e opções binárias. O período de tempo recomendado é M5. O sistema fornece sinais de seta precisos na direção da tendência. Ele também fornece sinais superiores e inferiores e níveis de mercado Gann. Os indicadores fornecem todos os tipos de alertas, incluindo notificaçõe
Entry In The Zone and SMC Multi Timeframe is a real-time market analysis tool based on Smart Money Concepts (SMC), designed to analyze market structure, price direction, and key trading zones. It supports both Single-Timeframe and Multi-Timeframe Analysis, providing a clearer view of overall market structure across multiple timeframes, with real-time BUY / SELL signals designed with a strict focus on No-Repaint principles. The signals are designed to help filter unclear setups and evaluate tradi
Olá, traders! A maioria dos traders de retalho depende de scripts web lentos. Para operar com verdadeira rentabilidade, é necessário um framework institucionalizado. O indicador Astro AI não é uma sobreposição gráfica padrão. Trata-se de uma rede neural compilada contendo dois agentes que são executados diretamente no seu terminal. Eis a tecnologia específica por trás do sistema: 1. Agente 1: Analista (Rede Neural Gráfica - GNN) Os mercados não são barras de preço isoladas; são redes de dad
Divergence Bomber
Ihor Otkydach
4.89 (94)
Cada comprador deste indicador recebe adicionalmente, e de forma gratuita: A ferramenta exclusiva "Bomber Utility", que acompanha automaticamente cada operação, define os níveis de Stop Loss e Take Profit e fecha operações de acordo com as regras da estratégia; Arquivos de configuração (set files) para ajustar o indicador em diferentes ativos; Set files para configurar o Bomber Utility nos modos: "Risco Mínimo", "Risco Balanceado" e "Estratégia de Espera"; Um vídeo tutorial passo a passo que a
Volatility Master for MetaTrader is a real-time dashboard tool that scans up to  50 symbols  to identify high-volatility , trending markets instantly. With bullish/bearish signals, customizable alerts, and a user-friendly interface, it helps you avoid range-bound conditions and focus on high-probability trades. Clarity leads to confidence. Trade confidently and protect your capital effectively with this powerful dashboard. We don't offer free or bonus indicators in exchange of reviews from you.
Quantum TrendPulse
Bogdan Ion Puscasu
5 (26)
Apresentando   Quantum TrendPulse   , a ferramenta de negociação definitiva que combina o poder do   SuperTrend   ,   RSI   e   Stochastic   em um indicador abrangente para maximizar seu potencial de negociação. Projetado para traders que buscam precisão e eficiência, este indicador ajuda você a identificar tendências de mercado, mudanças de momentum e pontos de entrada e saída ideais com confiança. Principais características: Integração SuperTrend:   siga facilmente a tendência predominante do
Apresentando       Quantum Breakout PRO   , o inovador Indicador MQL5 que está transformando a maneira como você negocia Breakout Zones! Desenvolvido por uma equipe de traders experientes com experiência comercial de mais de 13 anos,       Quantum Breakout PRO       foi projetado para impulsionar sua jornada comercial a novos patamares com sua estratégia de zona de fuga inovadora e dinâmica. O Quantum Breakout Indicator lhe dará setas de sinal em zonas de breakout com 5 zonas-alvo de lucro e su
PainX GainX Blue Spike Fusion AI Advanced Synthetic Index Spike Detection Indicator for MetaTrader 5 Discover potential spike setups with a clear, organized, and professional trading interface. PainX GainX Blue Spike Fusion AI is a specialized indicator designed for traders who monitor synthetic indices and want a structured way to observe potential price spike opportunities. The indicator combines signal monitoring, market-condition analysis, visual alerts, and event tracking in one convenient
Difícil de encontrar e com pouca frequência, as divergências são um dos cenários de negociação mais confiáveis. Este indicador localiza e verifica automaticamente divergências ocultas e regulares usando seu oscilador favorito. [ Guia de instalação | Guia de atualização | Solução de problemas | FAQ | Todos os produtos ] Fácil de trocar Encontra divergências regulares e ocultas Suporta muitos osciladores conhecidos Implementa sinais de negociação baseados em fugas Exibe níveis adequados de sto
RelicusRoad Pro MT5
Relicus LLC
4.96 (25)
Pare de chutar suas operações. Saiba quando entrar, onde sair e para que lado o mercado está pendendo, tudo em um único gráfico. O RelicusRoad Pro reúne quase vinte ferramentas em um só indicador, e você liga apenas as que combinam com o seu jeito de operar. Entradas claras. Saídas claras. Um plano em cada gráfico. Parece familiar? Você compra, e o preço vira contra você um minuto depois. Você fecha cedo demais e depois vê o movimento continuar sem você. Cinco indicadores no gráfico, cinco respo
Quantum Direction é um indicador profissional de acompanhamento de tendências, desenvolvido para identificar a direção do mercado, detectar mudanças iniciais de tendência e fornecer sinais filtrados de entrada e saída. Este indicador inclui o Quantum Trade Assistant gratuito, uma ferramenta profissional de gestão de operações disponível no MQL5 Market. Ele pode se conectar diretamente ao Quantum Direction e abrir operações automaticamente quando um sinal válido aparece ou fechar operações quando
OrderFlux – Indicador de Order Flow e Footprint para MetaTrader 5 OrderFlux é um indicador profissional de fluxo de ordens (Order Flow) e footprint para MetaTrader 5. Ele abre cada vela individual e revela o que está acontecendo no seu interior: o volume negociado em cada nível de preço, separado em compradores e vendedores agressivos. A partir destes dados de ticks, um gráfico Footprint completo é construído em tempo real, incluindo Delta, Imbalances, Volume Profile e Market Profile . Um gráfic
Power Candles MT5
Daniel Stein
4.58 (12)
Power Candles V3 - Indicador de força com auto-otimização O Power Candles V3 transforma a força da moeda e do instrumento num plano de negociação prático em todos os gráficos aos quais está associado. Em vez de se limitar a colorir as velas, executa uma otimização automática em tempo real em segundo plano e apresenta-lhe os melhores valores de Stop Loss, Take Profit e limiar de sinal para o símbolo em questão. Basta um clique para o adotar na negociação em tempo real — as linhas de entrada, Stop
M1 Quantum MT5
Hamed Dehgani
4.2 (10)
Sinais de Trading ao Vivo usando o M1 Quantum: Sinal   (Operação executada automaticamente pelo Quantum Trade Assistant , incluído gratuitamente neste produto.) Últimas Notícias : A versão 1.64 foi lançada. Agora, todas as operações têm um Stop Loss colocado atrás das zonas relevantes de Suporte/Resistência. A função Smart Close também foi aprimorada para aumentar o desempenho do EA nesta versão. Desde 9 de agosto, o sinal ao vivo está sendo executado na versão 1.64. Plano de Preços: Preço Atua
CRT Pro is a complete Candle Range Theory toolkit for MetaTrader 5. It finds the CRT model on up to three timeframes and adds the tools needed to read it: higher-timeframe candles, structure shifts, fair value gaps, liquidity sweeps, a bias table and SSMT divergence. Every module can be switched on or off. 1. CRT Model A CRT model is built from two candles of the chosen CRT timeframe. C1 is the range candle. C2 is the sweep candle: it takes the high or the low of C1 and closes back inside the
Currency Strength Wizard   é um indicador muito poderoso que fornece uma solução completa para uma negociação bem-sucedida. O indicador calcula o poder deste ou daquele par forex usando os dados de todas as moedas em vários intervalos de tempo. Esses dados são representados em uma forma de índice de moeda fácil de usar e linhas de energia de moeda que você pode usar para ver o poder desta ou daquela moeda. Tudo o que você precisa é anexar o indicador ao gráfico que deseja negociar e o indicador
ICT PO3 (Power of 3) AMD Protocol Framework Indicator True Time & Structure Integration   |  Non-Repainting | Real-Time  | Multi-Asset  | MT4 Version Available Full Setup Guide & Strategy Playbook: https://www.mql5.com/en/blogs/post/768683 The ICT Power of Three (PO3): The Complete Guide to Accumulation, Manipulation, and Distribution https://www.mql5.com/en/blogs/post/771729 MT4 Version: https://www.mql5.com/en/market/product/171742 Indicator Overview The ICT PO3 AMD Protocol Framework i
Bill Williams Advanced
Siarhei Vashchylka
5 (11)
Bill Williams Advanced is designed for automatic chart analysis using Bill Williams' "Profitunity" system. The indicator analyzes four timeframes at once. Manual (Be sure to read before purchasing) Advantages 1. Analyzes the chart using Bill Williams' "Profitunity" system. Signals are displayed in a table in the corner of the screen and on the price chart. 2. Finds all known AO and AC signals, as well as zone signals. Equipped with a trend filter based on the Alligator. 3. Finds "Divergence Bar
Advanced Supply Demand MT5
Bernhard Schweigert
4.53 (15)
Atualmente com 33% de desconto! A melhor solução para qualquer Trader Novato ou especialista! Este indicador é uma ferramenta de negociação exclusiva, de alta qualidade e acessível porque incorporamos uma série de recursos proprietários e uma nova fórmula. Com esta atualização, você poderá mostrar fusos horários duplos. Você não só será capaz de mostrar um TF mais alto, mas também mostrar ambos, o TF do gráfico, MAIS o TF mais alto: MOSTRANDO ZONAS ANINHADAS. Todos os traders de Oferta e Demanda
Superhero
Ihor Otkydach
5 (3)
O indicador SUPERHERO é um sistema de negociação multimoeda concebido numa base «tudo incluído». O indicador analisa o mercado de forma independente e fornece sinais sobre quando abrir e encerrar posições. Utiliza ordens Stop Loss e Take Profit. O rácio R:R é de 1:1. Este sistema pode enviar notificações push para o seu smartphone, para que possa realizar transações «em qualquer lugar», sem precisar de estar preso a um computador. É perfeito para empresas de negociação por conta própria. UM BÓNU
CGE Trading Suite
Carl Gustav Johan Ekstrom
5 (2)
Institutional-Grade Analytics for MT5 The full analytical edge of a professional trading desk, built into your MT5 chart. Standard retail platforms lack the depth required for professional market analysis. The CGE Trading Suite bridges this gap, transforming MetaTrader 5 into a comprehensive workspace. By integrating 22 proprietary modules into a single, unified chart interface, the suite eliminates fragmented analysis. It provides definitive clarity across market structure, timing, momentum,
Filtro:
Sem comentários
Responder ao comentário