Elder MTF Indicator
- Indicadores
- Versão: 1.1
- Ativações: 20

3Candle Elder — Multi-Timeframe Confluence Panel
3Candle Elder puts three timeframes side by side in a single on-chart panel and tells you, at a glance, whether they agree. It is built on the bones of one of the most respected frameworks in trading — Dr. Alexander Elder's Triple Screen system — and modernized into a fast, objective, non-repainting dashboard that reads the same way whether you scalp the one-minute or swing the daily.
---
Part 1 — The Foundation: Dr. Alexander Elder's Triple Screen
The Triple Screen trading system was introduced by Dr. Alexander Elder in his classic book Trading for a Living (1993). Elder set out to solve a problem every trader runs into: different tools and different timeframes constantly disagree. A trend indicator says "buy" while an oscillator screams "overbought." One timeframe looks bullish, the one below it looks bearish. Most traders resolve this by staring harder at a single chart — and get whipsawed for it.
Elder's insight was to stop asking one chart to do every job, and instead build a hierarchy of timeframes, each assigned the task it is actually good at. He borrowed a metaphor from the old Dow Theory writer Robert Rhea, who described market movement like the ocean — tides, waves, and ripples — and mapped it onto three screens:
The first screen — the Tide. Your highest timeframe. Its only job is to establish the direction of the major trend. Whatever the tide is doing sets your permission: if the tide is rising, you only look for longs; if it is falling, only shorts. You never trade against the tide.
The second screen — the Wave. The intermediate timeframe. This is where you find your setup — the pullback or pause inside the larger trend that offers a good entry point in the tide's direction.
The third screen — the Ripple. The lowest timeframe. This is the entry trigger: the precise moment to pull the trigger once the tide and wave have lined up.
Elder also gave a rule of thumb for spacing the screens: each timeframe should be separated from the next by roughly a factor of five (in practice, traders use anywhere from four to six). The three screens are meant to be different magnifications of the same market, not three unrelated charts.
The genius of the framework is that it forces discipline. You cannot take a trade just because the small timeframe looks exciting — the bigger picture has to agree first. Bias comes from the top down; timing comes from the bottom up.
---
Part 2 — How 3Candle Elder Is Built in That Spirit
3Candle Elder is a faithful modern implementation of that top-down architecture, with one deliberate, clearly-stated variation.
The same three-screen skeleton. The indicator shows three columns, defaulting to H4 (Tide), H1 (Wave) and M15 (Ripple) — spaced roughly a factor of four apart, squarely inside Elder's recommended range. The higher screens set the bias, the lower screen offers the entry. Every one of those timeframes is a user setting, so you can rebuild the ladder at any scale you like.
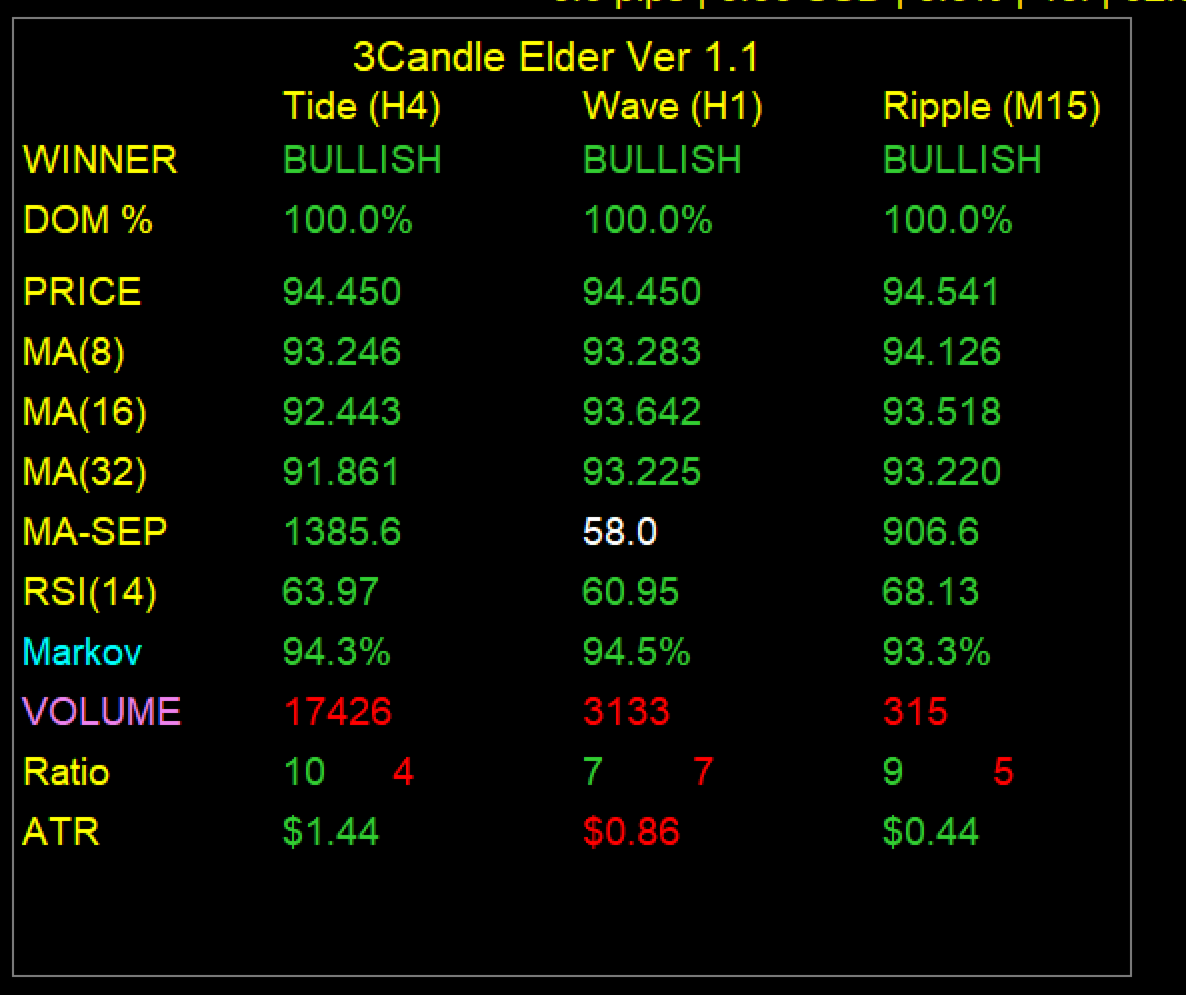
A unified reading engine, instead of three separate tools. Where Elder assigned a different indicator to each screen, 3Candle Elder runs the same condensed analysis engine on all three, so they are directly comparable. On each timeframe it evaluates a moving-average fan (fast, medium and slow), the separation of that fan, RSI, tick volume, a momentum bar-count, ATR, and a Markov continuation-probability model — then boils all of it down to a single verdict per screen: BULLISH, BEARISH or BALANCED, with a dominance percentage telling you how lopsided that verdict is.
The one deliberate difference — confluence, not counter-trend. Here honesty matters. Elder's original middle screen is a counter-trend mechanic: in an uptrend he waits for the wave's oscillator to dip into oversold, and buys the pullback. 3Candle Elder instead reads alignment — it lights up when the screens agree in the same direction. This is the confluence variant of the Triple Screen idea, and it is how a great many modern traders actually run the concept. So 3Candle Elder is pure Triple Screen in its architecture (three magnifications, bias on top, entry on the bottom) while using a clean, objective confluence mechanic rather than the original dip-buy. If you have read Elder, you will recognize the skeleton instantly and understand exactly where this tool takes its own path.
Built on closed bars — no repainting. Every value in the panel is read from the last closed bar of its own timeframe. A closed bar's data is final, so the readings do not flicker or rewrite themselves as price moves within a bar. Your H4 column holds steady for four hours and only updates when a fresh H4 candle closes. That stability is what makes the panel trustworthy for decisions and consistent between live and backtest behaviour.
---
Part 3 — Reading the Panel
The three columns
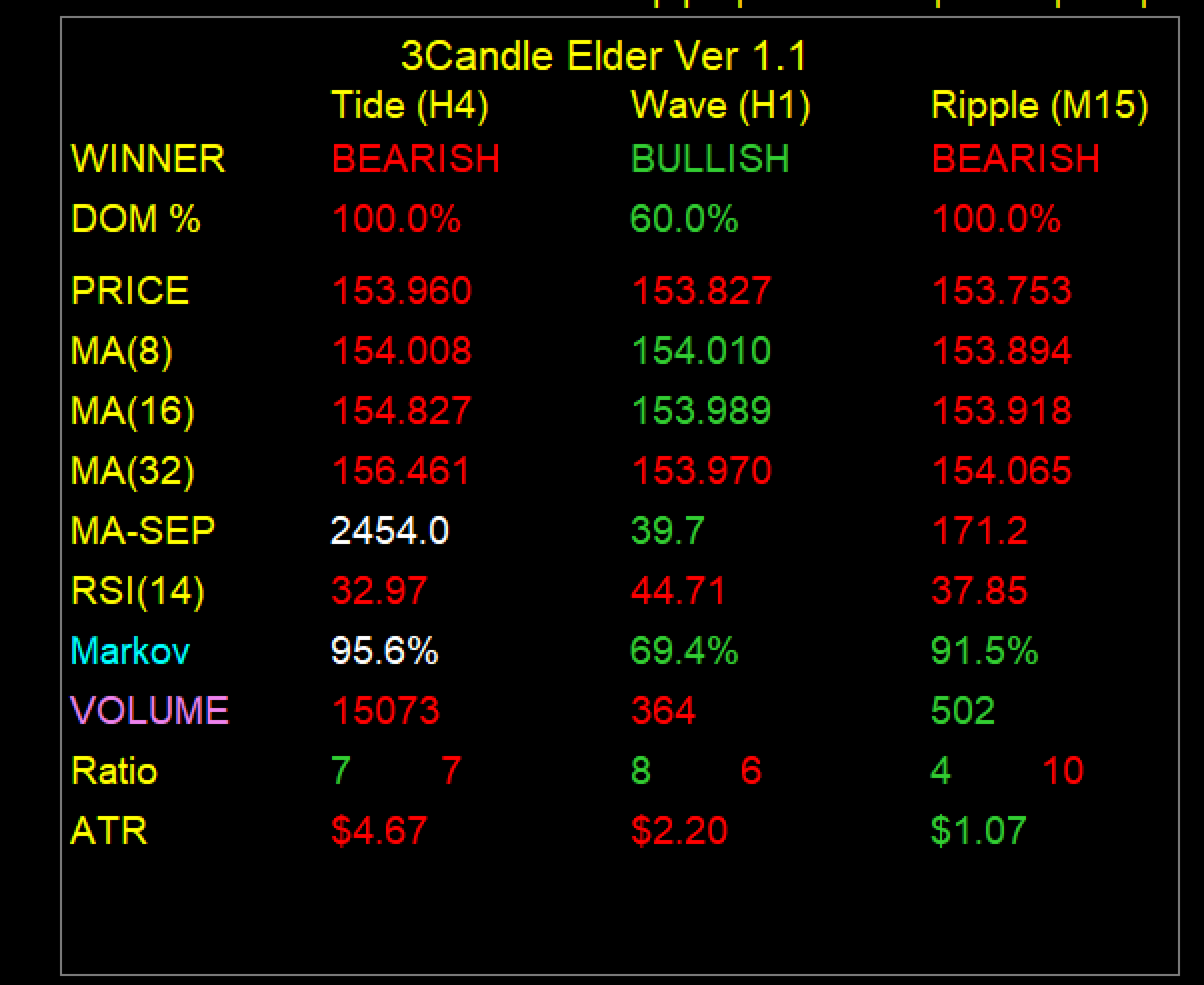
Each column is one timeframe — its role and period are shown in the header (e.g. Tide (H4), Wave (H1), Ripple (M15)). Every number in a column is that timeframe's most recently closed bar.
The rows
WINNER — the screen's overall verdict: BULLISH, BEARISH or BALANCED. This is the row you read first.
DOM % — how one-sided that verdict is. 50% is a coin-flip; 100% means every voting component agrees.
PRICE — the last closed price on that timeframe.
MA (fast / medium / slow) — the three moving averages. The row labels show your chosen periods.
MA-SEP — the distance between the fast and slow MA, in points. A widening gap in the trend's direction signals momentum building.
RSI — the RSI reading on that timeframe.
Markov — a continuation probability: based on that timeframe's own recent history, how often the current condition has carried through to the next bar. Higher means the present state has tended to persist.
VOLUME — the last closed bar's tick volume.
Ratio — a momentum count: up-bars (green) versus down-bars (red) over the lookback window.
ATR — the average true range, converted into a dollar figure for your chosen lot size, so you can read expected range in money rather than raw price.
The color grammar (important)
Across the whole panel, color tells you direction of change, and the number tells you the level. Green means the value rose versus the previous closed bar; red means it fell; white means little or no change. So a score can be high yet colored red — that simply means it is high but easing off. Once this clicks, you can read the entire panel in a second.
How to read it at a glance
Look down the three WINNER cells. Three of the same color is full confluence — all timeframes agree. When the top two agree (Tide and Wave), you have bias plus setup; adding agreement from the Ripple gives you the entry timeframe's blessing as well. The DOM % and Markov rows then tell you how much conviction sits behind each screen's verdict.
---
Part 4 — Settings You Can Tweak
Setting What it does Default
TF_Tide / TF_Wave / TF_Ripple The three screens. The single most important setting — set these to any three timeframes to rebuild the ladder for your style. H4 / H1 / M15
EnableGlobalExport Publishes the panel's readings and alignment flags as global variables for an Expert Advisor to read. true
MirrorToLegacy3Candle Optionally also writes a legacy variable set from the entry (Ripple) screen, for existing tools that expect it. Leave off unless you know you need it. false
Markov_Lookback How many bars of history the continuation model studies. Smaller = faster and more reproducible; larger = deeper but more history-dependent. 200
Markov_Threshold The probability level you consider meaningful for continuation. 60
RSI_Period RSI length used on every screen. 5
MA_Fast / Medium / Slow_Period The three moving-average lengths of the fan. 10 / 30 / 50
ATR_Period ATR length, and the window for the momentum (Ratio) count. 14
ATR_Dollar_Lots The lot size used to convert ATR into a dollar figure. 0.01
Scoring Weights (MA and RSI groups) How much each component contributes to a screen's score. Tune these to emphasize what matters to your style. balanced
BUY_Threshold / SELL_Threshold The score levels that define bullish and bearish states. 62 / 38
RSI_Overbought / Oversold The oscillator extremes used in scoring. 80 / 20
IncludeRSIInDominance Whether RSI gets a vote in the WINNER/DOM% verdict. false
Row display toggles Show or hide any individual row (Price, MAs, MA-Sep, RSI, Markov, Volume, Momentum, ATR). all on
Panel position, size, fonts, colours Full control over where the panel sits and how it looks. —
For Expert Advisor builders
With global export enabled, the indicator publishes a clean set of variables — a direction, dominance, score and Markov value for each screen — plus two alignment flags that map directly to a top-down workflow: one that fires when the two higher screens agree, and one that fires only when all three agree. An EA can gate its entries on those flags to trade strictly with multi-timeframe confluence.
---
Part 5 — Beyond Elder: Adapting It to Any Strategy
The following is my own perspective on how to get the most out of the tool.
Because all three timeframes are yours to set, 3Candle Elder is really a confluence engine at any scale rather than a fixed H4/H1/M15 system. The Elder spacing rule — each screen roughly four to five times the one below it — is a sound default at every speed, and the tool rewards keeping that proportion as you move it up or down the clock.
A scalper can drop the ladder to something like M15 / M5 / M1 and shorten the MA and Markov settings for responsiveness, turning the panel into a fast confluence check before a quick in-and-out. A day trader might run H1 / M15 / M5. A swing trader is well served by D1 / H4 / H1, and a position or long-term trader by W1 / D1 / H4 — the same top-down logic, just measured in days and weeks instead of minutes. The panel does not change; only the horizon does.
Beyond running it as a standalone system, it works beautifully as a discipline filter over a strategy you already trade. Keep your existing entry method, but only take trades when the Tide — and ideally the Wave — agree with your direction. That single rule tends to strip out the low-quality trades taken against the larger flow. Trend and breakout traders can use the dominance percentage and the widening MA-SEP as a conviction gauge; more patient traders can watch for a screen sitting at extreme dominance with a weakening Markov as an early sign that a move is tiring.
To hone any approach, start on the defaults, then tune in this order: first set the three timeframes to match your holding period; next adjust the MA, RSI and ATR periods to suit the rhythm of your instrument; then lean on the scoring weights to emphasise the components you trust most; and finally use the dominance and Markov readings as your conviction filter rather than a trigger on their own. As always, test your specific timeframe set on your instrument before committing real capital — the tool's job is to make the market's structure legible, and the edge comes from how you apply it.
---
A Note on Risk
3Candle Elder is an analytical dashboard, not a signal service or a guarantee of profit. Its readings — including the Markov continuation probabilities — describe what the market has done, and past behavior does not guarantee future results. Trading carries real risk of loss. Test any configuration thoroughly, and use sound risk management on every trade.
---