Elder MTF Indicator

3Candle Elder — Multi-Timeframe Confluence Panel

3Candle Elder puts three timeframes side by side in a single on-chart panel and tells you, at a glance, whether they agree. It is built on the bones of one of the most respected frameworks in trading — Dr. Alexander Elder's Triple Screen system — and modernized into a fast, objective, non-repainting dashboard that reads the same way whether you scalp the one-minute or swing the daily.
---
Part 1 — The Foundation: Dr. Alexander Elder's Triple Screen
The Triple Screen trading system was introduced by Dr. Alexander Elder in his classic book Trading for a Living (1993). Elder set out to solve a problem every trader runs into: different tools and different timeframes constantly disagree. A trend indicator says "buy" while an oscillator screams "overbought." One timeframe looks bullish, the one below it looks bearish. Most traders resolve this by staring harder at a single chart — and get whipsawed for it.
Elder's insight was to stop asking one chart to do every job, and instead build a hierarchy of timeframes, each assigned the task it is actually good at. He borrowed a metaphor from the old Dow Theory writer Robert Rhea, who described market movement like the ocean — tides, waves, and ripples — and mapped it onto three screens:
The first screen — the Tide. Your highest timeframe. Its only job is to establish the direction of the major trend. Whatever the tide is doing sets your permission: if the tide is rising, you only look for longs; if it is falling, only shorts. You never trade against the tide.
The second screen — the Wave. The intermediate timeframe. This is where you find your setup — the pullback or pause inside the larger trend that offers a good entry point in the tide's direction.
The third screen — the Ripple. The lowest timeframe. This is the entry trigger: the precise moment to pull the trigger once the tide and wave have lined up.
Elder also gave a rule of thumb for spacing the screens: each timeframe should be separated from the next by roughly a factor of five (in practice, traders use anywhere from four to six). The three screens are meant to be different magnifications of the same market, not three unrelated charts.
The genius of the framework is that it forces discipline. You cannot take a trade just because the small timeframe looks exciting — the bigger picture has to agree first. Bias comes from the top down; timing comes from the bottom up.
---
Part 2 — How 3Candle Elder Is Built in That Spirit
3Candle Elder is a faithful modern implementation of that top-down architecture, with one deliberate, clearly-stated variation.
The same three-screen skeleton. The indicator shows three columns, defaulting to H4 (Tide), H1 (Wave) and M15 (Ripple) — spaced roughly a factor of four apart, squarely inside Elder's recommended range. The higher screens set the bias, the lower screen offers the entry. Every one of those timeframes is a user setting, so you can rebuild the ladder at any scale you like.
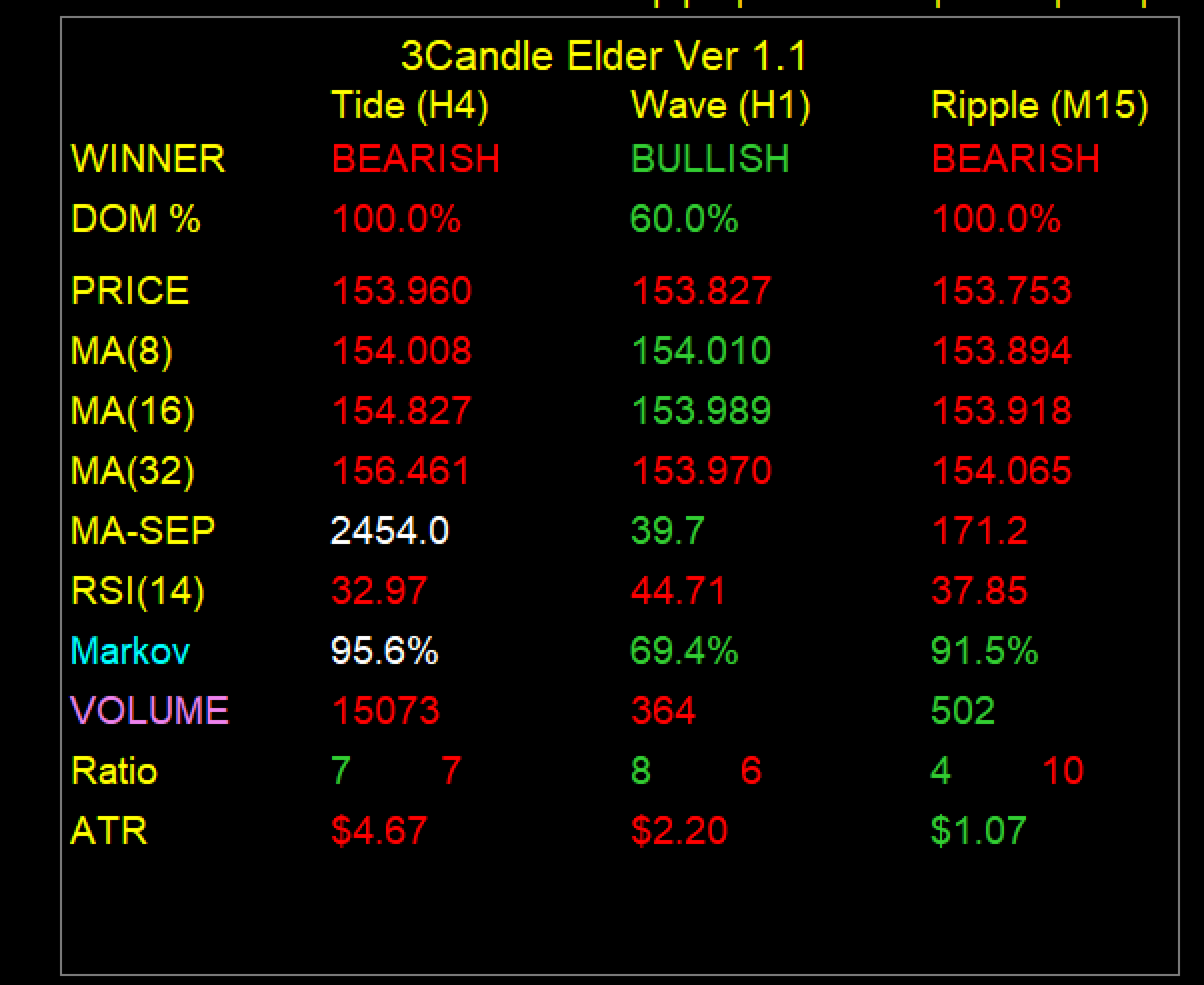
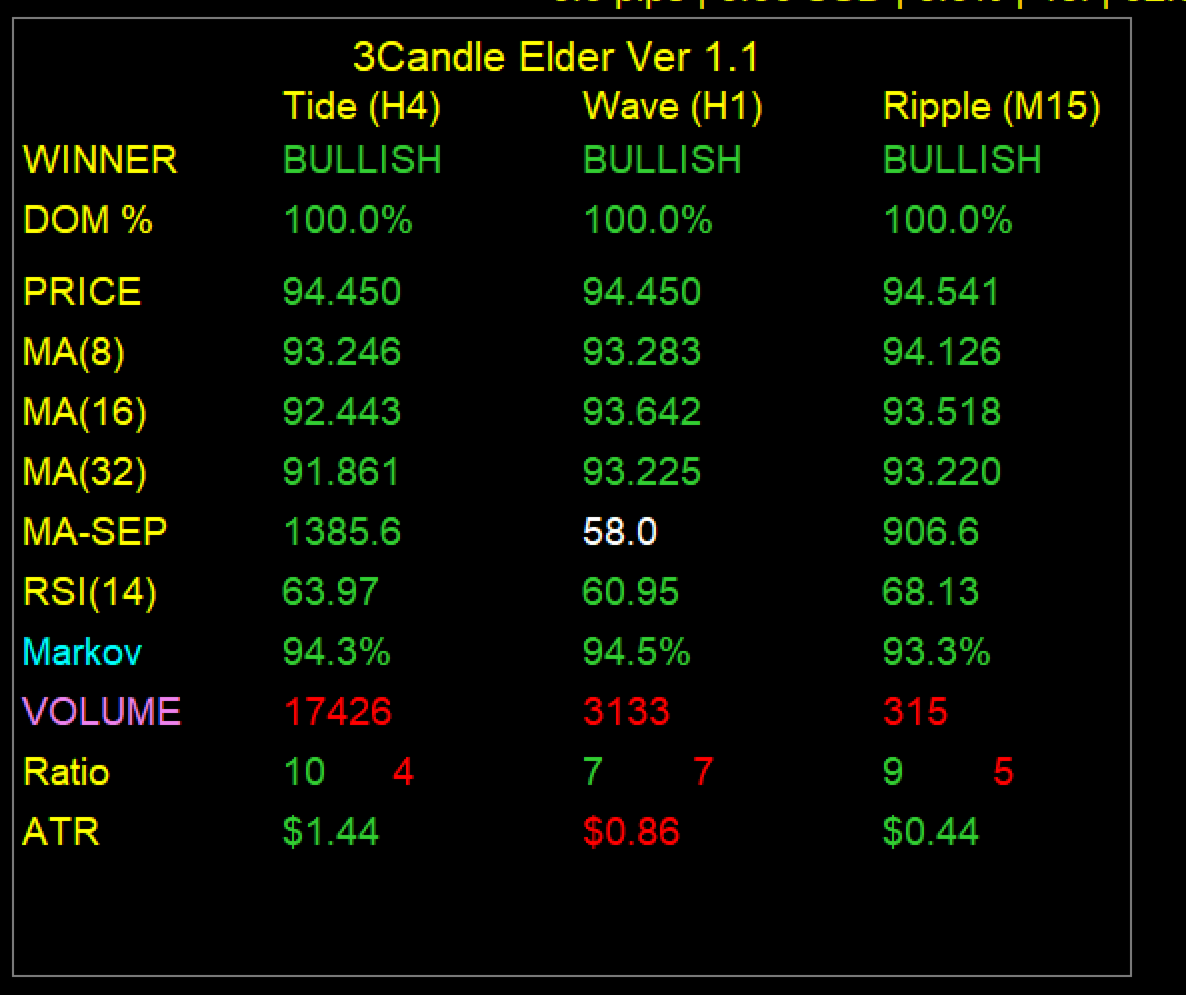
A unified reading engine, instead of three separate tools. Where Elder assigned a different indicator to each screen, 3Candle Elder runs the same condensed analysis engine on all three, so they are directly comparable. On each timeframe it evaluates a moving-average fan (fast, medium and slow), the separation of that fan, RSI, tick volume, a momentum bar-count, ATR, and a Markov continuation-probability model — then boils all of it down to a single verdict per screen: BULLISH, BEARISH or BALANCED, with a dominance percentage telling you how lopsided that verdict is.
The one deliberate difference — confluence, not counter-trend. Here honesty matters. Elder's original middle screen is a counter-trend mechanic: in an uptrend he waits for the wave's oscillator to dip into oversold, and buys the pullback. 3Candle Elder instead reads alignment — it lights up when the screens agree in the same direction. This is the confluence variant of the Triple Screen idea, and it is how a great many modern traders actually run the concept. So 3Candle Elder is pure Triple Screen in its architecture (three magnifications, bias on top, entry on the bottom) while using a clean, objective confluence mechanic rather than the original dip-buy. If you have read Elder, you will recognize the skeleton instantly and understand exactly where this tool takes its own path.
Built on closed bars — no repainting. Every value in the panel is read from the last closed bar of its own timeframe. A closed bar's data is final, so the readings do not flicker or rewrite themselves as price moves within a bar. Your H4 column holds steady for four hours and only updates when a fresh H4 candle closes. That stability is what makes the panel trustworthy for decisions and consistent between live and backtest behaviour.
---
Part 3 — Reading the Panel
The three columns
Each column is one timeframe — its role and period are shown in the header (e.g. Tide (H4), Wave (H1), Ripple (M15)). Every number in a column is that timeframe's most recently closed bar.
The rows
WINNER — the screen's overall verdict: BULLISH, BEARISH or BALANCED. This is the row you read first.
DOM % — how one-sided that verdict is. 50% is a coin-flip; 100% means every voting component agrees.
PRICE — the last closed price on that timeframe.
MA (fast / medium / slow) — the three moving averages. The row labels show your chosen periods.
MA-SEP — the distance between the fast and slow MA, in points. A widening gap in the trend's direction signals momentum building.
RSI — the RSI reading on that timeframe.
Markov — a continuation probability: based on that timeframe's own recent history, how often the current condition has carried through to the next bar. Higher means the present state has tended to persist.
VOLUME — the last closed bar's tick volume.
Ratio — a momentum count: up-bars (green) versus down-bars (red) over the lookback window.
ATR — the average true range, converted into a dollar figure for your chosen lot size, so you can read expected range in money rather than raw price.
The color grammar (important)
Across the whole panel, color tells you direction of change, and the number tells you the level. Green means the value rose versus the previous closed bar; red means it fell; white means little or no change. So a score can be high yet colored red — that simply means it is high but easing off. Once this clicks, you can read the entire panel in a second.
How to read it at a glance
Look down the three WINNER cells. Three of the same color is full confluence — all timeframes agree. When the top two agree (Tide and Wave), you have bias plus setup; adding agreement from the Ripple gives you the entry timeframe's blessing as well. The DOM % and Markov rows then tell you how much conviction sits behind each screen's verdict.
---
Part 4 — Settings You Can Tweak
Setting What it does Default
TF_Tide / TF_Wave / TF_Ripple The three screens. The single most important setting — set these to any three timeframes to rebuild the ladder for your style. H4 / H1 / M15
EnableGlobalExport Publishes the panel's readings and alignment flags as global variables for an Expert Advisor to read. true
MirrorToLegacy3Candle Optionally also writes a legacy variable set from the entry (Ripple) screen, for existing tools that expect it. Leave off unless you know you need it. false
Markov_Lookback How many bars of history the continuation model studies. Smaller = faster and more reproducible; larger = deeper but more history-dependent. 200
Markov_Threshold The probability level you consider meaningful for continuation. 60
RSI_Period RSI length used on every screen. 5
MA_Fast / Medium / Slow_Period The three moving-average lengths of the fan. 10 / 30 / 50
ATR_Period ATR length, and the window for the momentum (Ratio) count. 14
ATR_Dollar_Lots The lot size used to convert ATR into a dollar figure. 0.01
Scoring Weights (MA and RSI groups) How much each component contributes to a screen's score. Tune these to emphasize what matters to your style. balanced
BUY_Threshold / SELL_Threshold The score levels that define bullish and bearish states. 62 / 38
RSI_Overbought / Oversold The oscillator extremes used in scoring. 80 / 20
IncludeRSIInDominance Whether RSI gets a vote in the WINNER/DOM% verdict. false
Row display toggles Show or hide any individual row (Price, MAs, MA-Sep, RSI, Markov, Volume, Momentum, ATR). all on
Panel position, size, fonts, colours Full control over where the panel sits and how it looks.
For Expert Advisor builders
With global export enabled, the indicator publishes a clean set of variables — a direction, dominance, score and Markov value for each screen — plus two alignment flags that map directly to a top-down workflow: one that fires when the two higher screens agree, and one that fires only when all three agree. An EA can gate its entries on those flags to trade strictly with multi-timeframe confluence.
---
Part 5 — Beyond Elder: Adapting It to Any Strategy
The following is my own perspective on how to get the most out of the tool.
Because all three timeframes are yours to set, 3Candle Elder is really a confluence engine at any scale rather than a fixed H4/H1/M15 system. The Elder spacing rule — each screen roughly four to five times the one below it — is a sound default at every speed, and the tool rewards keeping that proportion as you move it up or down the clock.
A scalper can drop the ladder to something like M15 / M5 / M1 and shorten the MA and Markov settings for responsiveness, turning the panel into a fast confluence check before a quick in-and-out. A day trader might run H1 / M15 / M5. A swing trader is well served by D1 / H4 / H1, and a position or long-term trader by W1 / D1 / H4 — the same top-down logic, just measured in days and weeks instead of minutes. The panel does not change; only the horizon does.
Beyond running it as a standalone system, it works beautifully as a discipline filter over a strategy you already trade. Keep your existing entry method, but only take trades when the Tide — and ideally the Wave — agree with your direction. That single rule tends to strip out the low-quality trades taken against the larger flow. Trend and breakout traders can use the dominance percentage and the widening MA-SEP as a conviction gauge; more patient traders can watch for a screen sitting at extreme dominance with a weakening Markov as an early sign that a move is tiring.
To hone any approach, start on the defaults, then tune in this order: first set the three timeframes to match your holding period; next adjust the MA, RSI and ATR periods to suit the rhythm of your instrument; then lean on the scoring weights to emphasise the components you trust most; and finally use the dominance and Markov readings as your conviction filter rather than a trigger on their own. As always, test your specific timeframe set on your instrument before committing real capital — the tool's job is to make the market's structure legible, and the edge comes from how you apply it.
---
A Note on Risk

3Candle Elder is an analytical dashboard, not a signal service or a guarantee of profit. Its readings — including the Markov continuation probabilities — describe what the market has done, and past behavior does not guarantee future results. Trading carries real risk of loss. Test any configuration thoroughly, and use sound risk management on every trade.


---
추천 제품
Visual Dolphin Indicator
AL MOOSAWI ABDULLAH JAFFER BAQER
Visual Dolphin Indicator Unlock the rhythm of the market with the Visual Dolphin Indicator, your ultimate tool for identifying and capitalizing on market trends with clarity and confidence. Designed for both novice and experienced traders, this indicator eliminates the noise and guesswork, providing crystal-clear buy and sell signals directly on your chart. The Logic Behind the Waves The core of the Visual Dolphin Indicator is a sophisticated yet intuitive dual-wave system based on moving avera
Divergence Matrix Pro for MetaTrader 5 Divergence Matrix Pro is a confirmed multi-oscillator divergence indicator for MetaTrader 5. It detects regular and hidden divergence between price and selected oscillators, then presents the confirmed structure through divergence lines, pivot labels, action markers, an optional current-timeframe Matrix Panel and optional alerts. The indicator is an analysis and confirmation tool. It does not open or close trades, and the signal score is not a win rate or a
RED ZONE Monitor Loss-Cut & Break-Even Risk Monitor for Averaging Traders (MT5) RED ZONE Monitor is a risk management indicator for traders who use averaging, scaling-in, or multiple open positions . It visually displays: The loss-cut (liquidation) risk zone The break-even price Based on current open positions, lots, and margin conditions This indicator does not provide entry signals. It does not promise profits. It shows where your account actually fails if price moves against you. What RED ZO
CCI Fixed Dual
Edoardo Centorame
CCI FIXED DUAL이란 무엇인가 CCI FIXED DUAL은 전문적인 Trend Direction Filter로서, 다음 요소를 정확하게 식별하도록 설계되었습니다. 시장의 지배적인 방향 움직임의 구조적 품질 주요 추세와 가속 구간 사이의 일관성 이것은 직접적인 진입 지표가 아닙니다. 이것은 전통적인 오실레이터가 아닙니다. 이것은 컨텍스트 도구로서, 트레이더가 언제 거래해야 하고 언제 거래하지 말아야 하는지를 결정하도록 돕기 위해 설계되었으며, 시장의 노이즈와 해석 오류를 크게 줄여줍니다. CCI FIXED DUAL의 기본 철학 CCI FIXED DUAL이 기반으로 하는 원칙은 단순하지만 강력합니다. 신호는 시장 구조와 일치할 때만 가치가 있습니다. 이러한 이유로 이 지표는 단일 값을 사용하지 않습니다 가격에 충동적으로 반응하지 않습니다 억지 반전 지점을 찾지 않습니다 대신 다음 요소를 기반으로 계층적인 추세 해석을 구축합니다. Typical Price 기반 CCI 서로 다른
Renko System
Marco Montemari
This indicator can be considered as a trading system. It offers a different view to see the currency pair: full timeless indicator, can be used for manual trading or for automatized trading with some expert advisor. When the price reaches a threshold a new block is created according to the set mode. The indicator beside the Renko bars, shows also 3 moving averages. Features renko mode median renko custom median renko 3 moving averages wicks datetime indicator for each block custom notification
TheRealPrice v3.0 | Ultimate Spread & Ask Visualizer TheRealPrice is a high-precision utility for MetaTrader 5 designed to expose the hidden cost of every trade: The Spread . While standard charts only display the Bid price, professional traders know that buy orders and short-exits happen at the Ask price. TheRealPrice bridges this gap by drawing a dynamic, real-time horizontal line that tracks the exact Ask level, providing a clear visual representation of the current market spread. Why do you
Trend Follower LukaHo
Lukasz Mariusz Holla
TrendFollower (The Swiss Army Knife for Trends) Forget standard indicators. Discover TrendFollower – 5 strategies in one! Tired of indicators that show a buy signal when the market is long past its peak? Your moving averages are so laggy that they show last Tuesday's trend? Let's get this straightened out. I present to you TrendFollower – a powerful, modular framework (Institution-Grade) that analyzes market structure from five different perspectives. Whether you're a patient sw
RBreaker
Zhong Long Wu
RBreaker Gold Indicators는 금 선물을 위한 단기 데이 트레이딩 전략으로, 추세 추종과 데이 내 반전의 두 가지 거래 방식을 결합합니다. 추세 장에서 수익을 포착할 수 있을 뿐만 아니라, 시장이 반전될 때 적시에 이익을 확정하고 추세에 맞춰 반대 포지션을 잡을 수 있습니다. 이 전략은 미국 잡지 Futures Truth에서 15년 연속으로 가장 수익성 높은 트레이딩 전략 상위 10위 안에 선정되었습니다. 긴 라이프사이클을 자랑하며, 현재까지 국내외에서 널리 사용되고 연구되고 있습니다. 본 지표는 2026년 금 선물의 움직임을 반영하여 14일 ATR 지표를 기반으로 돌파 계수 A, 관찰 계수 B, 반전 계수 R을 보다 합리적인 값으로 정의했습니다. 매우 훌륭한 지표이며, 안정적인 연간 수익성을 달성했습니다. 강력히 추천합니다~ 위 지표는 변동성이 높은 상품에 적합하며, 매개변수는 금 선물, 주가 지수 선물 등에 적합합니다. 다른 상품이 필요한 경우 돌파 계수 A
KMB Smart Pattern Analyzer PRO
Karwan Msto Mohammed Mohammed
제품 개요 KMB Smart Pattern Analyzer PRO 는 사용자가 지정한 차트 범위 내에서 시장 패턴을 탐지하고 기술적 일치도를 기준으로 순위를 매기는 고급 기술 분석 인디케이터입니다. 하나의 전문적인 도구에 여러 분석 엔진을 결합합니다. 캔들스틱 패턴 분석 클래식 차트 패턴 인식 하모닉 구조 탐지 시장 구조 / SMC 분석 전체 차트에 무작위 신호를 표시하는 대신 사용자가 특정 시장 구간에 집중하여 가장 강한 패턴, 예상 방향, 돌파 레벨, 무효화 레벨 및 예상 목표 구간을 구조적으로 분석할 수 있도록 설계되었습니다. 주요 기능 가장 강한 Top 3 패턴 탐지 및 순위 제공 지원: 캔들스틱 패턴 클래식 차트 패턴 하모닉 패턴 Market Structure / SMC 사용자 지정 범위 분석 표시 정보: 패턴 유형 시장 방향 Score Momentum Breakout 레벨 T1 / T2 / T3 목표 Invalidation 레벨 Structure 정보 선택 영역 차트 표시
FREE
MT5용 Crypto_Forex 지표 축적 막대 패턴. - 지표 "축적 막대"는 가격 액션 거래를 위한 매우 강력한 돌파 중심 지표입니다. - 지표는 1개 막대 동안 좁은 영역에서 가격 축적을 감지하고 돌파 방향, 보류 주문 및 SL 위치를 표시합니다. - 강세 축적 막대 - 차트에 파란색 화살표 신호(그림 참조). - 약세 축적 막대 - 차트에 빨간색 화살표 신호(그림 참조). - 다시 칠하지 않고, 지연하지 않으며, 높은 R/R 비율(보상/위험). - 지표에는 조정 가능한 감도 매개변수가 있습니다. -   PC 및 모바일 알림 기능 포함. - 지표 "축적 막대 패턴"은 지원/저항 수준과 결합하기에 좋습니다. 여기를 클릭하여 고품질 트레이딩 로봇과 지표를 확인하세요! 이 MQL5 웹사이트에서만 제공되는 오리지널 제품입니다.
Basic information. To perform its work, the indicator takes data on volumes from a lower timeframe, builds Market Profiles for a higher timeframe and a histogram for the current timeframe. The indicator starts in several stages. In this case, messages like: "Build Source & Target TF. Step: …" are output to the log. The process can be accelerated by changing the input parameter Milliseconds between steps - the initialization speed. The final value of this parameter is always individual and is set
Price Magnet — Price Density and Attraction Levels Indicator Price Magnet is a professional analytical tool designed to identify key support and resistance levels based on statistical Price Density. The indicator analyzes a specified historical period and detects price levels where the market spent the most time. These zones act as “magnets,” attracting price action or forming a structural base for potential reversals. Unlike traditional Volume Profile tools, Price Magnet focuses on price-time d
MA Flow No.2 See the Flow of Bulls & Bears at a Glance, and Keep the Rhythm of the Market in Your Hands Tired of staring at dozens of moving averages until your eyes blur? Unsure when to enter, or where to place your stop? MA Flow No.2 upgrades the humble moving average into a complete trend-trading system. No more scattered lines on your chart — instead, a living "river of bulls and bears". Up to 100 moving averages roll together in real time. On every single bar, you can see at a glance w
Antabod Multiplier
Rev Anthony Olusegun Aboderin
Antabod Multiplier , the ultimate trading indicator designed to simplify your decision-making process and maximize your trading potential. Built with a robust combination of moving averages and stochastic oscillators, this tool provides clear, actionable signals for both buy and sell opportunities. The Antabod Multiplier stands out with its dynamic trend detection and precision filtering, giving you real-time visual signals to catch trend reversals and optimal entry/exit points with ease. Whethe
Adaptive Trend Finder v2 Professional Automatic Trend Channel Indicator for MetaTrader 5 Adaptive Trend Finder v2 is an advanced trend analysis indicator that automatically detects and draws the strongest price channels using statistical regression analysis. Unlike traditional trendline tools, it intelligently scans multiple lookback periods to identify the most reliable short-term and long-term trends without requiring manual adjustments. Designed for traders who value precision and simplicity
Ichimoku Aiko MTF
Michael Jonah Randriamampionontsoa
Ichimoku Aiko MTF is a collection of technical indicators that show support and resistance levels, as well as momentum and trend direction. It is a multi-timeframe indicator so you don't need to change the chart timeframe when you want to see the ichimoku clouds on a higher timeframe.  eg. The chart timeframe is M15 and you want to see on the M15 timeframe chart the H1 ichimoku indicators (the ichimoku in Metatrader can't do that) that's why you need to use Ichimoku Aiko MTF.
Smart Fair Value Gap Pro
Joao Luiz Savioli Filho
Unlock the power of Smart Money Concepts (SMC) with the cleanest FVG indicator on the market. Smart FVG Pro is not just another gap detector. It is designed for professional traders who need to filter out noise and focus on high-probability reversal zones. Unlike standard indicators that clutter your chart with every minor gap, Smart FVG Pro uses advanced filtering logic (Trend + Volatility) and a unique "Smart Mitigation" system to automatically remove invalidated zones, keeping your chart clea
Daily Variation Indicator Daily Variation Indicator shows the percentage difference between the current price and the previous day close. The indicator displays the daily market movement directly on the chart, allowing traders to quickly identify whether the market is moving up or down during the current trading session. It is designed to be lightweight, minimal, and highly configurable while providing clear information about the daily price variation. Features • Displays daily percentage variat
개요 Candle Timer Countdown Pro는 현재 캔들의 마감까지 남은 시간을 부드럽고 정확하게 카운트다운으로 표시하며, 원형 진행 아크를 통해 남은 시간을 직관적으로 보여줍니다. 서버 시간 보간(Server Time Interpolation) 기술을 사용하여 틱이 없는 구간에서도 멈춤 없이 부드럽게 작동합니다. M1부터 MN까지 모든 타임프레임을 지원합니다. 스캘핑(1분 차트)부터 스윙 트레이딩(H4 이상)까지, 캔들 마감 시간을 정확히 파악하면 진입 타이밍을 개선하고 성급한 결정을 방지할 수 있습니다. 주요 특징 틱 간 멈춤 없는 정확한 카운트다운 원형 진행 표시 (Ring 또는 Filled Pie) 6가지 표시 위치 선택 가능 3가지 색상 모드 (Manual / Candle Outline / Candle Body) 마감 직전 하이라이트 기능 연결 상태 감지 (Active / Inactive / Disconnected) 새 캔들 알림 (팝업, 이메일, 푸시) 모든 타임
Trade Helper
Pavel Gotkevitch
The Trade Helper indicator is a modification of the Trade Assistant indicator (by Andriy Moraru). The Trade Helper multitimeframe indicator is a good assistant for traders, useful as a filter in most trading strategies. This indicator combines the tactics of Elder's Triple Screen in a single chart, which lies in entering a trade when the same trend is present on three adjacent timeframes. The indicator operation is based on the principle of determining the trend on the three selected timeframes
CosmiCLab FIBO
Kirils Subins
CosmiCLab SMC FIBO CosmiCLab SMC FIBO is a professional trading indicator designed for traders who use Smart Money Concepts (SMC), market structure analysis and Fibonacci retracement levels. The indicator automatically detects market swings and builds Fibonacci levels based on the latest impulse movement. It also identifies market structure changes such as BOS (Break of Structure) and CHOCH (Change of Character), helping traders understand the current market direction. CosmiCLab SMC FIBO also pr
Ichimoku Kinko Hyo is a purpose-built trend trading charting system that has been successfully used in nearly every tradable market. It is unique in many ways, but its primary strength is its use of multiple data points to give the trader a deeper, more comprehensive view into price action. This deeper view, and the fact that Ichimoku is a very visual system, enables the trader to quickly discern and filter "at a glance" the low-probability trading setups from those of higher probability. This i
Ornstein Uhlenbeck Regime Suite
Samuel De Souza Ferreira
Ornstein–Uhlenbeck Z-Score Regime Suite Discover not only the deviation, but whether the movement still has enough strength to continue. Two movements can reach the same Z-Score while representing completely different conditions. One may be ready to return to the mean, while the other may be developing persistence and lasting far longer than expected. The suite applies the Ornstein–Uhlenbeck process to the normalized series, combining three essential dimensions: distance, persistence, and revers
Will Spread
Paulo Henrique Faquineli Garcia
The Larry Wiliams' indicator named WillSpread considers the influence of the secondary Asset (Symbol) on the current Asset (trading). Indicator essence is to transform the correlation between assets in accumulated history data, providing an opportunity to detect various peculiarities and patterns in price dynamics which are invisible to the naked eye. Based on this information, traders can assume further price movement and adjust their strategy accordingly. As exposed on his Book, Larry says: "a
Silver Zebra Trading System
AL MOOSAWI ABDULLAH JAFFER BAQER
Silver Zebra Trading System - Uncover Market Momentum Unlock a powerful new way to visualize market trends and momentum with the Silver Zebra Trading System. This unique MetaTrader 5 indicator is designed to give you a clear and immediate understanding of market dynamics, helping you make more informed trading decisions. For just $30, you can add this indispensable tool to your trading arsenal. What is the Silver Zebra Trading System? The Silver Zebra Trading System is a sophisticated indicator
ICT Silver Bullet MT5
Haidar Lionel Haj Ali
5 (21)
ICT Silver Bullet If you are searching for a reliable indicator to trade the ICT Silver Bullet concept, or ICT concepts, Smart Money Concepts, or SMC, this indicator will respond to your need!  Before version 2.2, this indicator was focused only on ICT Silver Bullet, but moving forward, we will include the different elements for smart money concept trading. This indicator will help you identify the following: FVG - fair value gaps Market structure: BOS and CHOCH. It is based on swing high and l
SlopeChannelB MT5
MIKHAIL VINOGRADOV
SlopeChannelB – 경사진 가격 이동 채널을 구축하는 기술 분석 도구로, 시장 현황을 평가하고 거래 신호를 찾는 데 독특한 기회를 제공합니다. 지표의 주요 특징: 경사진 가격 이동 채널 : 이 지표는 지지와 저항 수준을 시각화하는 데 도움을 주며, 이는 추세의 반전 또는 지속 가능성을 나타낼 수 있습니다. 다양한 선 색상 및 배경 강조 : 경사진 지지 및 저항 수준은 다양한 색상으로 표시되며, 채널 자체는 배경이 추가로 강조되어 차트의 시각적 분석을 단순화합니다. 선 계산을 위한 세 가지 옵션 : 지표는 회귀 분석을 사용하여 채널 라인을 구성합니다. 세 가지 방법 중 하나를 선택할 수 있습니다: Robust (기본값) – 이상치에 강한 방법입니다. OLS (최소제곱법) . Median (중앙값 계산) . 최적의 모델 선택 : SlopeChannelB는 다섯 가지 품질 기준의 분석을 기반으로 가장 적합한 채널 라인 변형을 자동으로 선택합니다. 품질 매개변수는 차트에
Currency Power Pro
Makarii Gubaydullin
8대 주요 통화의 현재 강도 나의 #1 다기능 유틸리티:  66개 이상의 기능 포함, 이 지표 포함  |   문의 사항이 있으면 저에게 연락하세요   |    MT4 버전 이 지표는 별도의 창에 표시되며, 차트의 임의 위치로 이동할 수 있습니다. 입력 설정에서   다음 항목을 조정할 수 있습니다: 인터페이스 테마 : 다크 / 화이트; 접두사와 접미사,  브로커의 통화 쌍에 포함되어 있는 경우: (예: 심볼이 "EURUSD .pro "인 경우, " .pro "를 접미사로 설정하세요); 패널 크기 폰트 크기 나의 #1 다기능 유틸리티:  66개 이상의 기능 포함, 이 지표 포함  |   문의 사항이 있으면 저에게 연락하세요   |    MT4 버전 나의 #1 다기능 유틸리티:  66개 이상의 기능 포함, 이 지표 포함  |   문의 사항이 있으면 저에게 연락하세요   |    MT4 버전
Msm Currency Power Meter
Muhammad Sirazul Monir
MSM Currency Power Meter (MT5 Version) The MSM Currency Power Meter is a highly sophisticated, real-time multi-currency strength dashboard engineered exclusively for the MetaTrader 5 platform. This indicator eliminates market guesswork by visually decoding the true relative strength and weakness of the 8 major global currencies: EUR, GBP, AUD, NZD, USD, CAD, CHF, and JPY . Key Features & Mechanics: Real-Time Matrix Calculations: It monitors 16 core currency pairs simultaneously, analyzing cu
Lunar Phase Suite
Antonello Belgrano
Lunar Phase Suite – Moon Cycles & Moon Phases for MetaTrader 5 Lunar Phase Suite brings astronomy and astrology into MetaTrader 5 through a detailed visual panel and a dedicated sub-window. The current moon phase, illumination percentage and moon cycle age are updated every minute. All 8 moon phases are displayed with individual mini-moons, with the active phase highlighted automatically. ILLUM — Illumination curve with New Moon, Full Moon and Quarter markers plotted on the sub-window. DECL — No
이 제품의 구매자들이 또한 구매함
이 제품은 2026년 시장에 맞게 업데이트되었으며 최신 MT5 빌드에 최적화되었습니다. 가격 업데이트 안내: Smart Trend Trading System은 현재 $99 에 제공됩니다. 다음 30회 구매 후 가격은 $199 로 인상됩니다. 특별 혜택: Smart Trend Trading System 구매 후 저에게 개인 메시지를 보내시면 Smart Universal EA를 무료 로 받을 수 있으며, Smart Trend 신호를 자동 거래로 전환할 수 있습니다. Smart Trend Trading System은 리페인트 없음, 재그리기 없음, 지연 없음의 완전한 트레이딩 시스템으로, 더 깨끗한 신호, 더 나은 추세 방향, 그리고 더 체계적인 시장 거래 방식을 원하는 트레이더를 위해 제작되었습니다. Learn Smart Trend Trading System Everything you need to learn, install, and use the product is available
Trend Sniper X
Sarvarbek Abduvoxobov
4.86 (29)
Trend Sniper X 는 트레이더가 추세 방향과 잠재적 반전 지점을 명확하고 정확하게 포착할 수 있도록 도와주는 MetaTrader 5용 멀티 타임프레임 추세 추종 지표입니다. MT4용: https://www.mql5.com/en/market/product/193245 가격 정보: 현재 가격은 프로모션 할인가이며, 향후 업데이트 및 새로운 기능이 출시됨에 따라 변동될 수 있습니다. 보너스 혜택: 본 지표 전용 무료 자동매매 Assistant EA를 받으시려면 구매 후 작성자에게 메시지를 보내주시기 바랍니다. Code2Profit 채널 멀티 타임프레임 분석으로 시장을 마스터하세요! Trend Sniper X로 승률을 극대화하는 방법: 핵심 규칙 및 세션 팁 기술 사양 플랫폼 MetaTrader 5 지표 유형 멀티 타임프레임 추세 지표 운용 타임프레임 모든 차트 타임프레임 지원, 독립적으로 선택 가능한 상위 타임프레임(M1–MN1) 주요 상품 외환, 금(XAUUSD) 및 기타 C
SMC Intraday Formula
Kareem Abbas
5 (22)
먼저 솔직하게 말하겠습니다. 어떤 인디케이터도 단독으로 당신을 수익성 있게 만들어주지 않습니다. 누군가 그렇게 말한다면, 그는 당신에게 꿈을 파는 것입니다. 완벽한 매수/매도 화살표를 보여주는 모든 인디케이터는 완벽하게 보이도록 만들 수 있습니다 — 단지 올바른 과거 구간을 확대하고 승리한 거래만 캡처하면 됩니다. 우리는 그렇게 하지 않습니다.  SMC Intraday Formula는 도구입니다. 시장 구조를 읽고, 가장 높은 확률의 가격 구간을 표시하며, 현재 스마트 머니의 흐름이 어떻게 보이는지 아주 단순한 언어로 보여줍니다. 최종 결정은 여전히 당신이 합니다. 실행도 당신이 합니다. 하지만 이제는 희망이 아니라 정확성으로 거래하게 됩니다. 우리는 이 인디케이터를 지난 약 3년 동안 골드(XAUUSD) 및 주요 외환 통화쌍의 데이 트레이딩 스캘핑에 사용해 왔습니다. M1, M5, M15, M30에서 우리의 핵심 도구입니다. 이 도구는 미래를 예측하려 하지 않습니다 — 지금 형성
Neuro Poseidon MT5
Daria Rezueva
4.8 (54)
Neuro Poseidon is a new indicator by Daria Rezueva. It combines precise trading signals with adaptive TP/SL levels - creating best possible trades as a result! Message me and get  Neuro Poseidon Assistant  as a gift to automize your trading process! What makes it stand out? 1. Proven profitability on all assets and timeframes 2. Only confirmed BUY and SELL signals present on the chart 3. Adaptive TP & SL levels generated by the software for each trade 4. Easy to understand - suitable for al
Welcome to ENTRY IN THE ZONE AND SMC MULTI TIMEFRAME Entry In The Zone and SMC Multi Timeframe is a real-time market analysis tool based on Smart Money Concepts (SMC), designed to analyze market structure, price direction, and key trading zones. It supports both Single-Timeframe Analysis and Multi-Timeframe Analysis, providing a clearer view of the overall market structure across multiple timeframes, with real-time BUY / SELL signals that do not repaint. It is designed to help filter trading opp
SuperScalp Pro
Van Minh Nguyen
4.63 (32)
SuperScalp Pro - Professional Multi-Layer Confluence Scalping System SuperScalp Pro는 클래식 Supertrend에 여러 지능형 확인 필터를 추가한 고급 스캘핑 지표입니다. 더 높은 확률의 Buy/Sell 거래 기회를 식별하는 데 도움을 주며, 잘못된 신호를 크게 줄이는 데 도움을 줍니다. 명확한 Buy 및 Sell 화살표가 차트에 직접 표시되며, ATR 기반 Stop Loss 및 Take Profit 수준이 실시간으로 자동 계산됩니다. 구매 후 설정 방법 및 권장 구성에 대한 안내가 필요하시면 저에게 문의해 주세요. SuperScalp Pro Auto Trader를 사용하여 신호를 쉽게 자동화할 수 있습니다: [Auto Trader] 권장 설정 파일 다운로드: [Set File] 전체 문서는 제품 블로그에서 확인할 수 있습니다: [User Guide] 업데이트를 확인하려면 공식 채널에 참여하세요: [Official C
Unix Scalper
Issam Kassas
UNIX Scalper — Gold Scalping Indicator for MetaTrader 5 UNIX Scalper is a focused Gold scalping indicator designed primarily for XAUUSD on M1, M2, M3, M5, M10 and M15. It gives the trader a clear BUY, SELL or WAIT decision together with the complete trade plan: Entry, Stop Loss, TP1 and TP2 . The concept is simple: wait for the signal, follow the levels, move the Stop Loss to Break Even after TP1, and trade with discipline. Learn UNIX Scalper Everything you need to learn and use the product is
M1 Sniper MT5
Oleg Rodin
5 (7)
M1 SNIPER 는 사용하기 쉬운 거래 지표 시스템입니다. M1 시간대에 맞춰 설계된 화살표 지표입니다. 이 지표는 M1 시간대 스캘핑을 위한 단독 시스템으로 사용할 수 있으며, 기존 거래 시스템의 일부로도 사용할 수 있습니다. 이 거래 시스템은 M1 시간대 거래용으로 특별히 설계되었지만, 다른 시간대에도 사용할 수 있습니다. 원래는 XAUUSD와 BTCUSD 거래를 위해 이 방법을 설계했지만, 다른 시장 거래에도 유용하다는 것을 알게 되었습니다. 이 지표의 신호는 추세 방향과 반대로 거래될 수 있습니다. 저는 지표의 신호를 활용하여 양방향으로 거래할 수 있도록 돕는 특별한 거래 기법을 알려드립니다. 이 방법은 특별한 동적 지지선과 저항선 가격 영역을 활용하는 것을 기반으로 합니다. 구매하시면 M1 SNIPER 화살표 지표를 바로 다운로드하실 수 있습니다. 또한, 아래 스크린샷에 표시된 Apollo Dynamic SR 지표는 M1 SNIPER 도구를 사용하는 모든 사용자에게 무료로
ATstrong
Zaha Feiz
ATSTRONG PRO: 시장 구조 및 돌파(Breakout) 지표 돌파 감지 엔진 | 5개의 동적 TP 목표 | 실시간 대시보드 패널 | 리페인팅 없음 출시 기념 가격 현재 가격: $59 — 10개가 판매될 때마다 가격이 $10씩 인상됩니다. ATSTRONG PRO 는 MetaTrader 5 전용으로 설계된 고급 돌파 및 기관 수준의 시장 구조 지표입니다. 높은 확률의 스윙 피벗을 감지하고, 군집된 지지 및 저항 축적 영역을 식별하며, 실시간으로 구조 붕괴(BOS) 및 특성 변화(CHoCH) 신호를 제공합니다. 이 지표는 차트 위에 동적 손절매(Stop Loss)와 5개의 개별 이익 실현 수준(TP1 ~ TP5)을 자동으로 그려주며, 위험 대비 보상 투영 상자, 별점으로 매겨진 신호 품질 등급, 실시간 온차트 성과 분석 대시보드를 함께 제공합니다. 거래 주의 사항: 이 지표는 수동 거래 및 시장 분석용입니다. 캔들이 마감될 때 시각적으로 명확한 신호, 레벨, 알림을 리페인팅
Reversion King Indicator
Eugen-alexandru Zibileanu
5 (7)
새로운 왕의 등장 - 인디케이터 + 주문 관리 표시(TP1 + TP2 + TP3) + 선택형 텔레그램 시그널 전송 기능 포함 (무료) (완전한 트레이딩 및 시그널 시스템) 골드를 위한 최고의 EA: Gold Slayer 이 인디케이터는 고급 전략, 사용자 지정 가능한 주문 관리 시스템, 그리고 엔벨로프 확장을 결합한 평균 회귀(mean reversion) 시스템을 포함하고 있습니다. 또한 RSI와 같은 여러 지능형 확인 필터를 통해 높은 확률의 반전 진입 구간을 포착하여 BUY 및 SELL 시그널을 제공합니다. 단순히 거래 방법만 배우는 것이 아니라, 여러 포지션을 효과적으로 관리하고 이전에 수익 중인 오픈 포지션으로 손실 거래를 커버하는 방법까지 익힐 수 있습니다. M5 전용으로 설계 및 최적화되었으며, 유동성이 풍부해 시그널이 더 깔끔하고 신뢰도 높은 BTCUSD와 XAUUSD에서 뛰어난 성능을 발휘합니다. 이 인디케이터는 ATR 기반으로 자동 계산된 진입가, 손절가, 익절가와
Gann Made Easy MT5
Oleg Rodin
5 (9)
Gann Made Easy 는 mr.의 이론을 사용하여 최고의 거래 원칙을 기반으로 하는 전문적이고 사용하기 쉬운 Forex 거래 시스템입니다. W.D. 간. 이 표시기는 Stop Loss 및 Take Profit Levels를 포함하여 정확한 BUY 및 SELL 신호를 제공합니다. PUSH 알림을 사용하여 이동 중에도 거래할 수 있습니다. 구매 후 거래 방법 안내 및 유용한 추가 지표를 무료로 받으시려면 저에게 연락주세요! 아마도 Gann 거래 방법에 대해 이미 여러 번 들었을 것입니다. 일반적으로 Gann의 이론은 초보자 거래자뿐만 아니라 이미 거래 경험이 있는 사람들에게도 매우 복잡한 것입니다. Gann의 거래 방식은 이론적으로 적용하기 쉽지 않기 때문입니다. 나는 그 지식을 연마하고 Forex 지표에 최고의 원칙을 적용하기 위해 몇 년을 보냈습니다. 표시기는 적용하기가 매우 쉽습니다. 차트에 첨부하고 간단한 거래 권장 사항을 따르기만 하면 됩니다. 지표는 지속적으로 시장 분석
Atomic Analyst MT5
Issam Kassas
4.45 (55)
이 제품은 2026년 시장에 맞게 업데이트되었으며 최신 MT5 빌드에 최적화되었습니다. 가격 업데이트 안내: Atomic Analyst는 현재 $99 에 제공됩니다. 다음 30회 구매 후 가격은 $199 로 인상됩니다. 특별 혜택: Atomic Analyst 구매 후 저에게 개인 메시지를 보내시면 Smart Universal EA를 무료 로 받을 수 있으며, Atomic Analyst 신호를 자동 거래로 전환할 수 있습니다. Atomic Analyst는 리페인트 없음, 재그리기 없음, 지연 없음의 Price Action 거래 인디케이터로, 수동 거래, 신호 명확성, EA 자동화를 위해 설계되었습니다. User manual: settings, inputs and strategy.   &   User Manual PDF . 가격 움직임, 강도, 모멘텀, 다중 시간대 방향 및 고급 필터를 분석하여 트레이더가 노이즈를 줄이고 약한 세팅을 피하며 더 체계적인 거래 결정을 내릴 수 있도록
FiboSniper Pro
Van Minh Nguyen
5 (2)
FiboSniper Pro – Multi-Filter Fibonacci System with Auto SL/TP and Control Panel FiboSniper Pro는 동적 Fibonacci Envelopes와 여러 확인 필터를 결합하여 선별된 Buy 및 Sell 신호를 생성하는 기술적 지표입니다. Fibonacci 레벨은 Moving Average와 ATR을 기반으로 계산된 후 ADX, EMA, RSI, ATR, Volume, Time 및 Candle 구조를 통해 필터링됩니다. 이 지표는 ATR 기반의 자동 Stop Loss 및 Take Profit 레벨을 차트에 직접 표시하며, 빠른 설정 조정을 위한 인터랙티브 Control Panel을 제공합니다. 구매 후 권장 설정 파일과 자세한 사용 방법을 받으려면 저에게 문의해 주세요. Auto Trader X를 사용하여 FiboSniper Pro 신호를 자동화할 수 있습니다: [Auto Trader X] User Guide 및 Se
Entry Points Pro for MT5
Yury Orlov
4.51 (150)
전설이 돌아왔습니다: Entry Points Pro 10. MQL5 마켓 Top-3 자리를 3년간 지켜온 전설적인 지표의 재출시입니다. 수백 개의 호평 리뷰(두 버전 합산 589개), 매일 이 지표로 거래하는 수천 명의 트레이더, 31,000회 이상의 데모 다운로드   MT4+MT5 . 지난 5년간 여러분이 남긴 리뷰를 하나도 빠짐없이 읽었고, 약속 대신 그 답을 버전 10에 담았습니다. 1999년부터 시장에서 활동하며 정직함과 자신의 평판, 그리고 고객을 소중히 여기는 개발자가 만들었습니다. Entry Points Pro의 진입 시그널은 절대 리페인팅되지 않습니다. 그리고 이번에는 개발자의 말뿐이 아니라 검증 가능한 사실입니다: 확정 시그널은 캔들 종가에서만 표시되며, 자동화 테스트에서 리페인팅 0건 이 확인되었습니다(EURUSD, XAUUSD, BTCUSD에서 2,486,568회의 불변조건 검사 — 위반 0건). 검증 방법은 공개되어 있으니 전략 테스터에서 직접 재현해 보실 수
BlueDigitsFx 공식 에코시스템 접근 공식 BlueDigitsFx 에코시스템을 통해 인프라 업데이트, 워크플로우 리소스, 제품 출시 및 에코시스템 접근 권한을 받으세요. Telegram 에코시스템 웹사이트 BlueDigitsFx Precision Order Flow MT5 — MetaTrader 5 완전한 오더플로우 분석 스위트 밸류 에어리어, Point of Control, 경매 컨텍스트, 구조화된 의사결정 지원을 결합한 진지한 MT5 트레이더를 위한 전문적인 세션 기반 시장 구조 프레임워크. 가치가 위치한 곳을 파악하세요 VAH, POC, VAL을 자동으로 모니터링하세요 London 및 New York 세션 구조를 이해하세요 구조화된 시장 컨텍스트로 의사결정 피로를 줄이세요 MetaTrader 5 트레이더를 위해 특별히 설계되었습니다 개발자의 메시지 저는 MetaTrader 5 내에서 세션 구조를 더 명확하게 읽고 싶어서 Precision Order Flow를 개발했습
SR Liquidity MT5
Oleg Rodin
5 (2)
SR Liquidity 는 시장 유동성이 집중되고 가격이 가장 강력하게 반응하는 숨겨진 구간을 포착하도록 설계된 트레이딩 지표입니다. 이러한 특수 유동성 구간은 강력한 지지 및 저항선 역할을 하며, 시장 반전 가능성이 가장 높은 지점을 명확하게 보여주는 지도가 되어 줍니다. SR Liquidity는 일반적인 지지 및 저항선을 단순히 그리는 대신, 실제 가격 움직임을 분석하여 매수 및 매도 압력이 집중되는 구간을 포착합니다. 이러한 구간은 실질적인 시장의 흐름을 주도하는 유동성 풀(liquidity pools)에 해당합니다. 이 지표는 해당 구간을 차트에 직접 시각화하여, 가격 반응이 실제로 나타나기 전에 이를 미리 예측할 수 있도록 돕습니다. 즉, 가격 추세가 전환될 가능성을 사전에 파악하게 해주는 것입니다. 결과적으로 이 지표는 가공되지 않은 가격 움직임(price action)을 시장의 핵심 가격대, 다시 말해 추세 전환점이 될 수 있는 지점들을 보여주는 명확하고 실용적인 로드맵
Divergence Bomber
Ihor Otkydach
4.89 (94)
이 지표를 구매하신 분께는 다음과 같은 혜택이 무료로 제공됩니다: 각 거래를 자동으로 관리하고, 손절/익절 수준을 설정하며, 전략 규칙에 따라 거래를 종료하는 전용 도우미 툴 "Bomber Utility" 다양한 자산에 맞게 지표를 설정할 수 있는 셋업 파일(Set Files) "최소 위험", "균형 잡힌 위험", "관망 전략" 모드로 설정 가능한 Bomber Utility의 셋업 파일 이 전략을 빠르게 설치, 설정, 시작할 수 있도록 돕는 단계별 영상 매뉴얼 주의: 위의 모든 보너스를 받기 위해서는 MQL5 개인 메시지 시스템을 통해 판매자에게 연락해 주세요. 독창적인 커스텀 지표인 “Divergence Bomber(다이버전스 봄버)”를 소개합니다. 이 지표는 MACD 다이버전스(괴리) 전략을 기반으로 한 올인원(All-in-One) 거래 시스템입니다. 이 기술 지표의 주요 목적은 가격과 MACD 지표 간의 다이버전스를 감지하고, **향후 가격이 어느 방향으로 움직일지를 알려주
Superhero
Ihor Otkydach
5 (3)
SUPERHERO 지표는 “올인원” 방식으로 설계된 다중 통화 거래 시스템입니다. 이 지표는 시장을 독자적으로 분석하여 포지션을 개설하고 청산할 시점에 대한 신호를 제공합니다. 손절매(Stop Loss) 및 익절(Take Profit) 주문을 활용하며, 위험 대비 수익 비율(R:R)은 1:1입니다. 이 시스템은 스마트폰으로 푸시 알림을 전송할 수 있으므로, PC에 묶여 있을 필요 없이 “이동 중에도” 매매를 할 수 있습니다. 이는 자체 거래 전문 회사에 안성맞춤입니다. 모든 고객님께 드리는 특별 혜택: 이 지표를 구매하시는 모든 분께는 제가 특별히 준비한 유틸리티를 선물로 드릴 예정이며, 이 유틸리티는 다음과 같은 기능을 제공합니다: 손절매 및 익절 주문을 자동으로 설정합니다 가격이 목표 수준에 도달하면 자동으로 포지션을 청산합니다 미결제 주문 거래를 지원합니다 평균화 거래 모드를 지원합니다 이 훌륭하고 매우 편리한 유틸리티를 선물로 받고 싶으시다면, SUPERHERO 지표를 구매하
UZFX {SSS} 스캘핑 스마트 시그널 v5.0 MT5는 급변하는 시장에서 정확한 실시간 시그널을 필요로 하는 스캘퍼, 데이 트레이더, 스윙 트레이더를 위해 설계된 리페인팅이 없는 고성능 트레이딩 지표입니다. (UZFX-LABS)에서 개발한 이 지표는 가격 움직임 분석, 추세 확인 및 스마트 필터링을 결합하여 모든 통화 쌍과 시간대에서 높은 확률의 매수 및 매도 신호, 경고 신호, 추세 지속 기회를 생성합니다. 거래에 대한 망설임을 멈추고, 명확성, 정밀성, 그리고 규율 있는 시장 실행을 원하는 트레이더를 위해 설계된 체계적인 신호 시스템을 따르기 시작하세요. 제 말을 믿으세요. 이 지표는 MQL5에서 구할 수 있는 최고의 지표 중 하나입니다. 그러니 절대 놓치지 마세요!! “현명한 트레이더를 위한 스마트 신호” 지금 최신 버전 5.0이 출시되었으며, 사전 공지 없이 가격이 최대 $499.99까지 인상될 수 있으니 기회를 놓치기 전에 서둘러 구매하세요!! 최종 구매 전! 무료 체
Crystal Heikin Ashi Signals
Muhammad Jawad Shabir
5 (4)
Crystal Heikin Ashi Signals - Professional Trend & Signal Detection Indicator Advanced Heikin Ashi Visualization with Intelligent Signal System for Manual & Automated Trading Final Price: $149 ---------> Price goes up $10 after every 10 sales . Limited slots available — act fast . Overview Crystal Heikin Ashi Signals is a professional-grade MetaTrader 5 indicator that combines pure Heikin Ashi candle visualization with an advanced momentum-shift detection system. Designed for both manual traders
Power Candles MT5
Daniel Stein
4.73 (11)
Power Candles V3 - 자체 최적화 강도 지표 파워 캔들 V3는 적용된 모든 차트에서 통화 및 상품의 강세를 실행 가능한 거래 계획으로 전환합니다. 단순히 캔들에 색상을 입히는 대신, 백그라운드에서 실시간 자동 최적화를 수행하여 현재 보고 있는 종목에 대한 최적의 손절매, 익절 및 신호 임계값을 제공합니다. 한 번의 클릭으로 실시간 거래에 적용할 수 있으며, 진입점, 손절매 및 익절 선이 정확한 가격에 맞춰 차트에 표시되고, 방향과 함께 알림이 발령됩니다. 이 도구는 Stein Investments 에코시스템의 일부입니다. 18개 이상의 도구와 함께 당신의 1대1 AI 트레이딩 멘토 Max.  항상 대기 중, 모든 인디케이터를 깊이 있게 이해, 무언가를 차근차근 생각해보고 싶은 순간에 도움을 줍니다.  https://stein.investments 에서 만나보세요 매 종가 바마다 3,000회 이상의 트레이딩 시뮬레이션. 9가지 강도 상태. 2가지 전략을 병렬로 테스트.
Advanced Supply Demand MT5
Bernhard Schweigert
4.53 (15)
현재 33% 할인! 초보자나 전문 트레이더를 위한 최고의 솔루션! 이 보조지표는 우리가 다수의 독창적 기능과 새로운 공식을 통합한 독특하고 고품질이며 저렴한 거래 도구입니다. 이 업데이트를 통해 이중 시간대를 표시할 수 있습니다. 더 높은 TF를 표시할 수 있을 뿐만 아니라 차트 TF와 더 높은 TF 모두를 표시할 수 있습니다: 중첩 영역 표시. 모든 Supply Demand 트레이더들이 좋아할 것입니다. :) 중요한 정보 공개 Advanced Supply Demand의 잠재력을 극대화하려면 다음을 방문하십시오. https://www.mql5.com/ko/blogs/post/720245   진입 또는 목표의 명확한 트리거 포인트를 정확히 찾아냄으로 해서 거래가 어떻게 개선될지 상상해 보십시오. 새로운 알고리즘을 기반으로 매수자와 매도자 간의 잠재적인 불균형을 훨씬 더 쉽게 분간할 수 있습니다. 왜냐하면 가장 강한 공급영역과 가장 강한 수요 영역과 과거에 어떻게 진행 되었는지를(이전
통화 강도 마법사는 성공적인 거래를 위한 올인원 솔루션을 제공하는 매우 강력한 지표입니다. 표시기는 여러 시간 프레임의 모든 통화 데이터를 사용하여 이 또는 해당 외환 쌍의 힘을 계산합니다. 이 데이터는 특정 통화의 힘을 확인하는 데 사용할 수 있는 사용하기 쉬운 통화 지수 및 통화 전력선의 형태로 표시됩니다. 필요한 것은 거래하려는 차트에 표시기를 부착하는 것뿐입니다. 표시기는 거래하는 통화의 실제 강세를 보여줍니다. 지표는 또한 추세와 거래할 때 유리하게 사용할 수 있는 구매 및 판매 거래량 압력의 극한값을 보여줍니다. 지표는 또한 피보나치에 기반한 가능한 대상을 보여줍니다. 표시기는 PUSH 알림을 포함한 모든 유형의 알림을 제공합니다. 구매 후 연락주세요. 나는 당신과 거래 팁을 공유하고 당신에게 무료로 훌륭한 보너스 지표를 줄 것입니다! 나는 당신에게 행복하고 유익한 거래를 기원합니다!
Crystal Quantum Pro
Muhammad Jawad Shabir
5 (3)
CRYSTAL QUANTUM PRO Institutional Signal & Trade Intelligence for MetaTrader 5 Final Price: 199 USD ----> Price goes up 10 USD after every 10 sales. Limited launch slots available, act fast. Most indicators give you an arrow and leave you alone. A naked arrow is a gamble. Winning consistently requires CONFLUENCE , a clear STOP and TARGET , and honest PROOF that the system works. Crystal Quantum Pro delivers all three in one clean, no-repaint package. Crystal Quantum Pro is a complete decision sy
Trend Catcher ind mt5
Ramil Minniakhmetov
5 (18)
트렌드 캐처 인디케이터 트렌드 캐처 인디케이터는 개발자가 자체 개발한 맞춤형 적응형 트렌드 분석 지표들을 조합하여 시장 가격 움직임을 분석합니다. 단기적인 노이즈를 제거하고 근본적인 모멘텀 강도, 변동성 확대, 가격 구조 움직임에 집중하여 진정한 시장 방향을 파악합니다. 또한 이동 평균, RSI, 변동성 필터와 같은 맞춤형 지표들을 활용하여 가격을 평활화하고 트렌드를 필터링합니다. 실제 운영 모니터링 및 기타 제품은 다음 링크에서 확인하실 수 있습니다:   https://www.mql5.com/en/users/mechanic/seller 텔레그램에서는 EA나 설정 파일을 판매하지 않습니다. 사기이니 주의하세요. 모든 설정 파일은 블로그에서 무료로 제공됩니다. 중요! 구매 후 즉시 연락 주시면 사용 방법 및 보너스를 드립니다!
CRT Candle Range Theory HTF MT5.   Ultimate CRT Indicator: Advanced ICT Concepts and Malaysian SnR Trading System Master the Market Maker's Footprints with the Most Advanced Candle Range Theory Indicator Unlock the true power of  Smart Money Concepts (SMC)  and trade precisely like the institutions with the  Ultimate CRT Indicator . Built exclusively for serious traders, this indicator automates the highly effective  Candle Range Theory (CRT) , a core pillar of  ICT Concepts (Inner Circle Trader
Gold Stuff mt5
Vasiliy Strukov
4.88 (193)
Gold Stuff mt5는 금을 위해 특별히 설계된 추세 지표이며 모든 금융 상품에서도 사용할 수 있습니다. 표시기가 다시 그려지지 않고 지연되지 않습니다. 권장 기간 H1. 설정 및 개인 보너스를 받으려면 구매 후 즉시 저에게 연락하십시오!     강력한 지원 및 트렌드 스캐너 표시기의 무료 사본을 받으실 수 있습니다. 메시지를 보내주세요. 나!   설정 화살표 그리기 - 켜기 끄기. 차트에 화살표 그리기. 경고 - 가청 경고를 끕니다. 이메일 알림 - 켜기 끄기. 이메일 알림. Puch-notification - 켜기 끄기. 푸시 알림. 다음으로 색 영역을 조정합니다. Gold Stuff mt5는 금을 위해 특별히 설계된 추세 지표이며 모든 금융 상품에서도 사용할 수 있습니다. 표시기가 다시 그려지지 않고 지연되지 않습니다. 권장 기간 H1. 설정 및 개인 보너스를 받으려면 구매 후 즉시 저에게 연락하십시오!   설정 화살표 그리기 - 켜기 끄기. 차트에 화살표 그
M1 Quantum MT5
Hamed Dehgani
4.27 (11)
M1 Quantum을 이용한 실시간 트레이딩 신호 : 신호   ( Quantum Trade Assistant 에 의해 거래가 자동으로 실행되며, 이 제품에 무료 로 포함되어 있습니다.) 최신 소식: 버전 1.64가 출시되었습니다. 이제 모든 거래에는 해당 지지/저항 구간 뒤에 Stop Loss가 설정됩니다. 또한 이번 버전에서는 EA의 성능을 향상시키기 위해 Smart Close 기능이 개선되었습니다. 8월 9일부터 라이브 신호는 버전 1.64로 운영되고 있습니다. 가격 계획: 현재 가격: $169 (얼리 어답터 혜택) 다음 예정 가격: $189 예정 소매 가격: $299 개발자 안내: 구매 후 저에게 연락하시면 최신 권장 설정 파일(Set File) , 사용 팁, 그리고 다른 M1 Quantum 사용자들과 소통할 수 있는 VIP 지원 그룹 초대장을 받으실 수 있습니다. 자주 묻는 질문 - 설정 파일 - 설치 가이드 M1 Quantum 은 M1 전용 전문 트레이딩 시스템으로, 손
Smart Market Structure Toolkit
Garry James Goodchild
5 (1)
Smart Market Structure Pro by G-Labs — ICT and Smart Money Concepts toolkit with built-in multi-symbol scanner for MetaTrader 5. Break of structure, change of character, order blocks, fair value gaps, liquidity sweeps, premium and discount zones, ICT sessions, confluence scoring, AI trade ideas, and a traffic-light scanner across up to 30 pairs and four timeframes from one chart. Map SMC and ICT on the active chart while the built-in scanner monitors your full watchlist. Each cell shows BUY, S
Trend Forecaster
Alexey Minkov
5 (8)
Trend Forecaster is a MetaTrader 5 indicator that combines breakout signals, possible reversal area analysis, market range data and a visual statistics panel in one chart workspace. It shows Buy and Sell signals, tracks Average Range and Current Range, and can automatically adjust Sensitivity for the current symbol and timeframe. Manual Sensitivity control is also available. The indicator can be used on Forex pairs, metals, stocks, indices and cryptocurrencies. Different timeframes are supported
필터:
리뷰 없음
리뷰 답변