Fixed Range Volume Profile Pro
- Indicadores
-
Jeffrey Quiatchon
 A developer and side-hustle trader :)
 - Versão: 2.0
- Ativações: 5
Fixed Range Volume Profile Pro
Price tells you when. Volume tells you where. MetaTrader 5 only shows you one of them.
Every chart in your terminal plots time on one axis and price on the other. Neither axis answers the question that actually matters at a level: how much business was done here? A support line drawn across three wicks and a support shelf where forty percent of the week's volume changed hands look identical on a candlestick chart. They behave nothing alike.
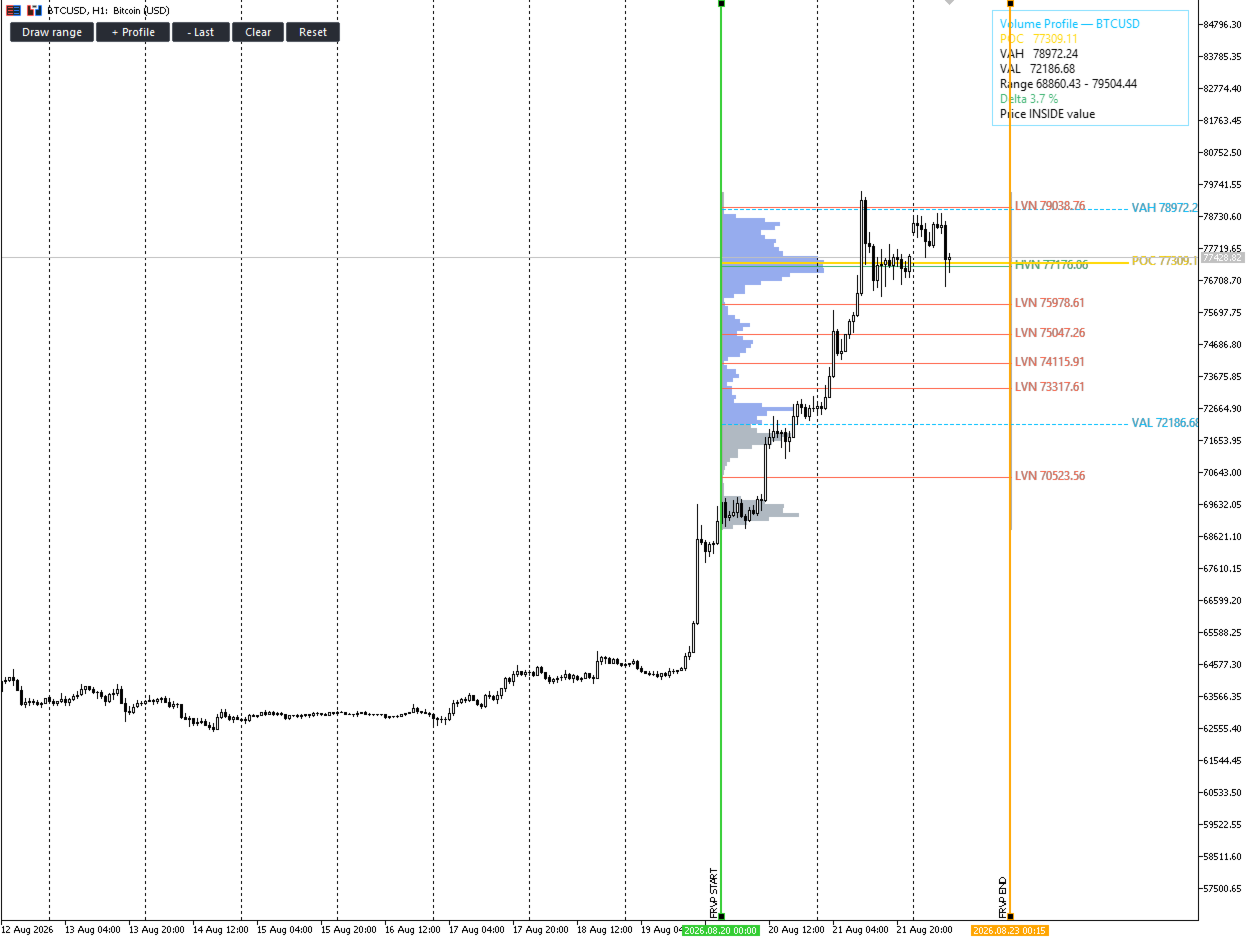
FRVP Pro adds the missing axis. Mark any range — by hand, by trading session, or automatically — and see exactly where the market accepted price and where it refused to trade.
FOUR WAYS TO DEFINE A RANGE
- Manual — drop two anchors on the chart and drag them. The profile recalculates as you move. Run up to 12 independent ranges at once to build a composite view.
- Click-to-draw — press one button, click twice, done. A live preview follows your cursor so you can see the range before you commit it.
- Draggable Line — prefer a single object with eight grab handles? Switch the selector type. Drag an edge to resize, drag the body to slide the whole window through history. Optionally the box height filters the data too, so you can isolate one consolidation shelf and profile only what traded inside it.
- Automatic — daily, weekly, monthly, rolling last-N-bars, or a profile that follows your visible chart as you scroll and zoom.
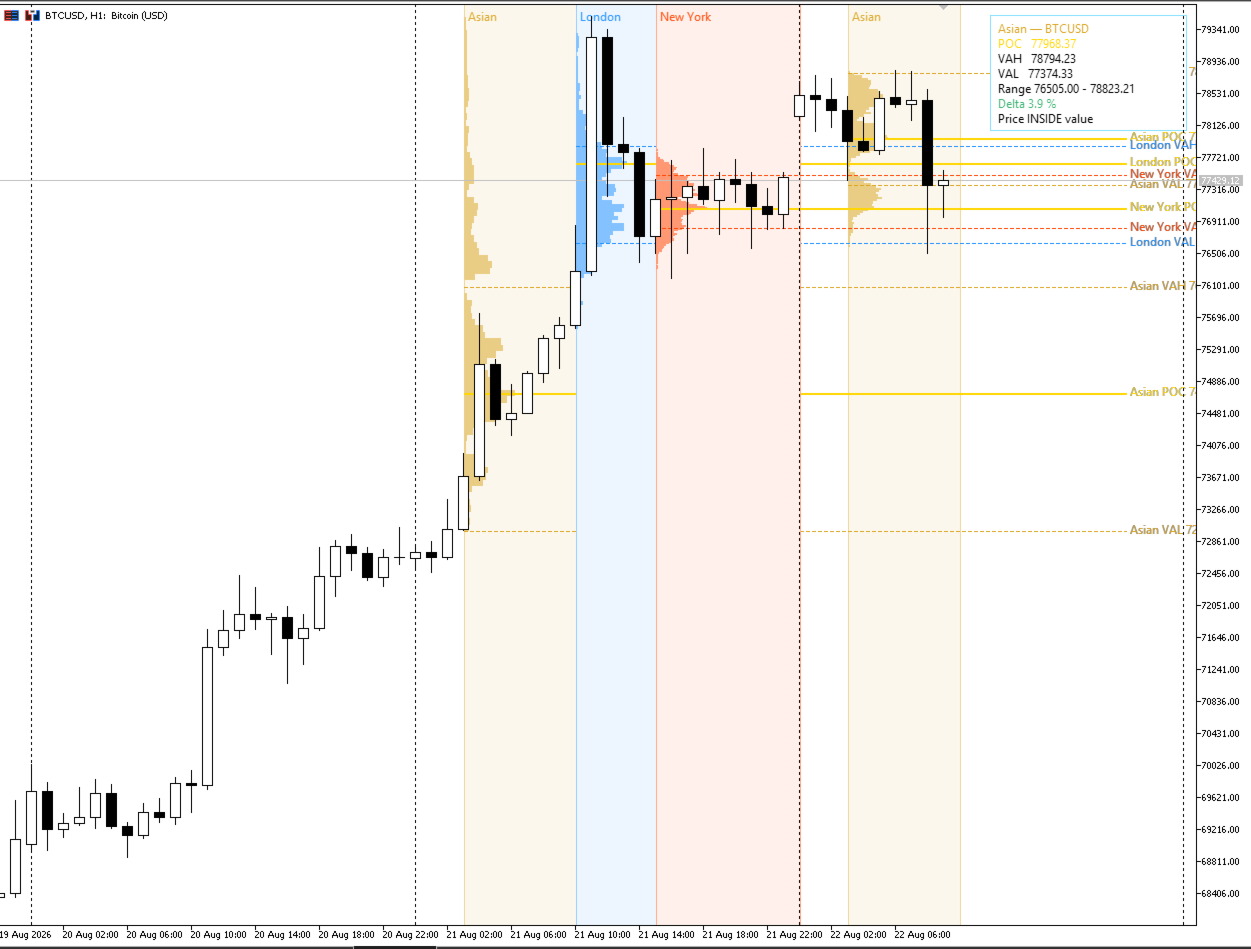
TRADING SESSION PROFILES — ASIAN, LONDON, NEW YORK
See how each session built its own value area, and watch what the next one does to it. The Asian range that London sweeps. The New York POC that Tokyo never revisits. This is the structure intraday traders actually trade, and almost nothing in MetaTrader shows it.
- Asian / Tokyo, London, New York, Sydney, and the London–New York overlap
- Each session in its own colour, with a tinted background band and a label
- Up to 20 days of history, all sessions side by side
- Fully editable open and close times
And it handles the clocks properly. This is where most session tools quietly fail. Your broker's server clock is not GMT, and MetaTrader gives no API to ask what it is. FRVP Pro derives the offset from the live server and GMT clocks on every pass, so a broker running GMT+2 in winter and GMT+3 in summer is tracked automatically — nothing to change in March, nothing to change in October.
It also knows that the session conventions themselves move. London runs on BST and New York on EDT for most of the year, shifting both windows an hour against GMT. FRVP Pro computes the real transition dates — last Sunday of March and October for Europe, second Sunday of March and first Sunday of November for the United States — and shifts each session independently. Tokyo, which observes no daylight saving, stays fixed.
If you would rather not think in GMT at all, switch the time basis to broker server time or local PC time and type the hours you see on your own clock.
WHAT GETS DRAWN
- POC — Point of Control, the single most traded price in the range
- Value Area High / Low — configurable percentage, default 70%
- HVN — high volume nodes, the shelves price stalls and rotates around
- LVN — low volume nodes, the thin pockets price travels through fast
- Naked POC — a POC from an earlier session that price has never returned to test. Untested business is unfinished business.
- Developing POC — the control price evolving through the range
- Range High / Low
ORDER FLOW, NOT JUST VOLUME
Four histogram modes, switchable instantly:
- Total volume — the classic profile
- Buy / Sell split — every row divided into aggressive buying against aggressive selling. Absorption becomes obvious.
- Delta coloured — see at a glance which side owns each price shelf
- TPO / Market Profile — classic time-at-price distribution for traders who work the Steidlmayer way
AN ENGINE THAT DOES NOT CUT CORNERS
- Real tick data when available, automatic fallback to bars
- Automatic timeframe selection — a three-month range is resolved as carefully as a three-hour one, without you touching a setting
- Real volume or tick volume, auto-detected per symbol
- Three volume-spreading models: uniform, body-weighted, and close-only
- Hard safety caps on bars and ticks, so no range you draw can freeze your terminal
AN ENGINE THAT DOES NOT CUT CORNERS
- Real tick data when available, automatic fallback to bars
- Automatic timeframe selection — a three-month range is resolved as carefully as a three-hour one, without you touching a setting
- Real volume or tick volume, auto-detected per symbol
- Three volume-spreading models: uniform, body-weighted, and close-only
- Hard safety caps on bars and ticks, so no range you draw can freeze your terminal
BUILT FOR CHARTS YOU ACTUALLY USE
The profile is rendered onto a single hardware bitmap — not thousands of chart objects. Twelve profiles at 80 rows each is one object on your chart instead of 960. Panning stays smooth, zooming stays smooth, and recomputation is cached and skipped entirely when nothing has changed.
If you have ever removed a volume profile indicator because it made your terminal crawl, this is the difference.
ALERTS
Popup, push notification to your phone, and email — on POC touch, Value Area High or Low break, and LVN touch. With a cooldown, so a retest does not become forty notifications.
COMPATIBILITY
MetaTrader 5, every symbol — Forex, metals, indices, crypto, shares and futures. Works on brokers with real volume and on brokers without. Fully functional in the Strategy Tester in visual mode, so download the free demo and run it on your own history and your own broker before you spend anything.
KEYWORDS / TAGS
volume profile, fixed range volume profile, FRVP, market profile, TPO, POC, point of control, value area, VAH, VAL, HVN, LVN, naked POC, virgin POC, order flow, delta, buy sell volume, session profile, asian session, london session, new york session, volume analysis, auction market theory, supply demand, institutional levels