
Hot Zone
- Indicadores
- Versão: 1.0

XBK System Hot Zone — Live Buyer vs. Seller Power Indicator for MT5
Stop reading a quiet price chart. Start watching the fight.
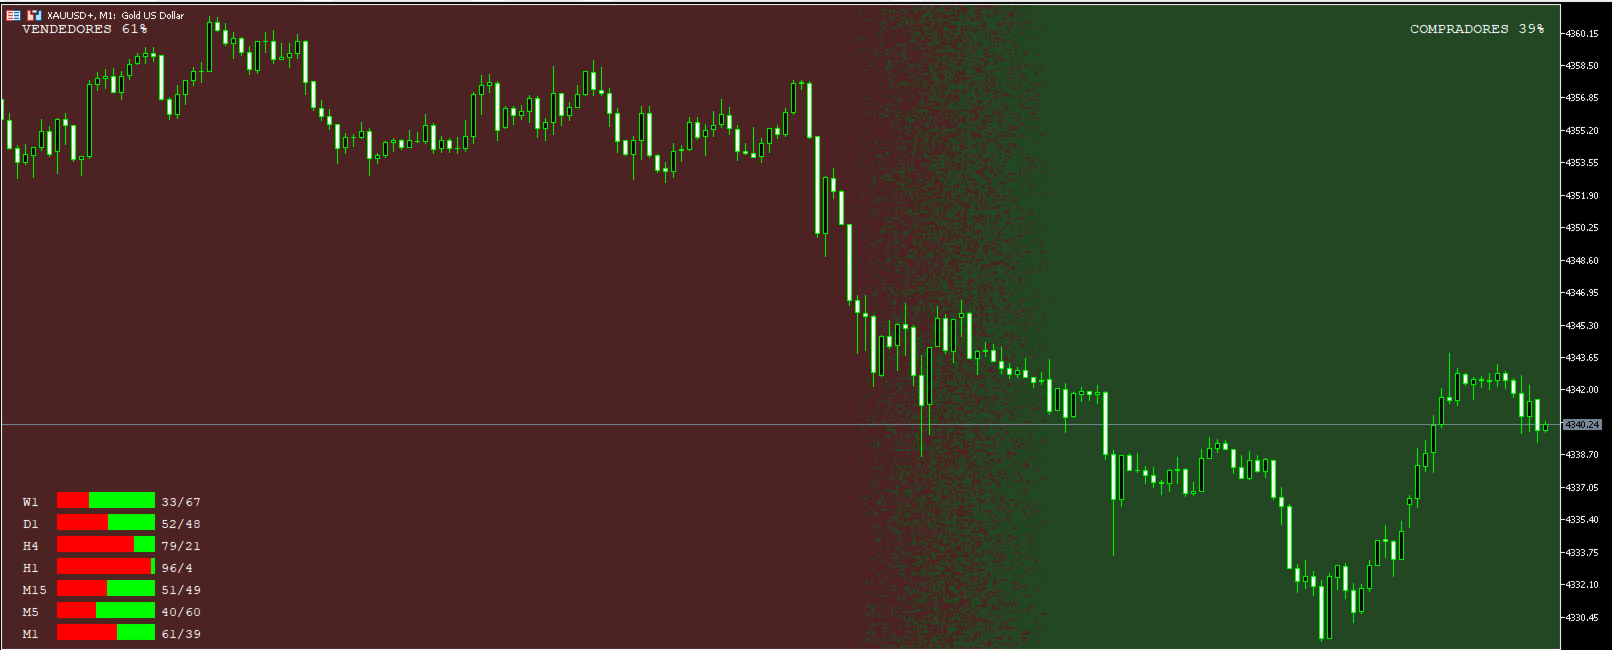
XBK War Zone turns your MetaTrader 5 chart into a live battlefield between buyers and sellers. The entire chart background splits into two semi-transparent color zones — one for sellers, one for buyers — and the dividing frontier moves in real time as the balance of power shifts. No grid, no native volume histogram, no clutter: just price action and the fight behind it.
Key Features
- Full-chart power visualization — a live, semi-transparent color wash across the whole chart shows who's in control, refreshed on every tick, on bar close, or on a timer — your choice.
- Three selectable frontier styles — pick the look that fits you:
- Line — a clean, classic boundary
- Pixels — a shifting band of animated blocks, like static at the front line
- Spikes — an animated zigzag pattern marching from side to side
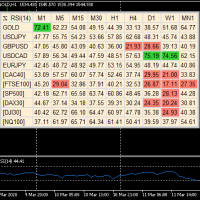
- Multi-timeframe panel — the same buyer/seller ratio across several timeframes at a glance (M1, M5, M15, H1, H4, D1 by default, fully customizable list), so you always know whether the short-term picture agrees with the bigger one.
- Vertical or horizontal split — orient the war zone however you read a chart best.
- Fully customizable look — colors, opacity, fonts, and panel position/size are all exposed as inputs, independently for the main zone and the panel.
- Clean canvas — automatically hides the native grid and tick-volume histogram, and restores your original chart settings if you remove the indicator.
- Lightweight and safe — a pure visual indicator. No orders are placed, no alerts are sent. Run it alongside any EA or manual strategy without interference.
- Works on any symbol and any timeframe.
How It Works
XBK Hot Zone estimates buyer and seller pressure from recent price action: bars that close higher add weight to the buyer side, bars that close lower add weight to the seller side, summed over a configurable lookback window. It uses tick volume by default, with an option to switch to your broker's real volume where available. That ratio drives everything you see — the size of each color zone, the position of the frontier, and every row of the multi-timeframe panel.
Recommended For
Discretionary and scalping traders who want an at-a-glance read on short-term momentum shifts — on gold (XAUUSD) or any other instrument. Pairs naturally with structure-, trend-, or order-flow-style strategies as a fast visual confirmation layer.
A Note on the Numbers
The buyer/seller ratio is a price-action-derived estimate, not literal exchange order flow — most retail forex/CFD brokers don't provide that data. Use it as a visual sentiment aid alongside your own analysis, not as a standalone trading signal. This indicator does not place trades, generate alerts, or guarantee any outcome. Past performance and visual patterns are not indicative of future results.


































O usuário não deixou nenhum comentário para sua avaliação