
Hot Zone
- 지표
- 버전: 1.0

XBK System Hot Zone — Live Buyer vs. Seller Power Indicator for MT5
Stop reading a quiet price chart. Start watching the fight.
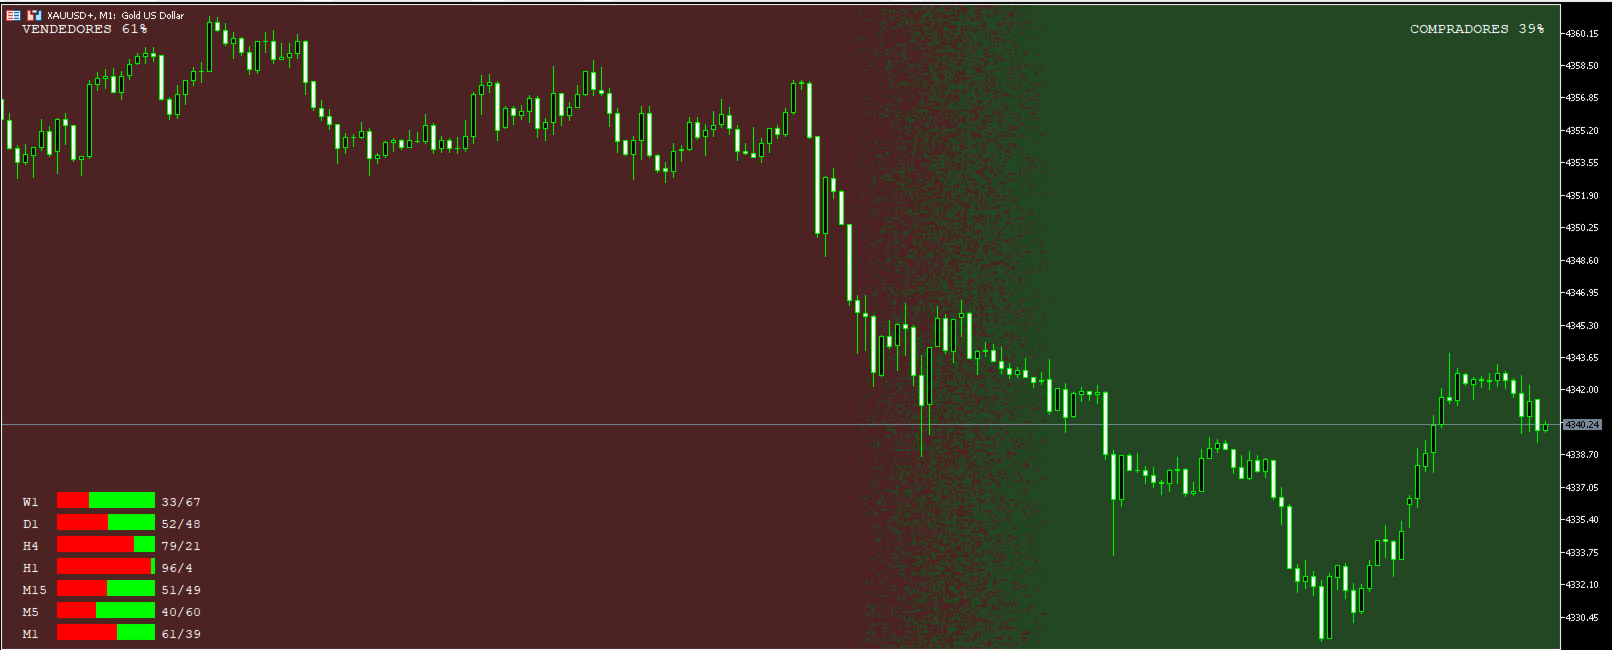
XBK War Zone turns your MetaTrader 5 chart into a live battlefield between buyers and sellers. The entire chart background splits into two semi-transparent color zones — one for sellers, one for buyers — and the dividing frontier moves in real time as the balance of power shifts. No grid, no native volume histogram, no clutter: just price action and the fight behind it.
Key Features
- Full-chart power visualization — a live, semi-transparent color wash across the whole chart shows who's in control, refreshed on every tick, on bar close, or on a timer — your choice.
- Three selectable frontier styles — pick the look that fits you:
- Line — a clean, classic boundary
- Pixels — a shifting band of animated blocks, like static at the front line
- Spikes — an animated zigzag pattern marching from side to side
- Multi-timeframe panel — the same buyer/seller ratio across several timeframes at a glance (M1, M5, M15, H1, H4, D1 by default, fully customizable list), so you always know whether the short-term picture agrees with the bigger one.
- Vertical or horizontal split — orient the war zone however you read a chart best.
- Fully customizable look — colors, opacity, fonts, and panel position/size are all exposed as inputs, independently for the main zone and the panel.
- Clean canvas — automatically hides the native grid and tick-volume histogram, and restores your original chart settings if you remove the indicator.
- Lightweight and safe — a pure visual indicator. No orders are placed, no alerts are sent. Run it alongside any EA or manual strategy without interference.
- Works on any symbol and any timeframe.
How It Works
XBK Hot Zone estimates buyer and seller pressure from recent price action: bars that close higher add weight to the buyer side, bars that close lower add weight to the seller side, summed over a configurable lookback window. It uses tick volume by default, with an option to switch to your broker's real volume where available. That ratio drives everything you see — the size of each color zone, the position of the frontier, and every row of the multi-timeframe panel.
Recommended For
Discretionary and scalping traders who want an at-a-glance read on short-term momentum shifts — on gold (XAUUSD) or any other instrument. Pairs naturally with structure-, trend-, or order-flow-style strategies as a fast visual confirmation layer.
A Note on the Numbers
The buyer/seller ratio is a price-action-derived estimate, not literal exchange order flow — most retail forex/CFD brokers don't provide that data. Use it as a visual sentiment aid alongside your own analysis, not as a standalone trading signal. This indicator does not place trades, generate alerts, or guarantee any outcome. Past performance and visual patterns are not indicative of future results.
































사용자가 평가에 대한 코멘트를 남기지 않았습니다