Stochastic ratio

Stochastic Ratio SMA

Stochastic Ratio SMA is a custom technical analysis indicator for MetaTrader 5 that combines trend analysis with a modified momentum oscillator. Unlike the standard Stochastic Oscillator, which uses the High-Low price range as its input, this indicator applies the stochastic calculation to a custom data series derived from the ratio between the Close price and the 20-period Simple Moving Average (SMA 20).

The Close/SMA ratio is normalized and smoothed using the Stochastic Oscillator algorithm, producing an oscillator that ranges from 0 to 100. This approach measures how far the current closing price deviates from its moving average while presenting the information in a familiar stochastic format.

Key Features

  • Custom Calculation Logic

    Calculates the ratio of the closing price to the 20-period Simple Moving Average (SMA 20), then transforms the result into a normalized oscillator with values ranging from 0 to 100.

  • Minimalist Visualization & Crossover Signals

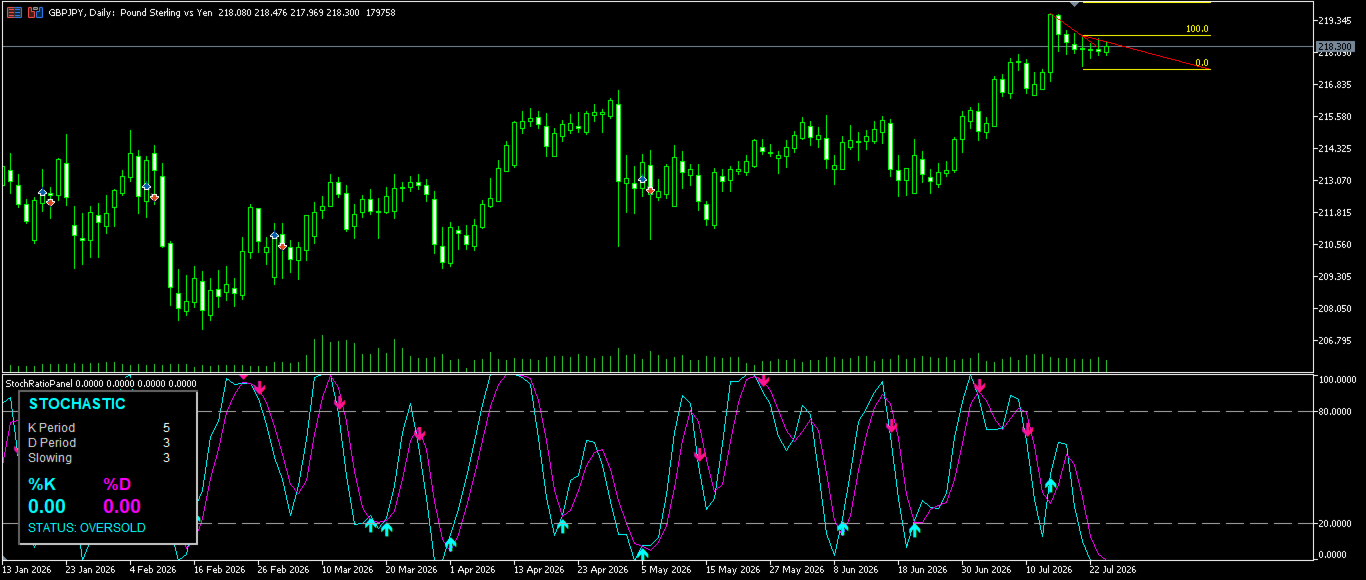
    Displays thin %K (Aqua) and %D (Magenta) lines for a clean and unobtrusive appearance. The indicator automatically plots small signal arrows whenever a bullish crossover occurs in the Oversold zone (≤20) or a bearish crossover occurs in the Overbought zone (≥80).

  • Modern Dashboard

    Includes a clean, dark-themed dashboard that displays the current indicator settings and real-time values, including the market status (NEUTRAL, OVERBOUGHT, or OVERSOLD), %K, and %D. The compact layout allows essential information to remain visible without obstructing the chart.

  • Configurable Parameters

    All calculation parameters, including the K Period, D Period, Slowing, SMA Period, and signal levels, can be configured through the standard MetaTrader 5 input settings to suit different trading styles.

Notes

This indicator is not a standard implementation of the Stochastic Oscillator. Instead of using the traditional High-Low price range, it applies the stochastic calculation to a custom input series derived from the Close/SMA (20) ratio.

By combining a modified mathematical approach with a modern visual design, the indicator presents momentum information in a clear, responsive, and easy-to-read format for technical analysis.

Mais do autor
SnR Engine
Muhammad Tamimul Huda
SnR Engine Basically, this is a Support and Resistance indicator like most others that use fractals to determine support and resistance levels. The difference is that this indicator determines whether a support or resistance level has been broken based on ATR. Levels that have been broken will become “dead levels” and will be shown with dashed lines. Levels that have many rejections and fail to be broken will have increasingly thicker lines. For effective use, you need to understand the charac
FREE
Swing Bollinger Band
Muhammad Tamimul Huda
Bollinger Band Swing Detector This indicator detects market swings based on the relative position of the price to the upper, lower, and middle bands of the Bollinger Bands indicator. It allows traders to visualize market structure based on volatility rather than fixed point distances. The indicator includes a dashboard panel that displays multi-timeframe trend information and active support and resistance levels. Swing Detection Unlike standard ZigZag indicators that use fixed points or percenta
FREE
Alpha Prime Gold
Muhammad Tamimul Huda
Alpha Prime Gold: Quantitative XAUUSD System Built on 15 years of statistical market analysis, this system prioritizes trade quality over volume. It operates using two non-correlated strategies: Weekly Seasonality: Capitalizes on institutional rebalancing patterns, typically buying Thursday dips to sell into Friday rallies. Volatility Breakout: Utilizes the ID/NR4 pattern to detect price compression and catch major trend explosions . Risk Management & Specs We deliberately avoided risky recovery
FREE
Trend Trap Regime MT4
Muhammad Tamimul Huda
This is a signal dashboard based on SMA and WMA. Bull and Bear signals indicate that the price has likely changed direction (not just a temporary correction). Trap signals indicate that the price is likely only undergoing a correction, so do not rush to take an opposite position. For effective use, focus only on the timeframe column where you trade. You may observe all timeframes if you are accustomed to multi-timeframe analysis. The displayed signals are not intended to tell you to buy or sell

FREE
Simple Dashboard
Muhammad Tamimul Huda
The Simple Dashboard is a dashboard where you can build your own strategy based on RSI, Stochastic, and Moving Average. You can define your own buy and sell signal conditions as you wish. For example, you can set a sell signal when RSI is at the 70 level and Stochastic is in a death cross, or even the opposite. The point is, set it however you like and apply your own custom configuration. That’s how simple it is.

FREE
Fractal Breakout EA
Muhammad Tamimul Huda
Fractal Breakout EA Fractal Breakout EA is an Expert Advisor based on a breakout strategy that uses signals from asymmetric fractals 50 and 5. Entries are generated based on the candle position relative to these fractal levels. Stop Loss and Take Profit are dynamically calculated using multiples of the ATR 14 value to adapt risk management to market volatility. This EA uses a Machine Learning system based on XGBoost as a signal filter. Each signal is evaluated before execution, and trades are o
Fractal91 Gold EA
Muhammad Tamimul Huda
Fractal91 Gold EA Note:  Please avoid backtesting this EA on data prior to 2026. Since it uses  Machine Learning.   the pre-2026 period is part of the  training data (in-sample) , so the results will be artificially perfect and not representative of future performance. Fractal91 is an automated trading system designed for XAUUSD (Gold) based on a fractal breakout strategy combined with advanced signal filtering. The EA analyzes market conditions using multiple technical indicators and statisti
Filtro:
Sem comentários
Responder ao comentário











