Stochastic ratio
- Indicators
- Version: 1.0
- Activations: 10

Stochastic Ratio SMA
Stochastic Ratio SMA is a custom technical analysis indicator for MetaTrader 5 that combines trend analysis with a modified momentum oscillator. Unlike the standard Stochastic Oscillator, which uses the High-Low price range as its input, this indicator applies the stochastic calculation to a custom data series derived from the ratio between the Close price and the 20-period Simple Moving Average (SMA 20).
The Close/SMA ratio is normalized and smoothed using the Stochastic Oscillator algorithm, producing an oscillator that ranges from 0 to 100. This approach measures how far the current closing price deviates from its moving average while presenting the information in a familiar stochastic format.
Key Features
-
Custom Calculation Logic
Calculates the ratio of the closing price to the 20-period Simple Moving Average (SMA 20), then transforms the result into a normalized oscillator with values ranging from 0 to 100.
-
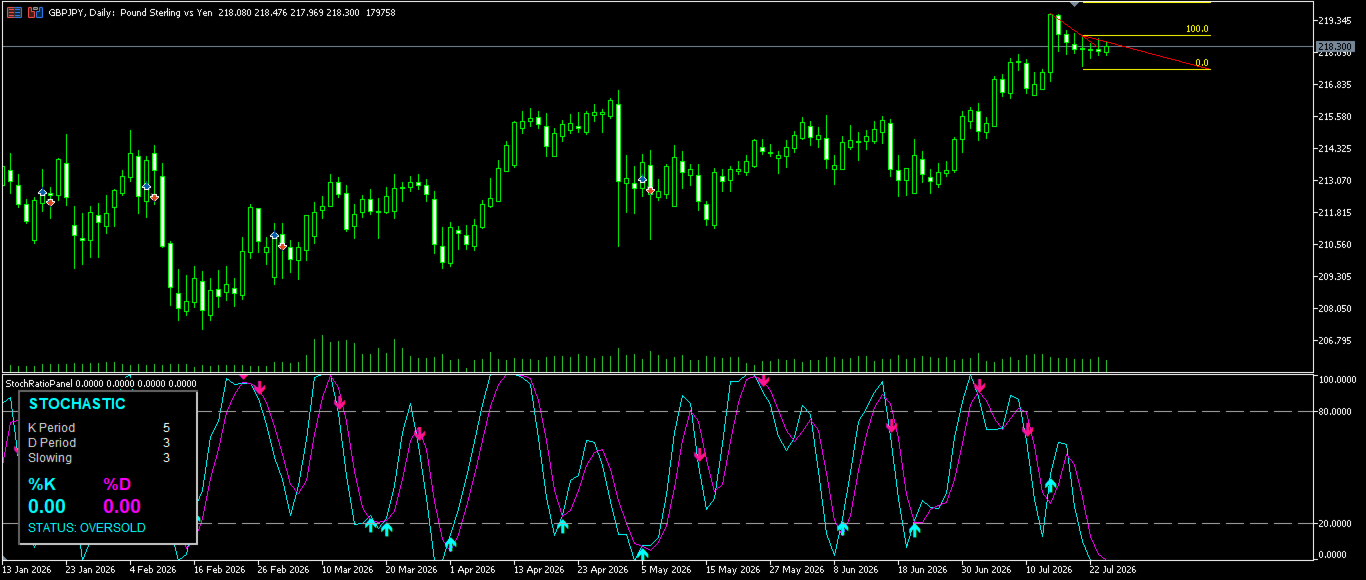
Minimalist Visualization & Crossover Signals
Displays thin %K (Aqua) and %D (Magenta) lines for a clean and unobtrusive appearance. The indicator automatically plots small signal arrows whenever a bullish crossover occurs in the Oversold zone (≤20) or a bearish crossover occurs in the Overbought zone (≥80).
-
Modern Dashboard
Includes a clean, dark-themed dashboard that displays the current indicator settings and real-time values, including the market status (NEUTRAL, OVERBOUGHT, or OVERSOLD), %K, and %D. The compact layout allows essential information to remain visible without obstructing the chart.
-
Configurable Parameters
All calculation parameters, including the K Period, D Period, Slowing, SMA Period, and signal levels, can be configured through the standard MetaTrader 5 input settings to suit different trading styles.
Notes
This indicator is not a standard implementation of the Stochastic Oscillator. Instead of using the traditional High-Low price range, it applies the stochastic calculation to a custom input series derived from the Close/SMA (20) ratio.
By combining a modified mathematical approach with a modern visual design, the indicator presents momentum information in a clear, responsive, and easy-to-read format for technical analysis.