VWAP Volume Price Customized cycle

Multi-Timeframe Anchored VWAP Indicator (Custom Period & Standard Deviation Channels) — Technical Description

Overview
This indicator extends the traditional VWAP with multi-timeframe anchoring, session reset, and standard deviation channels, providing a dynamic "fair value" reference area. All calculations are based on currently visible price and volume data; the indicator contains no future functions, does not repaint, and does not drift.

Core Features

  1. Multi-Timeframe Anchoring

    • Automatically attaches a higher-timeframe VWAP (e.g., H4+ → Monthly, H1 → Weekly, M30- → Daily), or manually selects any timeframe (MN1, W1, D1, H4, etc.).

  2. Customizable Base Period

    • A toggle allows free selection of the calculation period.

  3. Session Multiple Reset Points

    • Supports multiple daily reset times (e.g.,  00:00,08:00,16:00 ), recalculating VWAP at each specified moment to match different trading sessions.

  4. Triple Standard Deviation Channels

    • Generates six symmetric channels (±1σ, ±2σ, ±3σ) based on volume-weighted standard deviation. Multipliers are independently adjustable (default 1, 2, 3).

  5. Display Range Control

    • Sets the number of historical periods/sessions to display (e.g., last 10), focusing on recent data.

  6. Automatic Period Breaks

    • Lines automatically break at the end of each period/session, preventing cross-period connections.

  7. Customizable Daily Start Time

    • Allows arbitrary "open time" (e.g., 09:30, 00:00, 17:00) to adapt to different time zones.

  8. Volume-Weighted Calculation

    • Each VWAP line is calculated from Typical Price × Volume, reflecting actual trading weight.

General Parameter Configuration (Reference)

Parameter Description
Anchor Period Auto or manual (MN1/W1/D1/H4, etc.)
Session Reset Times List of daily reset times
StdDev Multipliers (1/2/3) Channel multipliers, default 1, 2, 3
Display History Periods Number of periods/sessions to show
Daily Start Time Custom open time
Color / Width / Style Fully customizable

Compliance Statement

  • This tool is solely a technical analysis aid. Its output represents statistically derived value ranges and volatility boundaries and does not constitute investment advice or entry/exit signals.

  • The indicator contains no hidden code or malicious components and makes no external network connections.

Note: Per MQL5 forum rules, posts containing trading recommendations or advertising are prohibited. This description is intended for general technical discussion only.


Produtos recomendados
The   Visual Volatility Clustering   indicator clusters the market based on volatility. The indicator does not redraw and gives accurate data, does not use closing prices. Uses the opening prices or the highs or lows of the previous completed bar. Therefore, all information will be clear and unambiguous. The essence of the indicator is to divide the price market into certain areas according to a similar type of volatility. This can be done in any way. In this example, the indicator is configure
The Visual Volatility Clustering indicator clusters the market based on volatility. The indicator does not redraw and gives accurate data, does not use closing prices. Uses the opening prices or the highs or lows of the previous completed bar. Therefore, all information will be clear and unambiguous. The essence of the indicator is to divide the price market into certain areas according to a similar type of volatility. This can be done in any way. In this example, the indicator is configured fo
JSL Orderflow Footprint turns every candle into a price ladder that shows how much volume traded on the bid and on the ask at each price level. It highlights diagonal imbalances, stacked imbalance zones, absorption at candle extremes, cumulative delta (CVD), delta divergence and the daily session volume profile, then combines five of these order-flow conditions into a 0–100 confluence score. A signal is only issued on bar close when the score is high, clearly one-sided and confirmed by the candl
Stop spending hours manually scanning charts. The Propfolio Trade Insight Engine is an institutional-grade analytical dashboard and auto-markup utility designed specifically for SMC, ICT, BTMM, and Prop Firm traders. This powerful engine monitors your entire Market Watch (or a custom list of pairs) simultaneously, instantly detecting high-probability setups and institutional footprints. When you spot a confluence on the dashboard, simply click a button, and the engine will instantly spawn a fre
TradeLogic Pro – The Advanced MT4 EA for Long Term Investing TradeLogic Pro   is an advanced   MetaTrader 4 Expert Advisor (EA)   designed to harness the power of price imbalances in the forex trading markets. Whether you’re a beginner or a professional trader,   TradeLogic Pro   uses sophisticated market analysis to identify high-potential entry points, allowing you to trade smarter and more efficiently. How Does TradeLogic Pro Work? At the core of   TradeLogic Pro   is its ability to   detect

CyberZingFx Trend Reversal
Afsal Meerankutty
4.18 (17)
NEW YEAR SPECIAL DISCOUNT RUNNING NOW 40% DISCOUNT Price slashed from $149 to $89 until 3rd Jan 2025 Indicator captures the trend reversals with no-repaint Buy and Sell Arrow signals. CyberZingFx Trend Reversal Indicator - your go-to solution for accurate and reliable trend reversal signals. With its  advanced trading strategy , the indicator offers you Buy and Sell Arrow signals that do not repaint, making it a reliable tool for catching Swing Highs and Swing Lows in any market and any time fr
FiboPlusWaveRunner
Sergey Malysh
3.29 (7)
Negociação automática e manual Um sistema comercial pronto baseado nas  ondas de Elliott e níveis de Fibonacci . Simples e de fácil acesso Exibição de marcação das ondas de Elliott (opção geral ou alternativa) em um gráfico Construção dos níveis horizontais, linhas de apoio e resistência, canal Sobreposição dos níveis de Fibonacci para as ondas 1, 3, 5, A Sistema de alerta (no ecrã, E-Mail, Push notificações) painel visual para abertura de ordens para negociação manual painel visual para configu
Most EAs show you one lucky week. This one shows you three months, day by day. Prop Firm Account Director is a fully automated MT4 Expert Advisor for XAUUSD (Gold), built around the things prop firm traders care about most: steady daily results, controlled risk and no emotional decisions. We publish the full verified track record, including the drawdowns. Track record (demo, $100,000 start, MT4, 100% automated) Metric Result Total gain +28.25% (+$28,251.65) Total trades 1,778 Win rate 84.7% Prof


Voenix
Lorentzos Roussos
4.58 (12)
Padrões harmônicos , Scanner e comerciante Padrões incluídos: Padrão ABCD Padrão Gartley Padrão de morcego Padrão de cifra 3Padrão de acionamentos Padrão Cisne Negro Padrão de cisne branco Padrão Quasimodo ou padrão Over Under Padrão de morcego alternativo Padrão de borboleta Padrão de caranguejo profundo Padrão de caranguejo Padrão de tubarão Padrão de cinco O Padrão de cabeça e ombros Padrão de triângulo ascendente Padrão Um Dois Três E 8 padrões personalizados Voenix é um scanner de padrões
Money Flow Profile MT5 HERE   Here   our more valuable tools SMC Trend Trading   ,  Easy SMC Trading  ,  Institutional SMC Architect Volume Analysis Tools  ,  Volume flow Profile  ,  Market volume profile  , FVG with Volume  , Liquidity Heatmap Profile  ,  Volume Spread Analysis This Master Edition is engineered for clarity and speed, featuring a unique Auto-Theme Sync system that instantly beautifies your chart layout upon loading. Key Features: True Money Flow Calculation: Goes beyond stand
Introduction It is common practice for professional trades to hide their stop loss / take profit from their brokers. Either from keeping their strategy to the themselves or from the fear that their broker works against them. Using this indicator, the stop loss / take profit points will be drawn on the product chart using the bid price. So, you can see exactly when the price is hit and close it manually.  Usage Once attached to the chart, the indicator scans the open orders to attach lines for t
Nexorium Trend EA — Turn Gold's Volatility Into Consistent Growth A fully automated XAUUSD trend-following system, built for traders who want disciplined execution without watching the charts 24/5. The Numbers That Matter Nexorium Trend EA has been running on a verified track record account, and the results speak for themselves: Metric Result Total Growth +27.67% Profit Factor 2.46 Max Drawdown 6.78% Average Monthly Return 17.54% Total Pips Captured +5,607.4 Win Rate 46.3% Expectancy per Trade 1
Zonecore MT4
Frederic Jacques Collomb
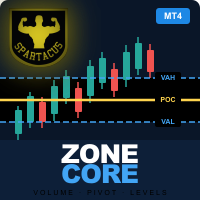
ZONECORE — Volume Profile & Pivot Levels Identifique as zonas de preço mais negociadas com precisão cirúrgica. MT5 version O que é o ZONECORE? ZONECORE é um indicador de nível profissional que combina o Perfil de Volume (Volume Profile) e os Níveis de Pivô de alto volume (Pivot Levels) para revelar as zonas de preço onde o mercado passou mais tempo e negociou maior volume. Essas zonas atuam como ímãs para o preço — conhecê-las oferece uma vantagem decisiva para identificar suportes, resistência
Matrixs
Andriy Sydoruk
Matrix is a Forex arrow indicator. Displays signals simply and clearly! The arrows show the direction of the transaction, and are colored accordingly, which can be seen in the screenshots. As you can see, trading with such an indicator is easy. I waited for an arrow to appear in the desired direction - I opened a deal. An arrow formed in the opposite direction - closed the deal. The indicator also displays the lines with the help of which the arrow signals are formed, taking into account the int
Octave Fractal Channel — Dynamic Gann-Based Support/Resistance Levels with Auto-Scaling. This indicator plots a dynamic channel based on the fractal structure of price movement. Channel levels adapt to the current symbol and timeframe, making it suitable for use across various financial instruments — from currency pairs to cryptocurrencies and indices. The indicator can be used in combination with other technical tools, such as the RSI oscillator, to provide additional signal filtering. How to
New York AM Session Profile NY AM Session Profiling Framework | Non-Repainting | Real-Time | FX & Index Presets | MT5 Version Available Full Setup Guide & Strategy Playbook: https://www.mql5.com/en/blogs/post/771380 MT5 Version: https://www.mql5.com/en/market/product/180798 Indicator Overview The New York AM Session Profile framework is a   professional market-structure visualization tool   designed for traders who study liquidity, session behaviour, and institutional price delivery. Instead
Overview Harmonic Patterns MT4 is a technical analysis indicator designed for the MetaTrader 5 platform. It identifies and displays harmonic price patterns, such as Butterfly, Cypher, Crab, Bat, Shark, and Gartley, in both bullish and bearish directions. The indicator calculates key price levels, including entry, stop loss, and three take-profit levels, to assist traders in analyzing market movements. Visual elements and customizable alerts enhance usability on the chart. Features Detects six ha
Um indicador técnico que calcula suas leituras nos volumes de negociação. Na forma de histograma, mostra o acúmulo da força do movimento do instrumento de negociação. Possui sistemas de cálculo independentes para direções de alta e baixa. Funciona em quaisquer instrumentos de negociação e prazos. Pode complementar qualquer sistema de negociação. O indicador não redesenha seus valores, os sinais aparecem na vela atual. É fácil de usar e não carrega o gráfico, não requer cálculos de parâmetros adi
O Touch VWAP é um indicador que permite calcular uma Média Ponderada por Volume (VWAP) apenas apertando a tecla 'w' no seu teclado e após clicando no candle do qual deseja realizar o calculo, clicando abaixo do candle é calculada a VWAP baseado na minima dos preços com o volume, clicando sobre o corpo do candle é calculado uma VWAP sobre o preço medio com o volume e clicando acima do candle é calculado uma VWAP baseado na máxima dos preços com o volume, voce tambem tem a opção de remover a VWAP
Power Flow Binary
Ganesh Tanaji Lohar
POWER FLOW PRO — Binary Options Edition For the first time ever, the POWER FLOW PRO cumulative dominance logic is specially optimized for Binary Options trading. POWER FLOW PRO is a smart real-time pressure-flow indicator designed to detect aggressive market momentum and short-term directional dominance for fast Binary Options entries. The system analyzes: Real-time buying pressure Real-time selling pressure Momentum candle strength Cumulative dominance flow Continuation pressure to generate hig
Draws high of the day and low of the day anchored VWAPs for multiple days.                   DaysBack = Today only, today + 1 day back, today + 2 days back...               Today recalculates live                             Historical days are computed ONCE and frozen (static).                Colors tab shows exactly 2 entries:                                  High of the day VWAP color  (default: Green)                                   Low of the day VWAP color  (default: Red)               
Multi-Timeframe Anchored VWAP Indicator (Custom Period & Standard Deviation Channels) — MT5 Technical Description Overview This indicator extends the traditional VWAP with multi-timeframe anchoring, session reset, and standard deviation channels, providing a dynamic "fair value" reference area for traders. All calculations are based on currently visible price and volume data; the indicator contains no future functions, does not repaint, and does not drift. Core Features Multi-Timeframe Anchori
Apex Trader MT4
Profalgo Limited
5 (3)
PROMOÇÃO DE LANÇAMENTO: Apenas 5 exemplares disponíveis por 199$ Preço final: 999$ NOVO: Compre agora e ganhe 1 EA grátis!   (para 2 contas comerciais) Resultados ao vivo:   https://www.mql5.com/en/signals/1836525 high risk account Apresentamos a mais recente adição à nossa linha de robôs de negociação forex -     o Apex Trader   . Desenvolvido com anos de experiência na criação de consultores especializados, o Apex Trader é uma poderosa ferramenta de negociação para o mercado cambial.   Como
ProEngulfing
Ashkan Hazegh Nikrou
4.5 (2)
Apresentamos o ProEngulfing - Seu Indicador Profissional de Padrão Engulf para MT4 Desbloqueie o poder da precisão com o ProEngulfing, um indicador de ponta projetado para identificar e destacar padrões Engulf qualificados no mercado de Forex. Desenvolvido para o MetaTrader 4, o ProEngulfing oferece uma abordagem meticulosa para o reconhecimento de padrões Engulf, garantindo que você receba apenas os sinais mais confiáveis para suas decisões de negociação. Como o ProEngulfing funciona: O ProEng
Smart Moves Binary Indicator for MT4 Overview Smart Moves Binary Indicator is a technical analysis indicator for MetaTrader 4 (MT4) designed to help traders identify potential BUY and SELL opportunities after candle confirmation. Signals are generated only after the current candle has closed, ensuring that confirmed arrows remain fixed on historical bars without recalculation. The indicator is suitable for any Forex currency pair and supports multiple timeframes, making it adaptable to differen
TradeQA
Guo Sheng Zhao
这款量价结构指标适用于   MetaTrader 4 和 MetaTrader 5   的图表分析指标,集合量价结构、成交量分布、市场情绪、波动提示和关键价格区域表现于一体。指标运行直接于主图窗口,可帮助交易者快速观察市场的重要价格位置与活跃程度。 它采用了动态的POC,可以让你看到市场中价值的迁移过程。同时还有四种成交量K线涂色使你不会在不合适的位置入场。 ni你在图表上可以看到VAH,POC,VAH,以及分布图和右侧的情绪值,这样你能轻松的看到市场的交易情绪从而不陷入狂热中去,冷静的看待交易,看待盈亏。 希望你能通过这个指标清晰的看清市场,明白价格所在,位置所处,找到自己的交易节奏。 z指标只是交易的一部分,只是辅助,所以,你要专注而不执拗,冷静的看待每次交易。加油吧,孤独的交易者。
This is a new strategy for SUPPLY DEMAND areas It is based on a calculation using the tick volume to detect the big price action in market for both bear /bull actions this smart volume action candles are used to determine the supply and demand areas prices in between main supply and demand lines indicate sideway market  up arrows will be shown when prices moves above the main supply and the secondary supply lines Down arrows will be shown when prices moves below the main demand and the secondary
The indicator allows you to trade binary options. The recommended time frame is М1 and the expiration time is 1,2,3 minutes. The indicator suitable for auto and manual trading. A possible signal is specified as a arrows above/under a candle. You should wait until the candle closes! Arrows are not re-painted Trade sessions: TOKYO section (Half-end) Currency pairs: USD/JPY Working time frame: M1 Expiration time: 1,2,3 minutes. The indicator also shows good results when using the martingale strateg
FREE
El indicador "MR BEAST ALERTAS DE LIQUIDEZ" es una herramienta avanzada diseñada para proporcionar señales y alertas sobre la liquidez del mercado basándose en una serie de indicadores técnicos y análisis de tendencias. Ideal para traders que buscan oportunidades de trading en función de la dinámica de precios y los niveles de volatilidad, este indicador ofrece una visualización clara y detallada en la ventana del gráfico de MetaTrader. Características Principales: Canal ATR Adaptativo: Calcula
Harmonic Pattern Dashboard
Mihails Babuskins
4.2 (5)
harmonic patterns   Harmonic patterns can be used to spot new trading opportunities and pricing trends – but only if you know exactly what you are looking for. Harmonic patterns are formed by combining geometric shapes and Fibonacci levels. As a result, Fibonacci levels are the key concept of these patterns. Identifying harmonic patterns requires more practice than other market classical patterns. But by learning these patterns, you can recognize the future trend of the price chart. These patter
Os compradores deste produto também adquirem
Miraculous Indicator Binary & Forex v3 StrategySafe Miraculous Indicator Binary & Forex v3 StrategySafe é um indicador profissional criado para traders que desejam sinais claros, confirmações avançadas e uma forma estruturada de operar nos mercados Binary e Forex. A versão v3 traz MIR Dashboard, Miraculous Confirmation Dashboard, GANN Law, níveis Square of 9, ângulos GANN e um modo Forex mais completo para analisar o mercado com mais precisão. Principais recursos Modo Binary e modo Forex em um ú
TrendMaestro
Stefano Frisetti
4 (4)
Attention: beware of SCAMS, TRENDMAESTRO is only ditributed throught MQL5.com market place. note: this indicator is for METATRADER4, if you want the version for METATRADER5 this is the link:  https://www.mql5.com/it/market/product/108106 TRENDMAESTRO ver 2.5 TRENDMAESTRO recognizes a new TREND from the start, he never makes mistakes. The certainty of identifying a new TREND is priceless. DESCRIPTION TRENDMAESTRO identifies a new TREND in the bud, this indicator examines the volatility, volumes a
FFx Engulfing Setup Alerter gives trade suggestions with Entry, Target 1, Target 2 and StopLoss. Below are the different options available: Entry suggestion - pips to be added over the break for the entry 3 different options to calculate the SL - by pips, by ATR multiplier or at the pattern High/Low 3 different options to calculate the 2 TPs - by pips, by ATR multiplier or at Risk/Reward Offset the dashboard - any place on the chart Remove the suggestion once the price reached the SL line Lines
FFx InsideBar Setup Alerter gives trade suggestions with Entry, Target 1, Target 2 and StopLoss. Below are the different options available: Entry suggestion - pips to be added over the break for the entry Minimum candle size - to avoid too close buy/sell entry suggestions 3 different options to calculate the SL - by pips, by ATR multiplier or at the pattern High/Low 3 different options to calculate the 2 TPs - by pips, by ATR multiplier or at Risk/Reward Offset the dashboard - any place on the c
FFx OutsideBar Setup Alerter gives trade suggestions with Entry, Target 1, Target 2 and StopLoss. Below are the different options available: Entry suggestion - pips to be added over the break for the entry. 3 different options to calculate the SL - by pips, by ATR multiplier or at the pattern High/Low. 3 different options to calculate the 2 TPs - by pips, by ATR multiplier or at Risk/Reward. Offset the dashboard - any place on the chart. Remove the suggestion once the price reached the SL line.
FFx PinBar Setup Alerter gives trade suggestions with Entry, Target 1, Target 2 and StopLoss. Below are the different options available: Entry suggestion - pips to be added over the break for the entry Minimum candle size - to avoid too small candles 3 different options to calculate the SL - by pips, by ATR multiplier or at the pattern High/Low 3 different options to calculate the 2 TPs - by pips, by ATR multiplier or at Risk/Reward Offset the dashboard - any place on the chart Remove the sugges
Automatic, live & interactive picture of all trendlines. Assign push, email and sound alerts to the lines of your choice and be informed about price rollback, breakout, rollback after breakout, number of rollbacks, line expiration by double breakout. Correct, drag or delete the lines and interactively tune the line system. https://youtu.be/EJUo9pYiHFA . Chart examples https: //www.mql5.com/en/users/efficientforex Price Interaction Events All events are effective immediately and only after one
The purpose of this new version of the MT4 standard indicator provided in your platform is to display in a sub-window multiple timeframes of the same indicator with its divergences. See the example shown in the picture below. But the display isn't like a simple MTF indicator. This is the real display of the indicator on its timeframe. Here's the options available in the FFx divergences indicator: Select the timeframes to be displayed (M1 to Monthly) Define the width (number of bars) for each tim
The purpose of this new version of the MT4 standard indicator provided in your platform is to display in a sub-window multiple timeframes of the same indicator with its divergences. See the example shown in the picture below. But the display isn't like a simple MTF indicator. This is the real display of the indicator on its timeframe. Here's the options available in the FFx divergences indicator: Select the timeframes to be displayed (M1 to Monthly). Define the width (number of bars) for each ti
The FFx Dashboard MTF alerter will show you on a single chart all the timeframes (M1 to Monthly) with their own status for the indicator. 2 Alert Options: Single timeframe: each selected timeframe alert separately when a signal occurs Multi timeframes: all selected timeframes must agree for an alert to be triggered Both options have an input to select the timeframes to be used for the alert(s). How to Understand the Status: Green/Red square: histogram above/below 0 line Green square + Red bord
The FFx Dashboard MTF alerter will show you on a single chart all the timeframes (M1 to Monthly) with their own status for the indicator. 2 Alert Options: Single timeframe: each selected timeframe alert separately when a signal occurs Multi timeframes: all selected timeframes must agree for an alert to be triggered Both options have an input to select the timeframes to be used for the alert(s). How to understand the status: Green/Red square: RSI above/below 50 line Green square + Red border: R
The FFx Dashboard MTF alerter will show you on a single chart all the timeframes (M1 to Monthly) with their own status for the indicator. 2 Alert Options: Single timeframe: each selected timeframe alert separately when a signal occurs Multi timeframes: all selected timeframes must agree for an alert to be triggered Both options have an input to select the timeframes to be used for the alert(s). How to understand the status: Green/Red square: Stoch above/below 50 line Green square + Red border:
The FFx Dashboard MTF alerter will show you on a single chart all the timeframes (M1 to Monthly) with their own status for the indicator. 2 Alert Options: Single timeframe: each selected timeframe alert separately when a signal occurs Multi timeframes: all selected timeframes must agree for an alert to be triggered Both options have an input to select the timeframes to be used for the alert(s). How to understand the status: Green/Red square: Price above/below Cloud (Kumo) Green square + Red bo
The FFx Dashboard MTF alerter will show you on a single chart all the timeframes (M1 to Monthly) with their own status for the indicator. 2 Alert Options: Single timeframe: each selected timeframe alert separately when a signal occurs Multi timeframes: all selected timeframes must agree for an alert to be triggered Both options have an input to select the timeframes to be used for the alert(s). How to understand the status: Green/Red square: MA pointing Up/Down Green square + Red border: MA po
The FFx Dashboard MTF alerter will show you on a single chart all the timeframes (M1 to Monthly) with their own status for the indicator. 2 Alert Options: Single timeframe: each selected timeframe alert separately when a signal occurs. Multi timeframes: all selected timeframes must agree for an alert to be triggered. Both options have an input to select the timeframes to be used for the alert(s). How to understand the status: Green square: Price above PSAR Red square: Price below PSAR Options
The FFx Dashboard MTF alerter will show you on a single chart all the timeframes (M1 to Monthly) with their own status for the indicator. 2 Alert Options: Single timeframe: each selected timeframe alert separately when a signal occurs Multi timeframes: all selected timeframes must agree for an alert to be triggered Both options have an input to select the timeframes to be used for the alert(s). How to understand the status: Green/Red square: CCI above/below levels (ie. 100/-100) Grey square: C
The FFx Dashboard MTF alerter will show you on a single chart all the timeframes (M1 to Monthly) with their own status for the indicator. 2 Alert Options: Single timeframe: each selected timeframe alert separately when a signal occurs Multi timeframes: all selected timeframes must agree for an alert to be triggered Both options have an input to select the timeframes to be used for the alert(s). How to understand the status: Green/Red square: ADX above level Grey square: ADX below level Red bor
The FFx Dashboard MTF alerter will show you on a single chart all the timeframes (M1 to Monthly) with their own status. 2 Alert Options: Single timeframe: each selected timeframe alert separately when a signal occurs Multi timeframes: all selected timeframes must agree for an alert to be triggered Both options have an input to select the timeframes to be used for the alert(s). How to understand the status: Green/Red square: bullish/bearish candle Options available in the FFx Dashboard Alerter
The indicator of a Professional Trader is an arrow indicator for predicting the direction of price movement. I have been working on this indicator since 2014. You can use this indicator as your main indicator, use its entry signals, and use it as your only indicator to find entry points. About the product: Recommended TF [H4-D1-W1]   . The indicator predicts the direction of the next candle. Fits a variety of tools; Flexibility in settings for different instruments and intervals through the MO
The [GRAFF] III manual trading system is based on multiple MetaTrader (MT4) indicators. Together, the entire PACK of GRAFF III indicators makes an advanced trading tool. The system consists of over 20 different custom-built indicators which have been carefully selected and tested in the long term to produce strong and efficient trading signals. The particular indicators are based on different mathematical formulas, so the entire system is calibrated to remove false signals from its own indicator
FFx Universal Strength Meter PRO is more than a basic strength meter. Instead of limiting the calculation to price, it can be based on any of the 19 integrated strength modes + 9 timeframes. With the FFx USM, you are able to define any period for any combination of timeframes. For example, you can set the dashboard for the last 10 candles for M15-H1-H4… Full flexibility! Very easy to interpret... It gives a great idea about which currency is weak and which is strong, so you can find the best pai
A simplistic indicator informing a user on RSI divergence by sending messages to mobile device and email. The indicator draws 2 vertical lines, marking two RSI extrema that formed the divergence. You get the alert, open the charts and make a decision. The indicator does not show past divergences, thus when you attach it to a chart for the first time you see nothing. Graphics and alerts will appear as soon as divergences do. Drop it in Tester to see how it works. Parameters: RSIPeriod - number of
Pan PrizMA CD Phase is an analogue of the МetaТrader 5 indicator , and is an option based on the Pan PrizMA indicator. Details . Averaging by a quadric-quartic polynomial increases the smoothness of lines, adds momentum and rhythm. Extrapolation by the sinusoid function near a constant allows adjusting the delay or lead of signals. The value of the phase - wave status parameter (which is close in meaning to the trigonometric phase or the angle of the radius-vector rotation in the trigonometric p
Green Wall Arrows
Daniel Luchinger
1 (1)
The Name Green Wall : Arrows hits a lot of TP, by changing the idea of non using SL as something bad, but instead use Small TP and a lot of free Margin and Patience. Use micro TP and a lot of Free Margin with this indicator on Forex. It also can be used with Binary Options. This strategy is intended to be traded Manually. This Indicator runs on Open Bar, arrows will delete when price are against it. The only Indicator Parameter is Alerts true/false, all the rest is included inside the code. Arro
Golden Monowave
Ahmed Mohamed Ali
Golden Monowave is monowave indicator, the monowave theory is one of Elliott wave approach and one of most complicate and accurate method. Golden Monowave can shortcut many major steps to identify and describe the monowave. It works on any timeframe and with any trading instrument, including currencies, indices, futures, etc. Input Parameters initial_Bars - set the initial number of bars to calculate. wave_color - select the color of the wave. label_color - select the color of labels. temp_labe
Ticks Size
Viktor Kolmakov
This indicator displays in a separate window the difference between the number of points which increased the price, and the number of points that decreased the price during the time interval specified in the settings. The time interval for calculation is expressed as the number of bars of the chart the indicator is attached to. This approach allows you to evaluate the movement direction (growth or fall) of the instrument's price, the strength of the movement and the size of the movement in point
MetaTrader 5 version available here : https://www.mql5.com/en/market/product/24882 FFx Basket Scanner is a global tool scanning all pairs and all timeframes over up to five indicators among the 16 available. You will clearly see which currencies to avoid trading and which ones to focus on. Once a currency goes into an extreme zone (e.g. 20/80%), you can trade the whole basket with great confidence. Another way to use it is to look at two currencies (weak vs strong) to find the best single pairs
Mais do autor
Title:FX-AIEA Supply and Demand Zone Indicator (MT5) — Technical Overview Version: 2.51 | Platform: MetaTrader 5 Introduction Supply and demand zones are considered a core manifestation of institutional order flow, providing a more direct reflection of buying and selling pressure than traditional support/resistance levels. This indicator attempts to automate the identification of high-probability supply and demand zones using an adaptive ZigZag algorithm, reducing the subjectivity and time asso
本EA通过智能AI程序筛选符合条件的订单,以毫秒级极速按使用者任意条件进行平仓; 帮助交易员快速 平盈利单:平仓该图表品种所有盈利的单,获得利润; 帮助交易员快速 平亏损单:平仓该图表品种所有亏损的单,截断亏损; 帮助交易员快速 SELL平仓:平仓该图表品种所有SELL的单,快速解套锁仓; 帮助交易员快速 BUY平仓:平仓该图表品种所有BUY的单, 快速解套锁仓; 帮助交易员快速 全部平仓:平仓该图表品种所有单,快速落袋为安。 智能快速平仓面板:共五个按钮 平盈利单:平仓该图表品种所有盈利的单 平亏损单:平仓该图表品种所有亏损的单 SELL平仓:平仓该图表品种所有SELL的单 BUY平仓:平仓该图表品种所有BUY的单 全部平仓:平仓该图表品种所有单
Parada automática de ganhos e perdas: Este EA usa um programa avançado de inteligência artificial, Situação da ordem do gráfico de seguimento em tempo real, Capture com precisão as ordens de fechamento em um gráfico com um EA carregado, Este EA adiciona automaticamente stop-profit a uma ordem por stop-profit definido, Economize significativamente o tempo de colocação dos traders. Após colocar a ordem, o EA adiciona automaticamente stop-profit e stop-loss Adicione também uma barreira de pr
This utility sets the same stop loss and take profit level on several open positions at the same time. It does not open or close any trade and it makes no market decision. Modifying positions one by one in the terminal takes time, and while you are doing it the price can move away. This EA applies the levels you enter to all selected positions in one action, so the whole basket is protected in a single step. Example You hold five XAUUSD buy positions opened at 2510, 2508, 2506, 2504 and 2495
江恩理论 江恩理论是金融市场分析中的一种重要工具,它基于市场周期性和自然法则的假设,通过特定的技术分析工具来预测市场走势。江恩理论的主要内容包括: 市场周期 :江恩认为市场存在周期性波动,这些周期可以通过特定的时间周期和价格周期来识别。 价格和时间 :江恩理论强调价格和时间之间的相互作用,认为两者是市场分析的关键要素。 江恩角度线 :这是江恩理论中的一种重要技术分析工具,用于识别市场的支撑和阻力水平。 江恩轮中轮 :又称“江恩圆形图”,是江恩发明的另一种重要技术分析工具,用于预测市场的未来走势。 量化分析 :T3指标可能通过特定的数学模型或算法来量化市场的行为或特征。 趋势识别 :T3指标可能用于识别市场的趋势方向,包括上升趋势、下降趋势或横向整理。 交易信号 :基于T3指标的分析,投资者可能能够获得买入或卖出的交易信号。
This indicator combines six classic oscillators in one chart window and draws each of them as two lines. One input switches between them, so you can compare signals without loading several separate indicators. Available types: MACD, KDJ, RSI, CCI, RVI and DeMark. The two lines work like the main line and the signal line of the selected oscillator. When the fast line crosses the slow line, the direction changes and the lines switch colour: one colour after an upward cross, another after a downw
AI Fibonacci Indicators (Non-Redraw) is a professional and easy-to-use AI fully automated Fibonacci generator Forex trading indicator that uses the latest AI technology to automatically identify accurate Fibonacci positions on charts and automatically plot them on charts. This indicator provides accurate Fibonacci important price positions. Applicable to any currency pair and other products. It has seven function switches, There are five different Fibonacci types (" Fibonacci retracement line "
Two line MACD index composition MACD line (express line) : Usually calculated by subtracting the 12-cycle EMA from the 26-cycle EMA, it is more sensitive to price changes, can quickly reflect the change of the recent price trend, its fluctuation is relatively frequent, used to capture the dynamics of short-term market trends. Signal line (slow line) : Generally a 9-cycle EMA of the MACD line, its role is to smooth the MACD line, filter out some short-term noise and false signals, make the indic
AI Supertrend timely alerts MT4 Super Trend timely reminder indicator introduction I. Overview of indicators The MT4 Super Trend Alert Indicator is a technical analysis tool specifically designed for the MetaTrader 4 platform to help traders accurately capture changes in market trends and send timely signals to alert traders to potential trading opportunities. It is based on a unique AI-based algorithm that takes into account factors such as price volatility, trend strength, and market volatil
MT4 platform AI T3 MA Super Fill indicator use introduction I. Overview of indicators The AI T3 MA Super Fill indicator is a powerful analytical tool that combines advanced algorithms and T3 moving average technology to provide traders on the MT4 platform with accurate market trend judgments and trading signals. It uses intelligent algorithms to deeply process the price data, and displays the changes of the T3 moving average in a unique way to help traders more effectively grasp the market dyn
MT4CandleTime index introduction MT4CandleTime is an indicator for the MT4 platform, which can display the remaining time of the current K line in the form of an intuitive digital countdown, which is convenient for traders to grasp the trading rhythm. Precise time control: The MT4CandleTime indicator provides traders with extremely accurate K-line remaining time data, enabling them to fine manage the time rhythm in the trading process, avoiding the hasty or delayed trading decisions caused by
This indicator draws the volume bars as a colour gradient instead of a single flat colour, so that strong and weak volume can be told apart at a glance. Every bar is compared with the average volume over a lookback period you set. The further a bar stands above that average, the deeper its colour; bars near or below the average are drawn in a pale shade. The hue follows the candle direction, one colour for volume on rising candles and another for volume on falling candles, so the balance betwe
MT4 ATR Stops indicator introduction: This is a dynamic support resistance indicator based on average true volatility (ATR) that calculates the volatility of the price, plots the channel on a K chart, and suggests trading timing with intuitive color and dot-like signals. Open and close positions 1. Go long (go long) Signal feature: The color of the K line changes to green, and a green dot appears on the chart. Logic: Price broke above the dynamic upper track resistance calculated by ATR, indica
This EA deletes pending orders that stay on the account longer than a period you define. It does not open or close any market position and it makes no trading decision. Note on the name: "timeframe" here means the lifetime of an order in minutes, not the chart period. The EA works on any chart timeframe; what matters is how long a pending order has existed. A pending order that has been forgotten can occupy margin or get filled at a price you no longer want. This utility removes such orders a
Time-Based Auto-Close Order Management Tool (MT4) — Technical Description Overview This is an automated order management EA based on time-algorithm logic. Its core function is to automatically execute preset closing operations when user-defined holding periods expire, aiming to help traders enforce predetermined rules mechanically and reduce emotional interference. Core Closing Modes Closing Mode Functional Definition Close All Closes all eligible positions when the set time is reached. Close
Multi-Timeframe Anchored VWAP Indicator (Custom Period & Standard Deviation Channels) — MT5 Technical Description Overview This indicator extends the traditional VWAP with multi-timeframe anchoring, session reset, and standard deviation channels, providing a dynamic "fair value" reference area for traders. All calculations are based on currently visible price and volume data; the indicator contains no future functions, does not repaint, and does not drift. Core Features Multi-Timeframe Anchori
VWAP Volume Price Customized Cycle FX-AIEA — Multi-Timeframe Anchored VWAP Indicator (Technical Features & Parameter Discussion) Overview This indicator extends the traditional VWAP (Volume Weighted Average Price) with multi-timeframe anchoring and customizable session reset mechanisms, aiming to provide a dynamic "fair value" reference area. The indicator constructs symmetric volatility boundaries via triple standard deviation channels (±1σ/±2σ/±3σ), which can serve as reference dynamic support
Title: Smart Quant Enhanced Indicator (Adaptive Nonlinear Filtering & Ensemble Learning Framework) — Technical Features & Algorithmic Logic Description Overview This indicator integrates adaptive nonlinear time series analysis with Ensemble Learning algorithms to statistically model the deeper microstructure of price movements. It presents multidimensional data views via dynamic vector arrows and volatility channel bands on the chart, incorporating a built-in Kalman Filter for real-time noise re
Smoothed Average K Line FX-AIEA — Dual-Layer Composite Smoothing Trend Momentum Indicator (Algorithm & Parameter Discussion) Overview This indicator employs a dual-layer composite smoothing architecture to perform dynamic denoising and structural reconstruction on the OHLC dimensions of price data, generating a standardized momentum histogram. The thin bars respond to short-term momentum pulses, while the thick bars confirm trend direction over a larger scale. Synchronized resonance of both incr
AutoPivot FXAIEA — see the day's support and resistance at a glance In intraday trading, the hardest part is not spotting a pattern. It is answering the most basic question of all: where will price meet resistance today, where will it find support, and which level actually matters. AutoPivot FXAIEA turns that into something you can simply read off the chart. Every trading day it draws the central pivot P with up to four resistance levels R1–R4 and four support levels S1–S4. Which level price is
This utility sets the same stop loss and take profit level on several open positions at the same time. It does not open, close or analyse any trade. Modifying positions one by one in the terminal takes time, and while you are doing it the price can move away. This EA applies the levels you enter to all selected positions in one action, so the whole basket is protected in a single step. Example You hold five XAUUSD buy positions opened at 2510, 2508, 2506, 2504 and 2495. You enter 2530 as tak
This indicator draws a sequence of coloured markers along the price chart to show the direction of the current trend and the bar where that direction changes. Two colours show the running trend, and two more mark the first bar of a new trend. Because the markers sit at a fixed offset from price, they also work as a dynamic level that price tends to respect while the trend is intact. How it works The indicator compares price with a trend reference calculated from the sensitivity input. While
This EA does not open trades. You open your positions yourself, and the EA handles the exit. It monitors the total floating result of all open positions on the account. As soon as the total profit reaches the target you set, every open position is closed at once. The same rule works in the opposite direction: when the total loss reaches the limit you set, all positions are closed automatically. Opening a trade takes a few seconds. Deciding when to close it is what makes the difference. This u
This EA deletes pending orders that stay on the account longer than a period you define. It does not open or close any market position and it makes no trading decision. A pending order that has been forgotten can block margin or get filled at a price you no longer want. This utility removes such orders automatically once they pass the time limit you set, so your capital stays available and your order list stays clean. Key features - Deletes pending orders after a configurable time in the ter
Time-Based Auto-Close Order Management Tool (MT5) — Technical Description Overview This is an automated order management EA based on time-algorithm logic. Its core function is to automatically execute preset closing operations when user-defined holding periods expire, aiming to help traders enforce predetermined rules mechanically and reduce emotional interference. Core Closing Modes Closing Mode Functional Definition Close All Closes all eligible positions when the set time is reached. Close
Multi-Timeframe Anchored VWAP Indicator (Custom Period & Standard Deviation Channels) — MT5 Technical Description Overview This indicator extends the traditional VWAP with multi-timeframe anchoring, session reset, and standard deviation channels, providing a dynamic "fair value" reference area for traders. All calculations are based on currently visible price and volume data; the indicator contains no future functions, does not repaint, and does not drift. Core Features Multi-Timeframe Anchori
RockFirm FX-AIEA V5.18 — Adaptive AI Gold Trading Algorithm (Technical Description) Overview This EA is built on reinforcement learning and time-series prediction algorithms, specifically designed for XAUUSD M5 timeframe. It incorporates a dynamic volatility perception module that adapts trading logic based on market volatility characteristics, rather than relying on fixed grid or Martingale strategies. Core Algorithm Features AI Decision Model : Trained on historical gold data, integrating ma
AutoPivot FXAIEA — see the day's support and resistance at a glance In intraday trading, the hardest part is not spotting a pattern. It is answering the most basic question of all:   where will price meet resistance today, where will it find support, and which level actually matters. AutoPivot FXAIEA turns that into something you can simply read off the chart. Every trading day it draws the central pivot P with up to four resistance levels R1–R4 and four support levels S1–S4. Which level price i
Filtro:
Sem comentários
Responder ao comentário