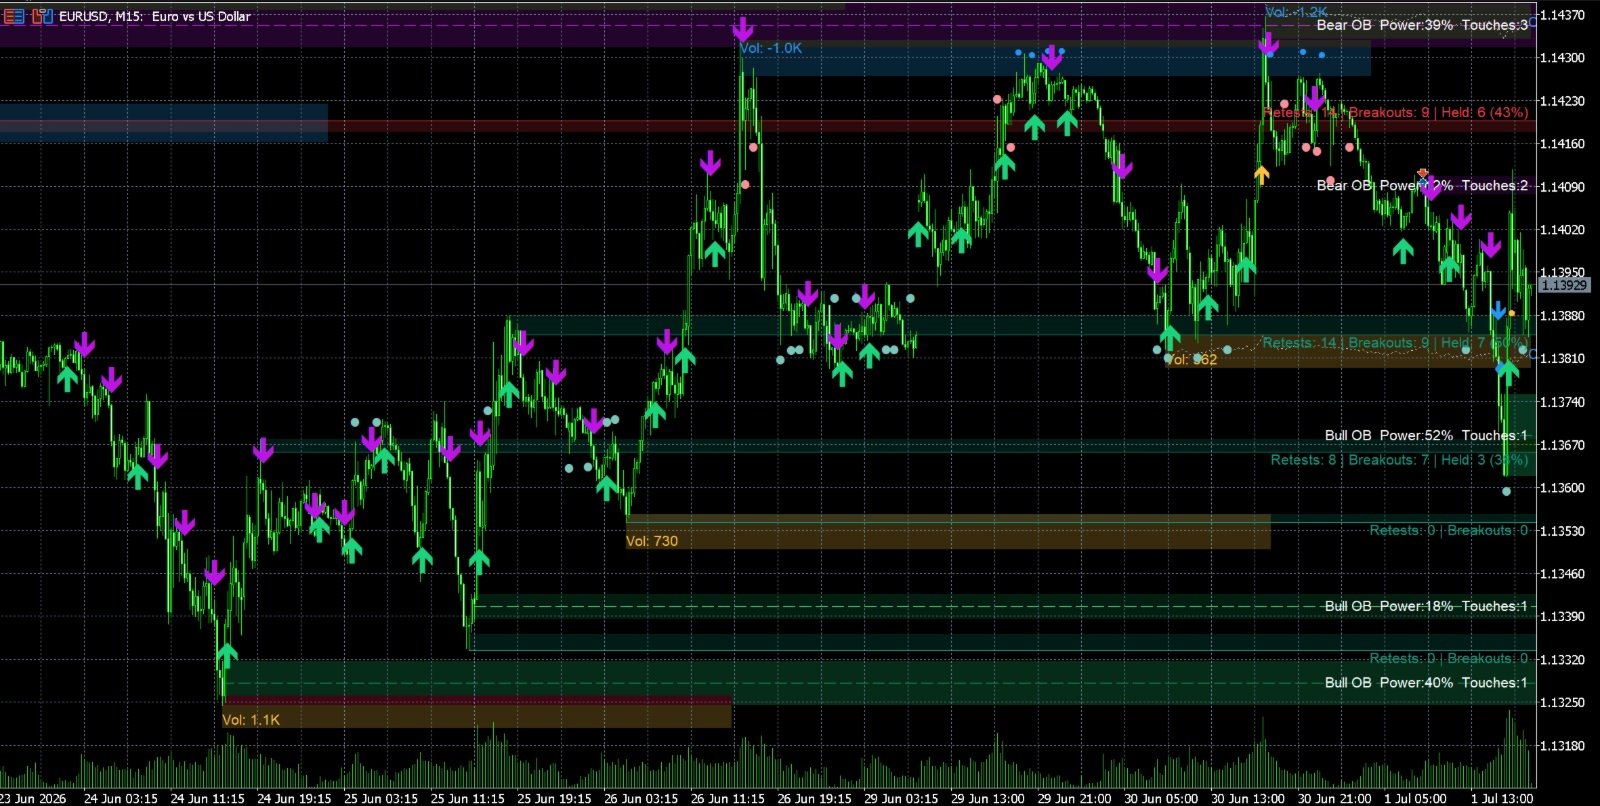
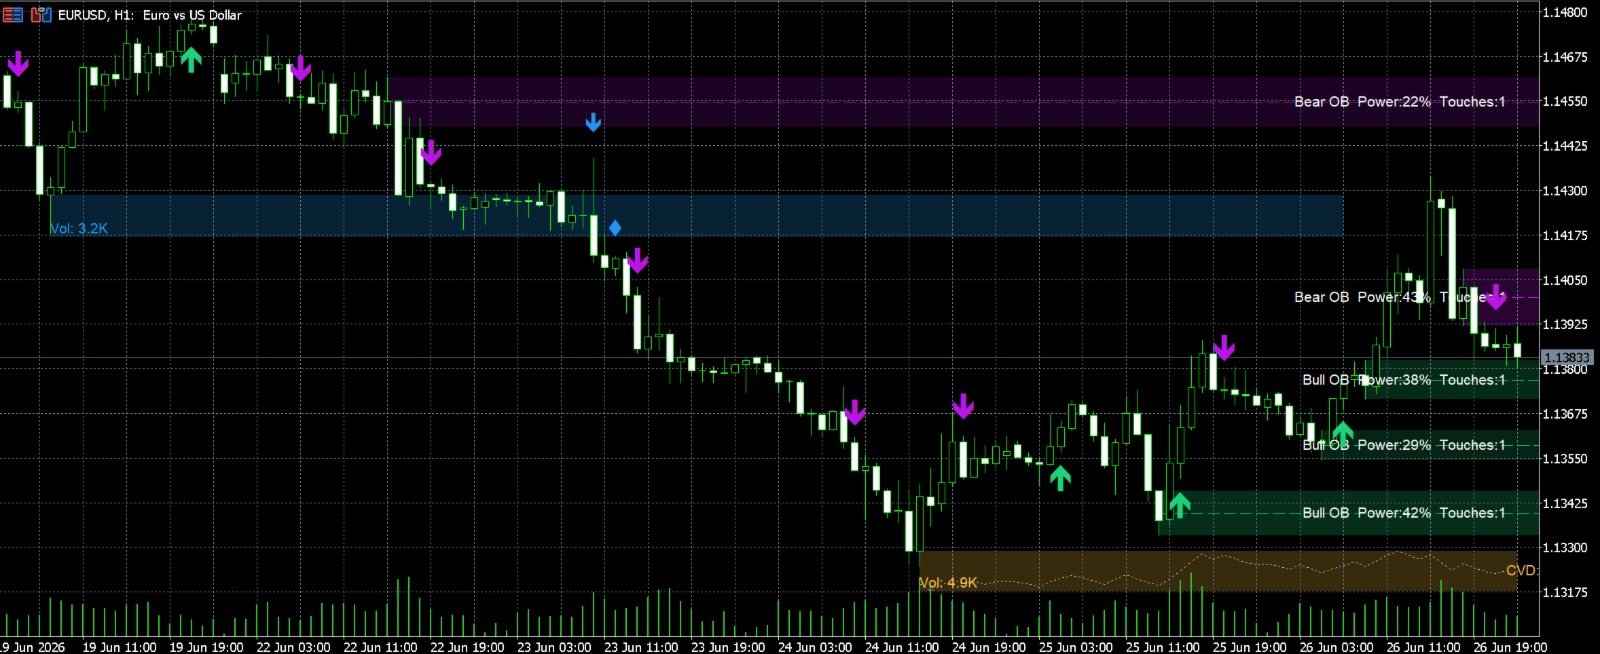
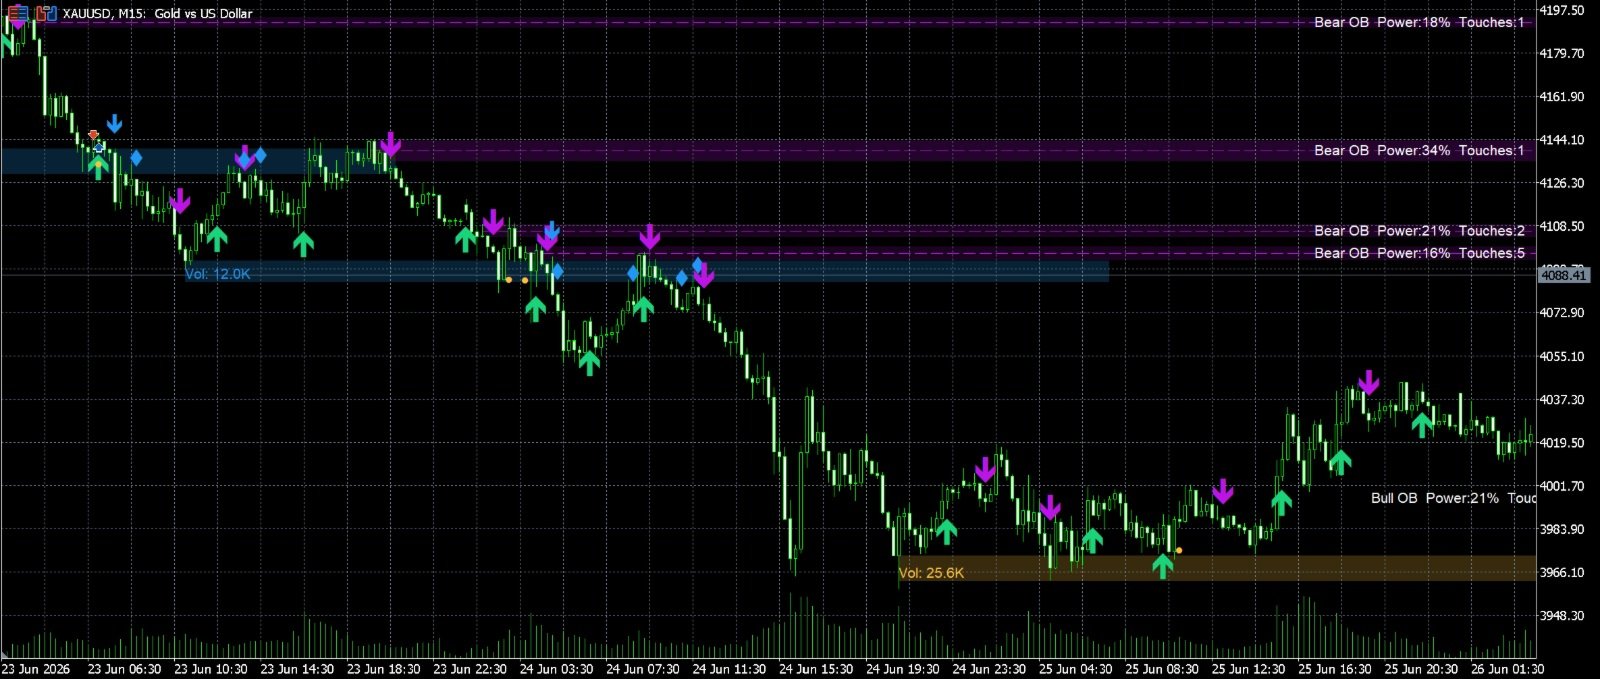
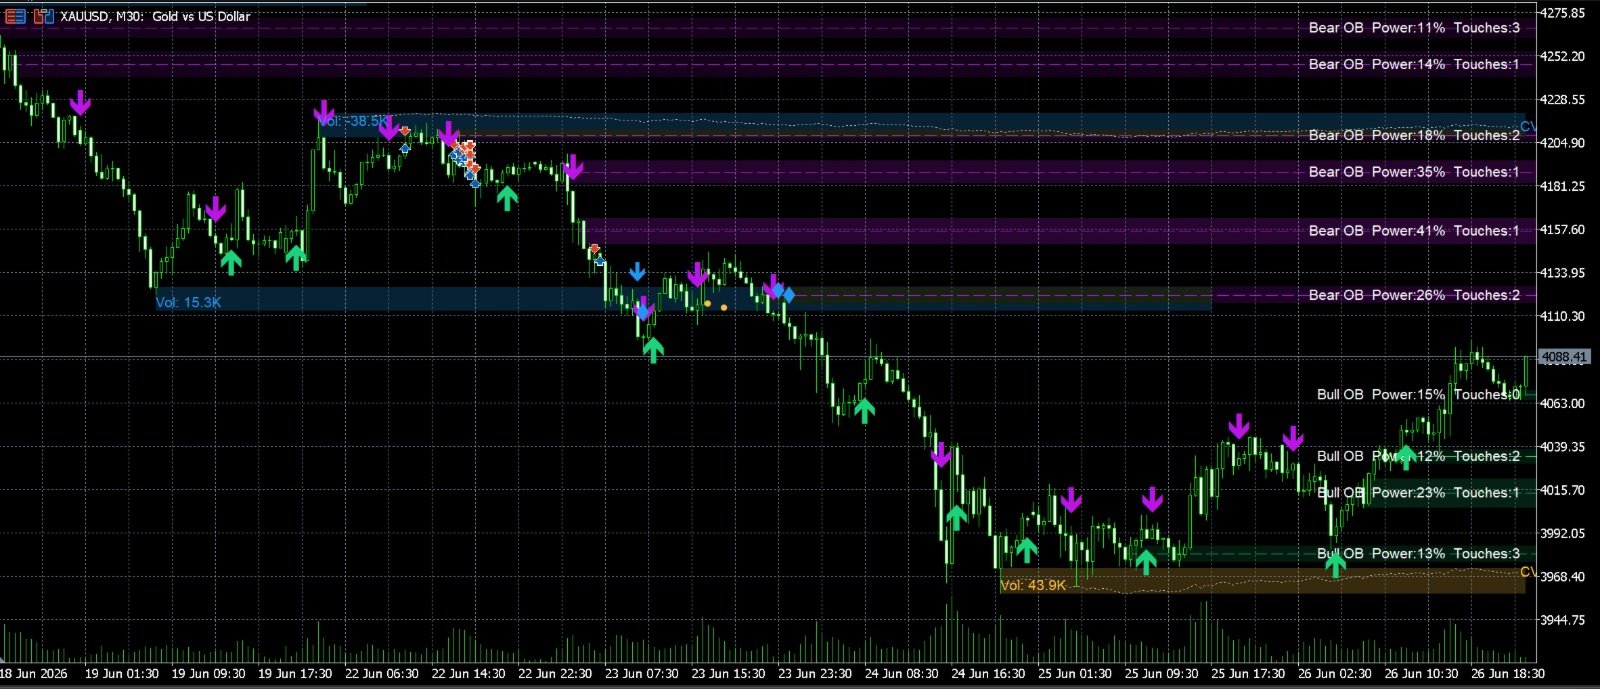
PowerBlock Pulse
PowerBlock Pulse combines three complementary price-action tools in a
single, fully configurable indicator. Each engine has its own on/off
switch, so you can run them together or on their own.
It does NOT repaint: every zone and signal is built only from closed
bars and never moves once printed. Works on every symbol and every
timeframe.
----------------------------------------------------------------
THREE ENGINES IN ONE
----------------------------------------------------------------
ENGINE 1 - POWER ORDER BLOCKS
A displacement (engulfing) candle that closes beyond the prior
candle's range marks an Order Block - the origin of an aggressive
move. Each block is:
- Ranked by a "Power %" score (its size relative to the largest
candle in the lookback window). Stronger blocks are drawn more
vividly; weaker ones fade out.
- Labelled with its Power % and a live Touches counter.
- Drawn with an optional dashed equilibrium (50%) line.
- Automatically removed once price closes through it (mitigation).
- Tagged with an arrow when price retests the zone.
ENGINE 2 - HIGH-VOLUME PIVOT SUPPORT & RESISTANCE ZONES
Structural swing highs and lows are detected as pivots and kept ONLY
when the pivot bar prints above-average volume - filtering out weak,
low-participation levels. Each validated zone shows:
- A support or resistance band anchored to the pivot candle body,
padded by ATR.
- The pivot bar's volume read-out.
- A normalized Cumulative Volume Delta (CVD) line drawn inside the
zone, so you can see whether buyers or sellers dominated while the
level was being built - the "pulse" of order flow behind each zone.
- A live CVD value label.
- Automatic colour flip when a zone is broken (resistance that
breaks becomes potential support, and vice-versa).
ENGINE 3 - SUPPLY & DEMAND ZONES
Structural swing highs build supply zones and swing lows build demand
zones, each bounded by the swing candle and padded by its average
wick. Every zone is then tracked over time:
- Retests are detected when price returns to a zone and is rejected;
breakouts when price closes cleanly through it.
- A zone that breaks can flip role (supply becomes demand, and
vice-versa), just like a real support/resistance flip.
- A stats label reports each zone's Retests, Breakouts and Held %
(how reliably it has held after being retested).
- Zones are ranked by "Strongest" (hold reliability, number of
tests and proximity to price) or simply "Nearest", and only the
top N per side are shown to keep the chart clean, with an optional
minimum spacing filter.
----------------------------------------------------------------
SIGNALS / MARKERS
----------------------------------------------------------------
- Order Block retest arrows (bullish / bearish).
- Pivot zone Breakout / Breakdown markers.
- Pivot zone "hold" and "flipped" retest markers.
- Supply & Demand zone retest markers (selectable shape) and
optional breakout markers.
- Per-zone Supply & Demand stats label: Retests, Breakouts, Held %.
----------------------------------------------------------------
HOW TO USE
----------------------------------------------------------------
PowerBlock Pulse is a decision-support / chart-analysis tool, not an
automated trading system. Common workflows:
- Look for confluence: an Order Block or Supply/Demand zone sitting
inside a high-volume Pivot zone is a higher-conviction area.
- Use the Power %, CVD and Held % read-outs to judge which levels
carry the most order flow and have held best.
- Use breakout / flip markers to track structure changes.
Always combine with your own analysis and risk management.
----------------------------------------------------------------
INPUT PARAMETERS
----------------------------------------------------------------
Module 1 - Power Order Blocks
- Enable Order Blocks module
- Displacement Multiplier (engulfing size to validate a block)
- Max blocks per side
- Power lookback (largest-candle window for the Power % score)
- Zone extension into future (bars)
- Bullish OB colour / Bearish OB colour / Text colour
- Show equilibrium (midpoint) line
- Power intensity (fade weaker blocks)
- OB info font size
- Show OB retest arrows
- Min bars between OB retest labels
Module 2 - High Volume Pivot Zones
- Enable Pivot S/R Zones module
- Resistance pivot length / Support pivot length
- Volume MA length
- Volume threshold multiplier
- Resistance colour / Support colour
- Zone fill opacity %
- Show CVD line + labels
- Show break / retest markers
- Zone text font size
- Max historical zone boxes
Module 3 - Supply & Demand Zones
- Enable Supply/Demand Zones module
- Swing period (pivot length)
- Lookback (bars to keep zones)
- Show top N zones per side
- Rank by Strongest (or Nearest)
- Min zone spacing (%)
- Retest cooldown / Hold window (bars)
- Show retest markers / breakout markers / stats label
- Retest marker shape (Circle / Triangle / Cross / Diamond)
- Supply colour / Demand colour
- Zone fill opacity % / stats font size
----------------------------------------------------------------
REQUIREMENTS & COMPATIBILITY
----------------------------------------------------------------
- Platform: MetaTrader 5.
- Symbols: all (Forex, metals, indices, crypto, stocks).
- Timeframes: all. Higher timeframes give cleaner structural zones.
- The volume filter uses tick volume, which is available on every
symbol in MetaTrader 5.
- At least ~210 bars of history are required before the volume
zones begin plotting (the ATR baseline needs to warm up).
----------------------------------------------------------------
NOTES
----------------------------------------------------------------
- Non-repainting: all drawings are based on closed bars.
- This is an indicator (analysis tool); it does not open or manage
trades and makes no claim about future performance.
----------------------------------------------------------------
DISCLAIMER
----------------------------------------------------------------
PowerBlock Pulse is a technical-analysis tool that plots zones and
markers based on historical price and volume data. It does not
predict future price movement, does not place or manage trades, and
does not guarantee any trading result.
Trading financial instruments (Forex, metals, indices, crypto,
stocks, CFDs) carries a high level of risk and may not be suitable
for all investors. Past performance, backtest results, or any
patterns shown by this indicator are not a reliable indicator of
future results. You may lose part or all of your invested capital.
Use this indicator at your own risk, together with your own
analysis, judgement, and risk management. The author accepts no
responsibility or liability for any trading losses, missed
opportunities, or other damages arising from the use, misuse, or
inability to use this product.