VolatilityRangePanel
- Indicadores
- Versão: 3.0

Volatility Range Panel MT5
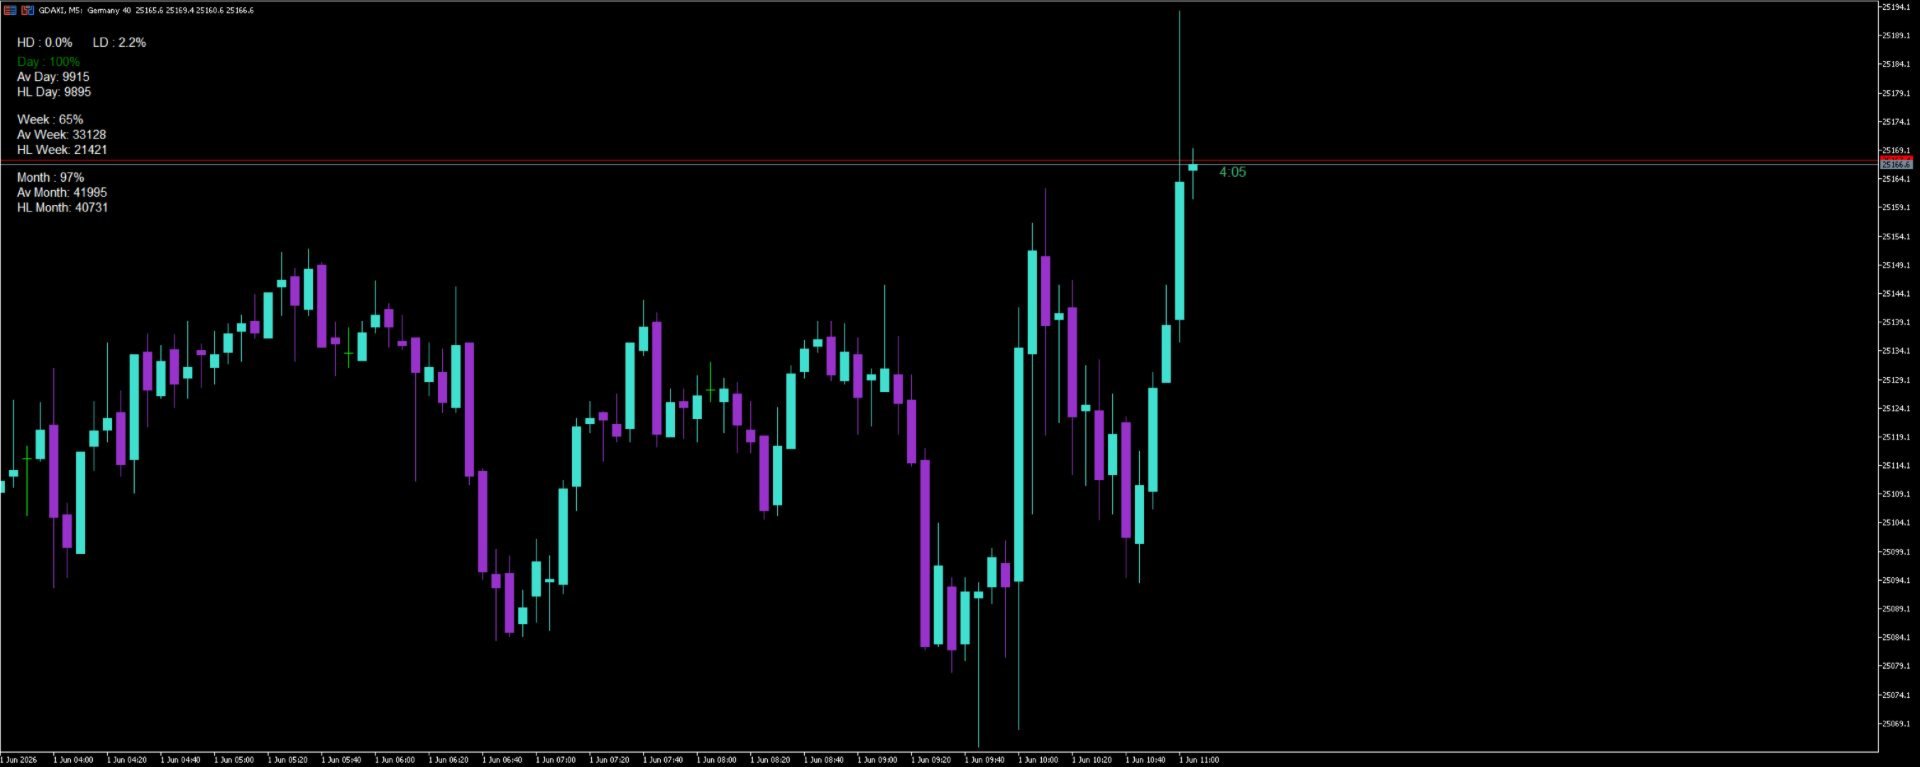
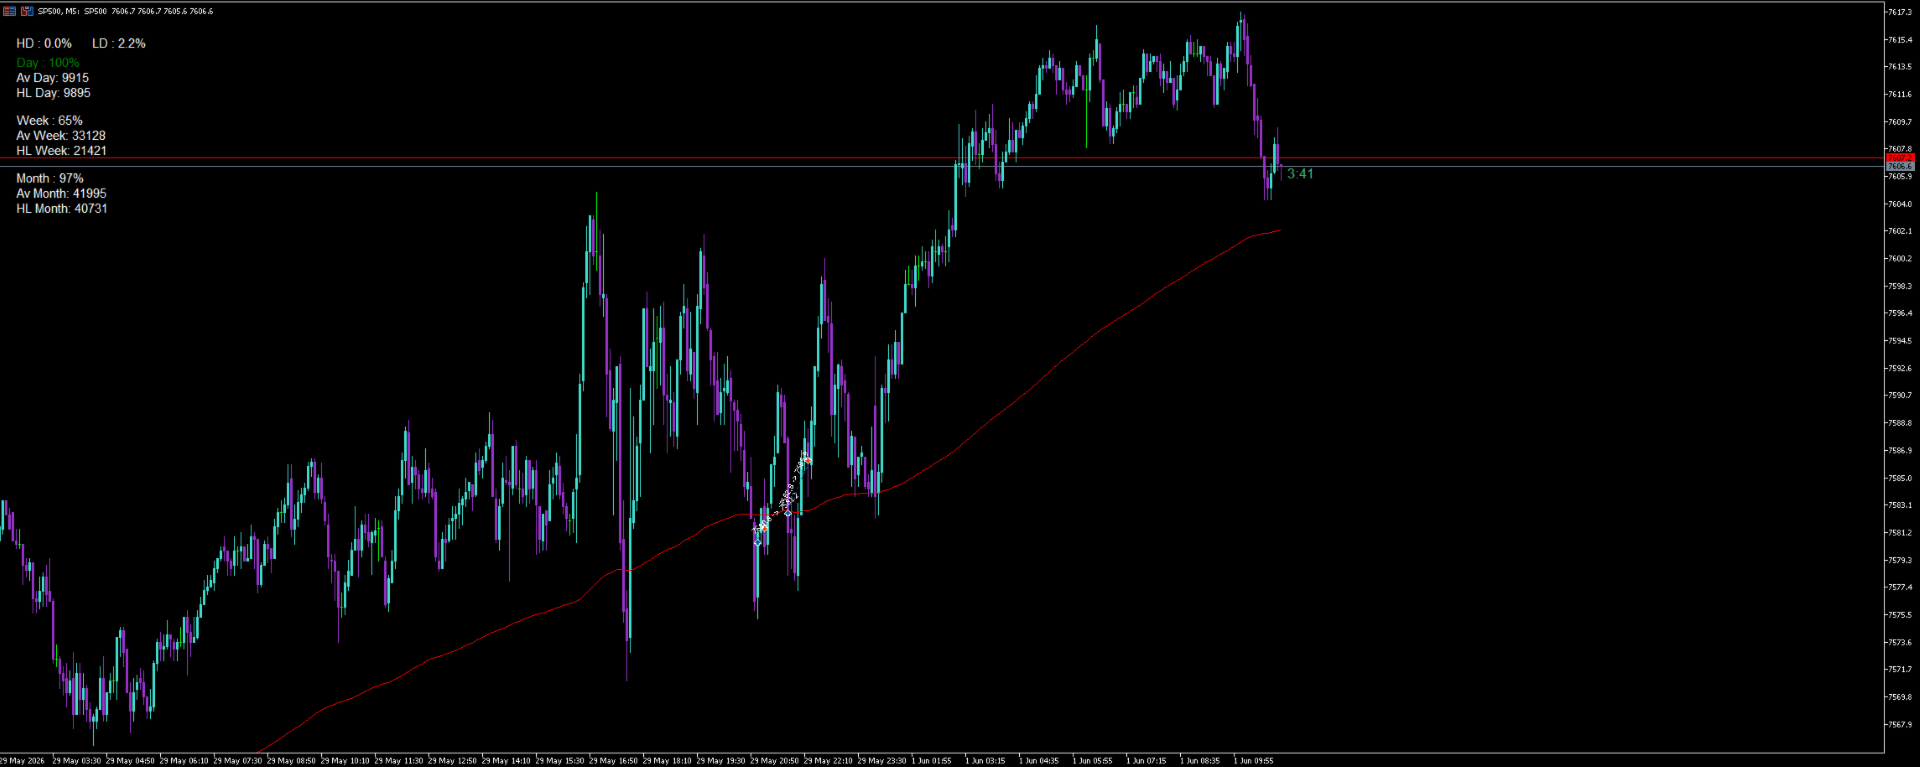
Volatility Range Panel is a powerful, lightweight, and highly visual dashboard designed to give traders an instant overview of market volatility across multiple timeframes. By tracking daily, weekly, and monthly price movements relative to historical averages, this indicator helps you avoid overextended markets and identify high-probability trading zones.
Whether you are a day trader looking for the daily average range exhaustion or a swing trader tracking weekly and monthly cycles, this panel keeps critical volatility data right on your main chart without cluttering your workspace.
Key Features
-
Multi-Timeframe Volatility Tracking: Monitors Price Range (High to Low) and compares it against historical averages for Daily (Day), Weekly (Week), and Monthly (Month) periods.
-
Percentage-Based Exhaustion Metrics: Displays the current period's range as a percentage of its historical average (e.g., 120% means the market has already moved past its average volatility).
-
HD & LD (High/Low Distribution): Displays the internal distribution percentage of the current daily candle. Know exactly where the current price sits relative to the daily High (HD) and Daily Low (LD) to easily spot top/bottom exhaustion.
-
Clean & Modern UI Background: Built with a customizable solid background box to ensure text legibility regardless of the chart background or underlying candles.
-
Fully Customizable: Easily modify average periods, panel positioning (X/Y offsets), column widths, and complete color schemes to match your personal template.
-
Maximum Performance: Highly optimized MQL5 code ensuring zero lag, smooth chart scrolling, and ultra-low CPU usage.
Understanding the Dashboard Metrics
-
HD (High Distance) / LD (Low Distance): Shows how much of the daily range is left between the current Close and the High/Low. Ideal for mean-reversion strategies.
-
Av Day / Week / Month: The true historical average range (in points) calculated over your preferred period.
-
HL Day / Week / Month: The actual current range (High minus Low) achieved so far in the active period.
Input Parameters
-
InpAvPeriod (Default: 20): Number of historical candles used to calculate the average volatility range.
-
InpXOffset / InpYOffset: Precise pixel positioning to place the dashboard anywhere on your chart.
-
InpColumnWidth: Adjusts column spacing to prevent text overlap on instruments with large digit formats (e.g., XAUUSD, Crypto, or Indices).
-
InpBgColor & InpBgOpacity: Full control over the background panel color and transparency levels.
-
Color Customization: Separate color inputs for labels, bullish metrics, and bearish metrics.