Multi Macd RD MT4

Multi-Timeframe MACD Divergence Detector

Never miss a divergence again — across 6 timeframes, all at once.

Overview

Most MACD divergence indicators on the market are either inaccurate, overly simplistic, or plagued with repaint issues. MGH-MultiMACD-RD was built to solve all of that — and go much further.

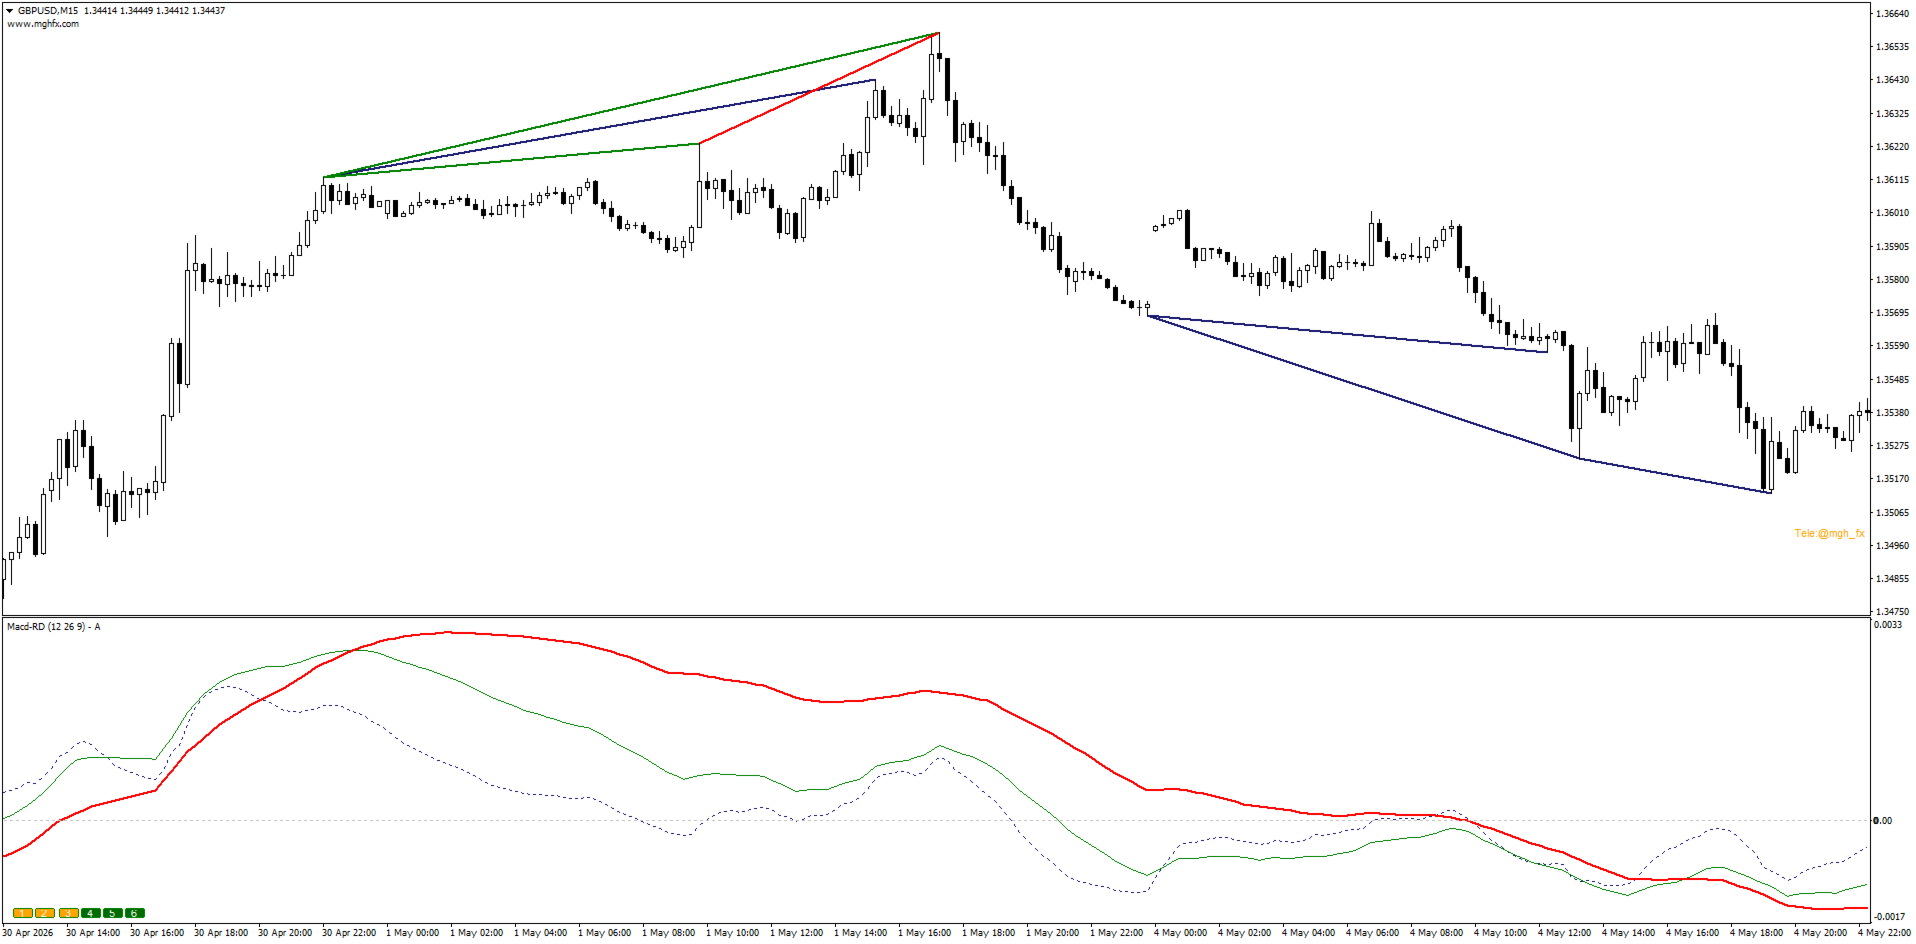
This is not just another MACD indicator. It is a multi-timeframe divergence engine that simultaneously monitors up to 6 timeframes on a single chart, detects every divergence with precision, and delivers alerts the moment they form — without repainting.

Designed by a professional trader and developer, the algorithm behind this tool is one of the most unique approaches to MACD divergence detection ever built for MetaTrader.

Why Most MACD Divergence Indicators Fail

  • They only analyze the current timeframe — missing the bigger picture.
  • They repaint signals, making backtesting unreliable and live trading dangerous.
  • They draw divergence lines inconsistently or miss valid setups entirely.
  • They offer no alert system for when you're away from the screen.

MGH-MultiMACD-RD was built specifically to eliminate every one of these problems.


Key Features

Multi-Timeframe Analysis — See the Full Picture

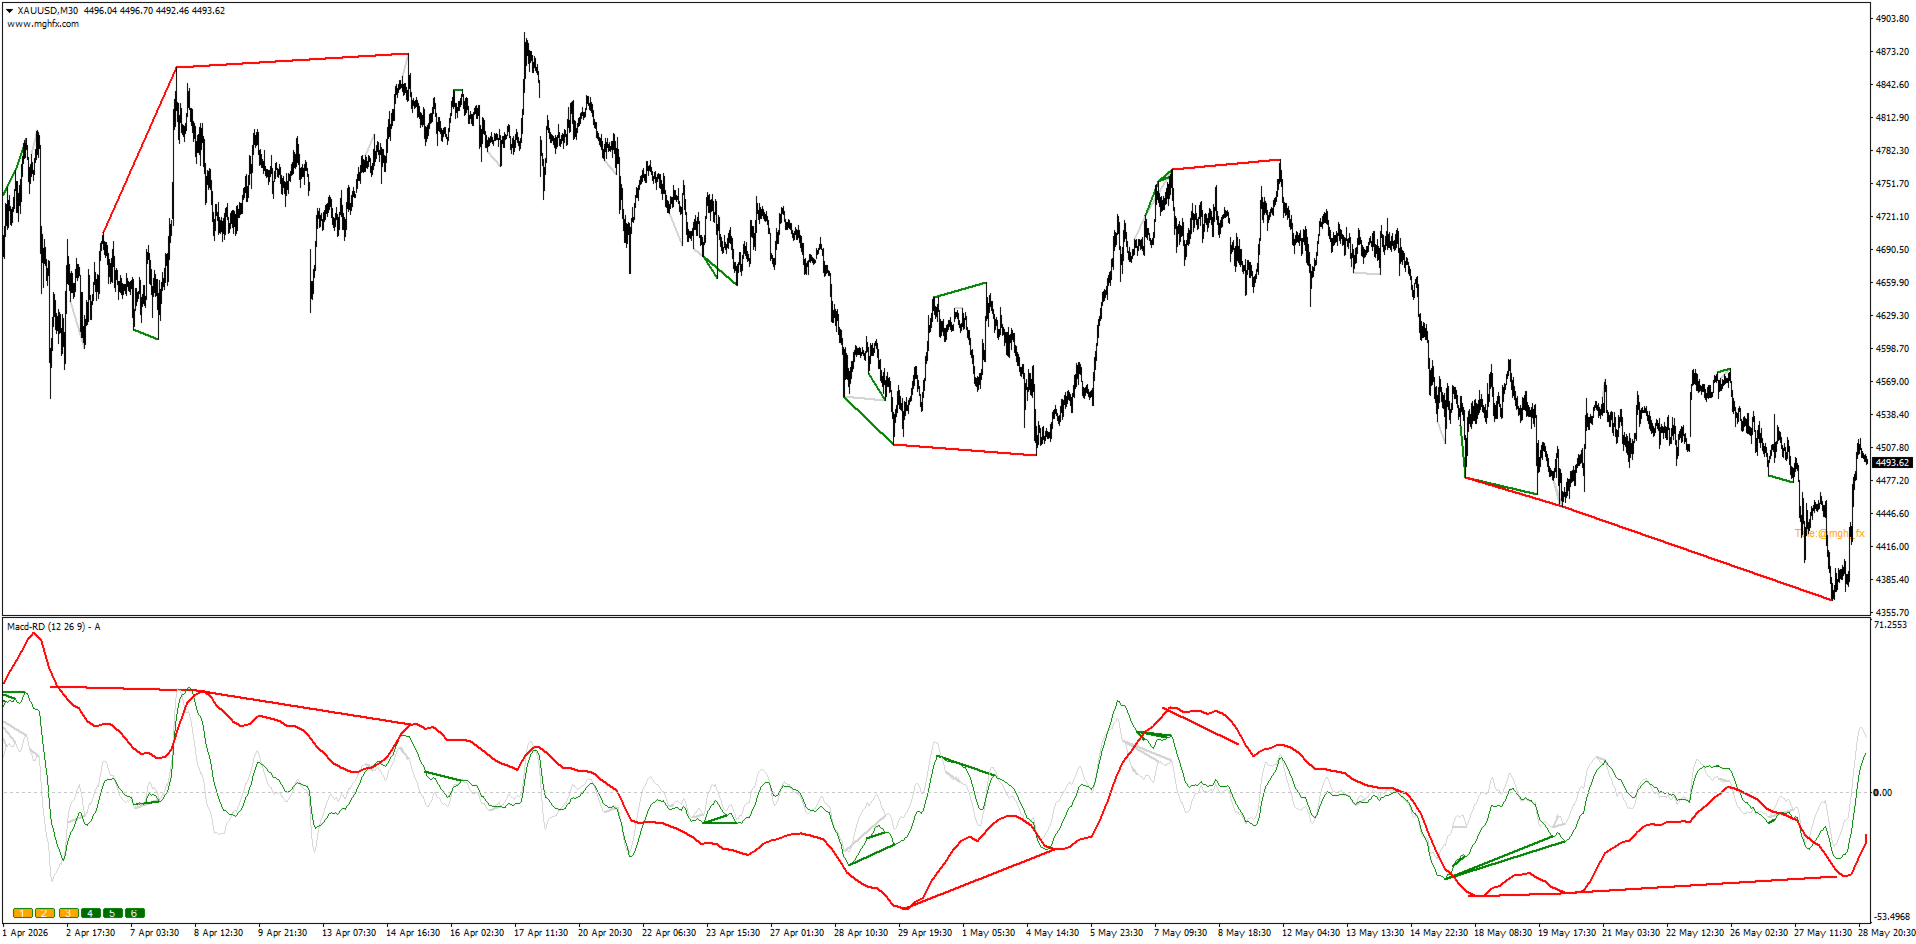
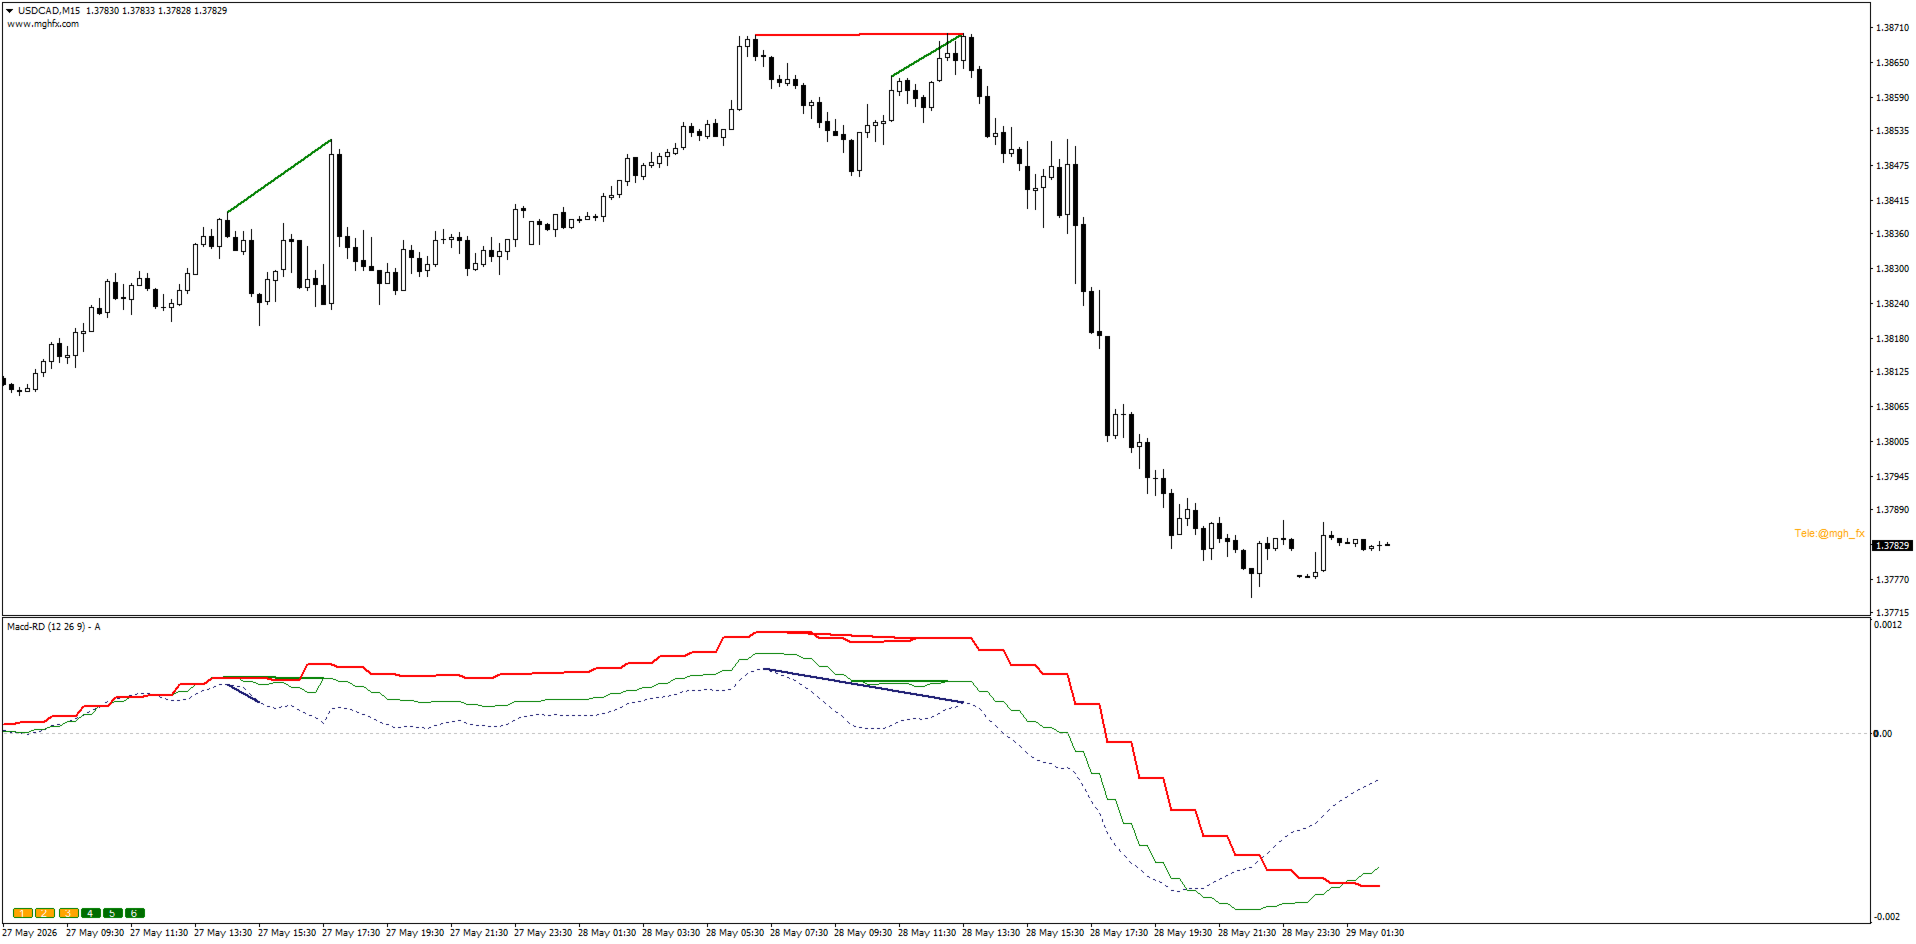
Monitor the current timeframe plus up to 5 higher timeframes simultaneously — all from a single chart window. Each timeframe's MACD is displayed with a distinct color, so you can instantly understand which timeframe is generating a signal. You can enable or disable any timeframe directly from the settings or with the on-chart buttons (1–6).

Zero Repaint — Reliable Signals You Can Trust

You choose whether signals trigger on candle 0 (faster, real-time) or candle 1 (confirmed, no repaint). When set to candle 1, you can be 100% confident that no signal will ever be redrawn or disappear after the fact.

Comprehensive Divergence Detection

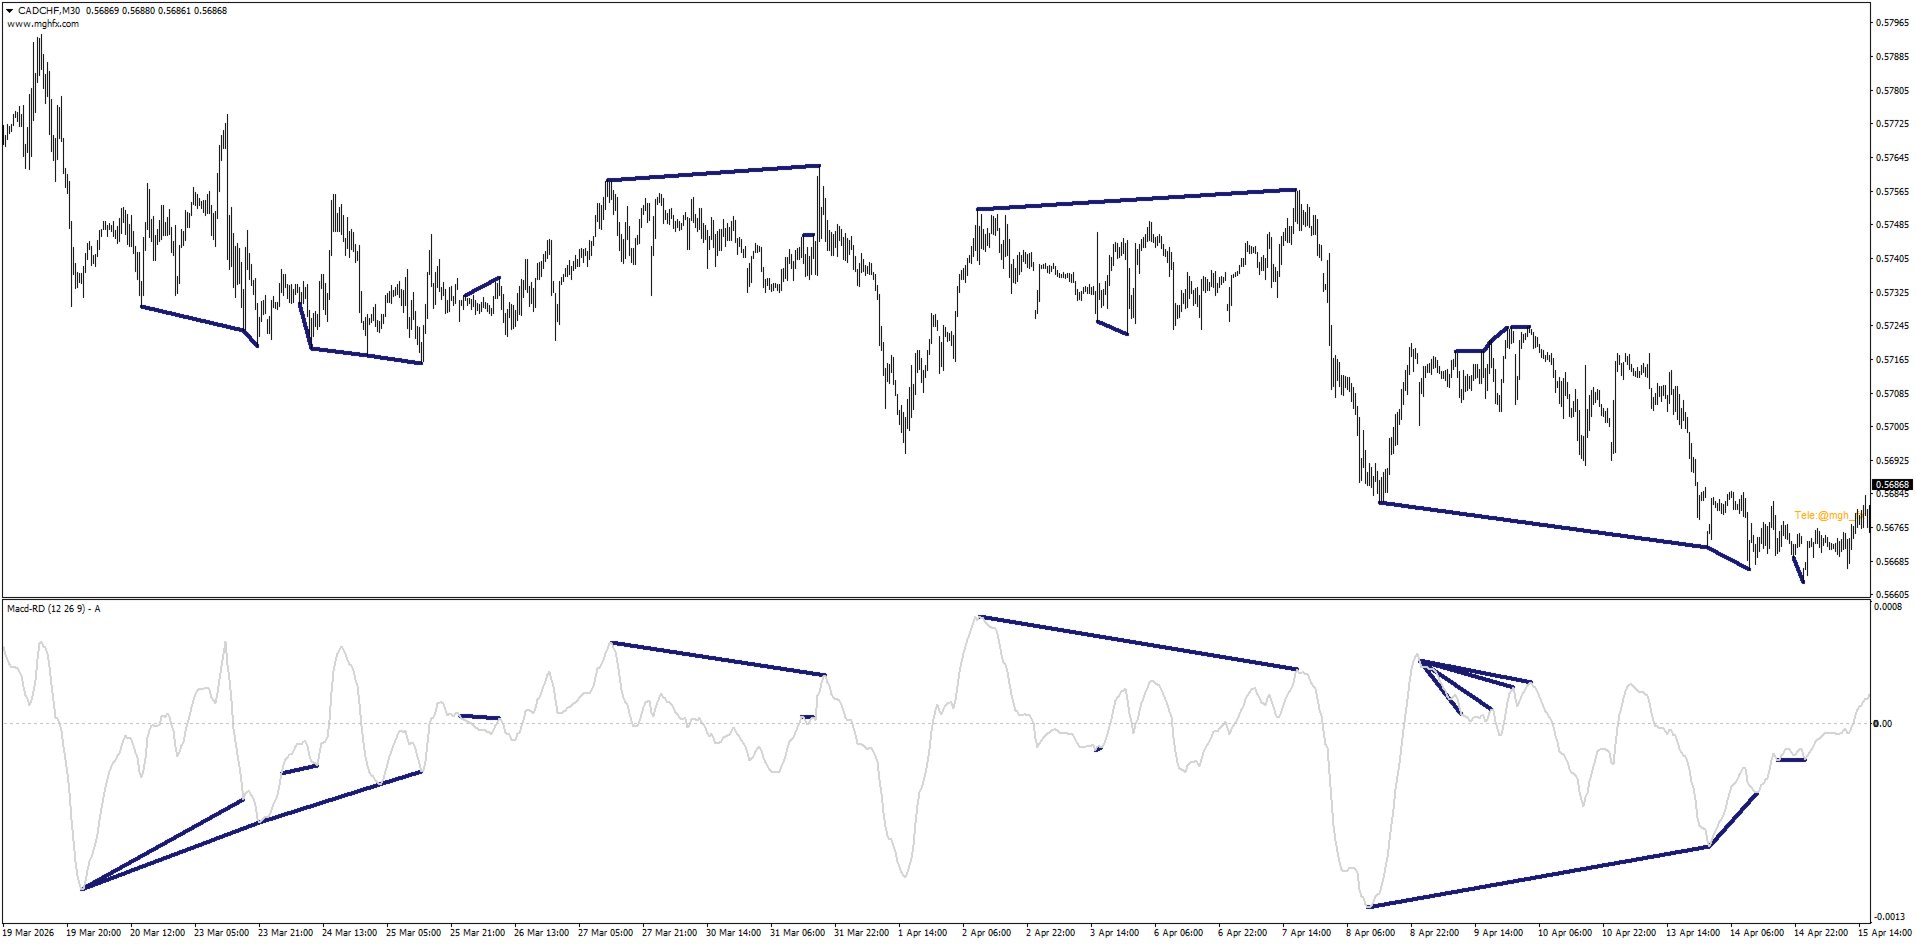
The indicator finds every valid divergence — regular and hidden — across all active timeframes. A dedicated "Increase Divergence Range" parameter allows you to extend the lookback and catch divergences between distant swing points that most other tools would miss entirely.

Multi-Divergence Confluence — The Power Signal

When two or more divergences from different timeframes occur in the same price zone simultaneously, the signal strength increases dramatically. These multi-timeframe confluence zones are where the most powerful reversals and trend changes happen. This alone can serve as a complete standalone trading strategy.


Smart Alert System

Never sit glued to your screen again. Choose from:

  • Phase change alerts — when MACD crosses zero
  • Histogram/Signal line cross alerts — real-time momentum shifts
  • Divergence alerts — the moment a divergence is confirmed
  • Sound alerts with custom .wav file support
  • Email and push notification support


Interpolation Mode

Enable the Interpolate option for visually smooth, curved MACD lines across all higher timeframes — cleaner charts, easier reading.

Full Visual Customization

  • Each timeframe has its own divergence line color (matching the MACD line color for instant association)
  • Choose to display divergence lines on the price chart, the indicator window, or both
  • Full control over line style, thickness, and color for each level
  • Logo and branding display toggleable from settings

How to Use It

  1. Attach the indicator to any chart and timeframe.
  2. Enable the timeframes you want to watch using buttons 1–6 or from the Inputs tab.
  3. Set your alert preferences — divergence, phase change, or histogram cross.
  4. Choose candle 0 or 1 depending on whether you prefer speed or confirmation.
  5. Wait for the alert — the indicator does the watching for you.

Pro Tip: Use single-timeframe divergences as confirmation for your existing strategies. When multiple timeframes show divergence simultaneously in the same zone, consider it a high-probability reversal signal.

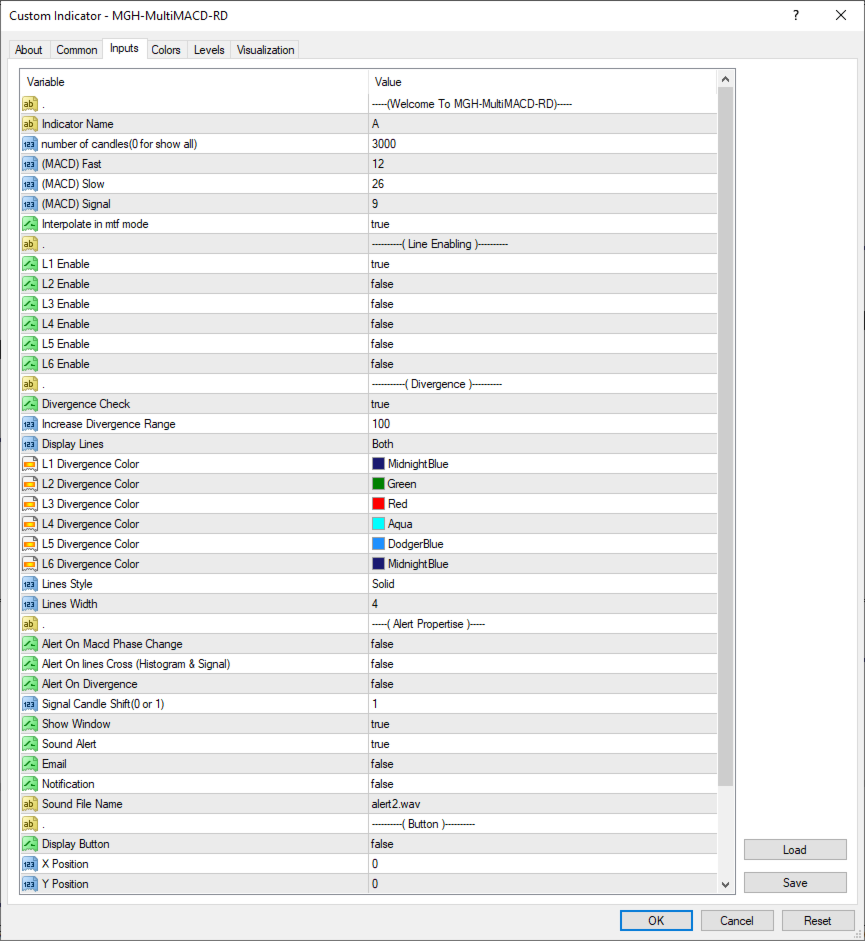
Settings Reference

Parameter Description
Indicator Name Label shown in the chart window
Number of Candles Lookback period (0 = all history)
MACD Fast / Slow / Signal Standard MACD parameters (default 12/26/9)
Interpolate in MTF Mode Smooth higher-TF MACD lines
L1–L6 Enable Enable/disable each timeframe layer
Divergence Check Enable divergence detection
Increase Divergence Range Extend lookback for distant divergences
Display Lines Show on chart, indicator window, or both
L1–L6 Divergence Color Per-timeframe divergence line color
Lines Style / Width Visual styling of divergence lines
Alert On Phase Change Alert when MACD crosses zero
Alert On Lines Cross Alert on histogram/signal cross
Alert On Divergence Alert on divergence detection
Signal Candle Shift (0 or 1) 0 = real-time, 1 = confirmed (no repaint)
Show Window Display indicator sub-window
Sound / Email / Notification Alert delivery method
Sound File Name Custom .wav sound file
Display Button Show/hide on-chart buttons
X / Y Position Button position on chart


What Makes This Different

Most indicators stop at basic divergence. MGH-MultiMACD-RD is built on a multi-dimensional approach, giving you unprecedented control and reliability across 6 timeframes simultaneously. No other indicator on MQL5 applies this level of multi-timeframe confluence.

🚀 Upcoming Advanced Filter (In Development for the Next Update): As a developer and algorithmic trading specialist, my core philosophy is that the most effective divergences—the ones that produce the absolute strongest reversal signals—occur when the new MACD peak/trough has retraced more than 50% of the previous one and is approaching the zero line.

While this current version flawlessly detects all foundational macro and micro divergences across multiple timeframes, a dedicated automated filter to explicitly isolate these "deep retracement, near-zero" setups is actively in development for the next major update.

Get in now, master the multi-timeframe engine, and secure all future advanced upgrades!


Technical Specifications

  • Platform: MetaTrader 4 / MetaTrader 5
  • Indicator Type: MACD-based divergence, multi-timeframe
  • Repaint: No (when Signal Candle Shift = 1)
  • Alerts: Sound, Email, Push Notification
  • Default MACD Settings: 12 / 26 / 9
  • Timeframes Supported: Current TF + 5 higher TFs simultaneously

Try It — Then Decide

A demo version is available. Load it on any chart, enable multiple timeframes, and watch how many divergences your current indicator has been missing. The difference is immediately visible.

If you trade divergences, this is the only indicator you will ever need.


Mais do autor
Unlock the power of "Psychological Numbers" with RoundLevel . Large financial institutions, banks, and hedge funds don't place orders at random prices; they prefer round numbers (e.g., 1.1000, 105.00, 2000). These levels act as invisible magnets for price action, serving as high-probability support and resistance zones. Key Features: Universal Compatibility: Works perfectly on Forex, Gold (XAUUSD), Indices, and Stocks. Clean Visualization: Automatically draws horizontal levels without cluttering
Persian Ichimoku: The Next Generation of Fibonacci-Enhanced Trading Elevate your Ichimoku strategy with the most advanced and customizable Ichimoku indicator on the Market. The Persian Ichimoku is not just another Ichimoku cloner; it is a professional-grade trading powerhouse designed for traders who demand precision, flexibility, and deeper market insights. By merging classic Ichimoku Kinko Hyo logic with Fibonacci ratios and the innovative Quality Line , this tool redefines trend analysis. ###
Cross Alert Pro: The Ultimate Multi-Line & Multi-Timeframe Crossover Solution Are you tired of missing critical market entries because you couldn’t monitor multiple indicators and timeframes at once? Meet Cross Alert Pro — the most comprehensive and flexible crossover notification tool designed for serious traders who demand precision and versatility. Why Cross Alert Pro? In modern trading, a simple crossover is often the spark of a massive trend. Whether it’s an Ichimoku Kumo breakout, a Moving
MGH-CrossAlert Histogram — Know the Trend Direction at a Glance What if you could see the relationship between any two lines — not just as a crossover, but as a continuous, color-coded histogram right below your chart? MGH-CrossAlert Histogram is the visual companion to the CrossAlert Cloudy indicator. Instead of watching lines on the price chart, this version gives you a dedicated sub-window histogram that tells you — bar by bar — which line is dominant, how strong that dominance is, and exact
Elevate your trading with the precision of "Big Figures." Financial markets are not driven by random numbers; they are driven by institutional liquidity. Central banks, hedge funds, and major commercial traders consolidate their orders at whole integer levels (e.g., 1.1000, 2000.00, 150.00). These are the "Psychological Magnets" where the real price action happens. RoundLevel Pro for MetaTrader 5 is a high-performance tool designed to visualize this invisible grid of institutional interest with
Persian Ichimoku Pro: The Fibonacci Evolution for MT5 Why settle for 1930s formulas when you can trade with 21st-century precision? Most traders fail with Ichimoku because they use static, outdated settings. Persian Ichimoku Pro breaks these limits by integrating Advanced Fibonacci Mathematics and the exclusive Future Quality Line —a combination never seen before in standard indicators. ### THE "UNFAIR ADVANTAGE": WHAT’S INSIDE? 1. The Quality Line (Your Trend Sentinel) This is the "Secret Sauce
MGH-CrossAlert (Cloudy Edition) — The Last Cross Alert Indicator You'll Ever Need What if every meaningful crossover on your chart came with an instant alert — no matter what lines you trade? Most cross-alert tools are built around a single idea: MA crosses MA. That's fine — until you need something more. MGH-CrossAlert was designed for traders who demand more : more flexibility, more signal types, more intelligence in how lines interact across time frames. This is not another moving average cro
MGH-CrossAlert Histogram — Know the Trend Direction at a Glance What if you could see the relationship between any two lines — not just as a crossover, but as a continuous, color-coded histogram right below your chart? MGH-CrossAlert Histogram is the visual companion to the CrossAlert Cloudy indicator. Instead of watching lines on the price chart, this version gives you a dedicated   sub-window histogram   that tells you — bar by bar — which line is dominant, how strong that dominance is, and e
Filtro:
Sem comentários
Responder ao comentário