Trend Line Index

The Trend Line Index is a multi-currency indicator that shows the strength of a currency at the moment or for any period of history data.


Description of strategy and operation principle

The indicator constantly analyzes 8 currencies or the ones that make up the 28 currency pairs.

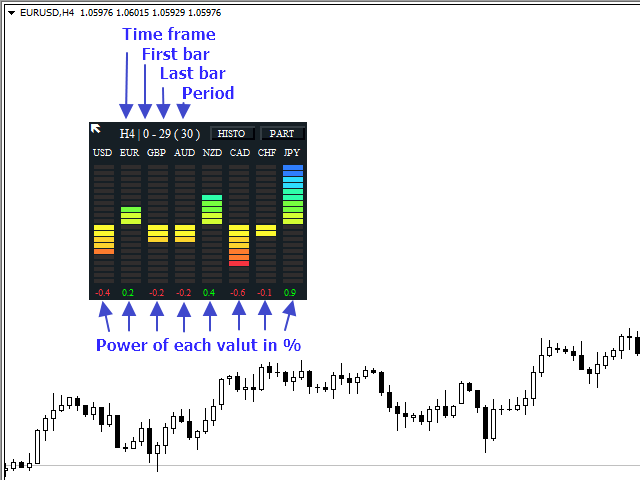
In the settings you can choose the period to analyze the movement you are interested in. To do this, select the timeframe, the number of the analyzed bars in the settings, as well as the number of the bar to start the analysis from. Thus, you can use any arbitrary period. If the initial bar for the analysis is 0, the indicator will update the data displayed on the chart in real time.

The indicator shows the average number of points passed by all currency pairs that include the specified currency. If the value is positive, then the currency has grown by an average of X points for the specified period in each pair that includes it. If the value is negative, then, respectively, the currency has lost an average of X points for the specified period. This allows to see the strength or weakness of a currency compared to other currencies. It is also possible to select indication not in points, but as a percentage of price movement.

The indicator is also able to stochastically process its data and group the currencies as rising or falling. And depending on the rise/fall value, the indicator calculates the strength percentage of the strength in the total group of strong currencies and the weakness percentage in the total group of weak currencies. In order to see the percentage in rise/fall of a specific currency pair, it is necessary to press the PART button, to switch to the initial position, press the INDEX in the indicator window.

In order to place multiple indicators on a single chart, change the Magic_Number parameter in the settings. This number is used by the indicator to distinguish its graphical objects from others.

The indicator can be placed anywhere on the screen. The initial coordinates are defined in the settings, but once the indicator is placed on the chart, you can see a diagonal arrow in its top left corner. This is the anchor. You can select it and move the indicator to any place on the screen.

It is possible to hide the histogram graph and leave only the numbers. For this purpose, there is the Show bar chart variable in the settings or the HISTO button in the indicator chart.

The indicator updates its data on every tick, as well as by timer. The update interval can be set in the Interval variable.

There are 2 options to display the currency strength chart. Defined by the Mode histo variable. by_scale - chart scaling, centered - center alignment.‌‌


Description of the indicator settings

  • Work time frame - timeframe for the analysis.
  • Mode calculation - calculation method of currency movement. (in points or in percents)
  • Bar number - the number of bars to analyze the currency movement.
  • First bar - the number of the first bar to analyze the currency movement.
  • Magic number - identification number of the indicator. Designed for placing multiple instances of the indicator on the chart. For each new instance of the indicator on one chart set any number different from the others.
  • Digits in percent - the number of decimal places, for calculation of currency movement as a percentage.
  • Interval in mlsec - update interval of the indicator data in milliseconds.
  • Symbol 1 - currency for analysis №1.
  • Symbol 2 - currency for analysis №2.
  • Symbol 3 - currency for analysis №3.
  • Symbol 4 - currency for analysis №4.
  • Symbol 5 - currency for analysis №5.
  • Symbol 6 - currency for analysis №6.
  • Symbol 7 - currency for analysis №7.
  • Symbol 8 - currency for analysis №8.
  • Prefix - if your broker uses a prefix in the names of trading instruments, enter it here. Example: if the symbol is "mEURUSD", then enter "m" into this parameter.
  • Suffix - if your broker uses a suffix in the names of trading instruments, enter it here. Example: if the symbol is "EURUSDm", then enter "m" into this parameter.
  • X coordinate - horizontal coordinate of the top left point of the indicator from the top left point of the chart.
  • Y coordinate - vertical coordinate of the top left point of the indicator from the top left point of the chart.
  • Show bar chart - show the histogram or only the numeric values of currency movements.
  • Color background - background color.
  • Color text - text color.
  • Color positive - color of the positive value of currency movement.
  • Color negative - color of the negative value of currency movement.
Produtos recomendados
The Multicurrency Trend Detector ( MTD ) indicator allows you to immediately and on one chart on a selected time interval (extending from a zero bar to a bar set in the settings by the value horizon) determine the presence, direction and strength of trends in all major currencies, as well as assess the reliability of these trends.               This is achieved by calculating indices (non-relative purchasing power) of eight major currencies, namely: AUD, CAD, CHF, EUR, GBP, JPY, NZ
Overview Harmonic Patterns MT4 is a technical analysis indicator designed for the MetaTrader 5 platform. It identifies and displays harmonic price patterns, such as Butterfly, Cypher, Crab, Bat, Shark, and Gartley, in both bullish and bearish directions. The indicator calculates key price levels, including entry, stop loss, and three take-profit levels, to assist traders in analyzing market movements. Visual elements and customizable alerts enhance usability on the chart. Features Detects six ha
HTF Candle Plus Timer Upgrade your trading experience with HTF Candle Plus Timer, a smart indicator that displays higher timeframe candles directly on your current chart. It allows you to stay aligned with the bigger market picture while focusing on your preferred trading timeframe. Key Features: Higher Timeframe Candles Plot custom higher timeframe (HTF) candles such as H1, H4, D1, W1, or MN directly on lower timeframe charts for a clearer market overview. Current Candle Timer A live countdown
The UNIVERSAL DASHBOARD indicator will eliminate the need of using dozens of indicators on dozens of charts. From one place you can monitor all the pairs and all the timeframes for each of the following indicators: MACD STOCHASTIC WPR RSI CCI You can also use any Custom indicator in the dashboard as long as it has a readable buffer. With a single click you can quickly navigate between charts, pairs and timeframes. Alerts will provide clear indication about what happens for your favorite pairs on
FREE
Versus USD MT4
Vonjinirina Alfred Randrianiaina
Versus USD calcula a variação de preço de cada uma das principais moedas em relação ao USD e exibe uma visão clara e comparativa do seu desempenho para cada período ou barra indexada pelo cursor no Timeframe atual do gráfico com barras de progresso . Adicionalmente, marca uma seta na barra/período em que a moeda em questão experimentou a taxa de mudança mais alta ou baixa em relação ao USD comparada com outras moedas, fornecendo assim uma medida mais precisa do desempenho da moeda. O Dólar Ameri
The " Multi Kernel Regression " is a versatile trading indicator that provides graphical interpretations of market trends by using different kernel regression methods. It's beneficial because it smoothes out price data, creating a clearer picture of price movements, and can be tailored according to the user's preference with various options. What makes this indicator uniquely versatile is the 'Kernel Select' feature, which allows you to choose from a variety of regression kernel types, such as
FREE
Descubra uma abordagem revolucionária para a negociação com o Indicador Shepherd Numerology Levels. Esta ferramenta inovadora combina a antiga sabedoria da numerologia com técnicas de negociação de ponta para ajudá-lo a identificar níveis-chave de suporte e resistência em seus gráficos. Ao usar o poder do método Quadrado de Nove, este indicador oferece uma perspectiva única sobre a dinâmica do mercado, permitindo que você tome decisões de negociação mais informadas. Características Principais e
## Multi-Timeframe RSI Trend Dashboard Pro Multi-Timeframe RSI Trend Dashboard Pro is an advanced graphical utility designed for MetaTrader 4 that condenses market momentum across multiple timeframes into a single, clean, and interactive visual panel.  Instead of cluttering your screen with dozens of open charts, this professional dashboard continuously monitors the Relative Strength Index (RSI) for the M15, H1, and D1 timeframes simultaneously, giving you an instant bird's-eye view of global
Smart Trend Forecasting Slope-Based Trend Analysis Indicator with Alert Support Overview Smart Trend Forecasting is a slope-based trend analysis indicator derived from a classic moving average trend model originally developed by Wizard Serg and referenced in Forex Magazine #104. The indicator is designed to monitor: Trend direction Momentum shifts Trend transition conditions Moving average slope behavior It includes visual markers and configurable alert notifications for trend state changes. Ma
PABT Pattern Indicator - it's classical system one of the signal patterns. Indicator logic - the Hi & Lo of the bar is fully within the range of the preceding bar, look to trade them as pullback in trend. In the way if indicator found PABT pattern it's drawing two lines and arrow what showing trend way.  - First line - it's entry point and drawing at: 1. On the high of signal bar or on middle of the signal bar (depending from indicator mode) for buy; 2. On the low of signal bar or on middle of t
O painel de alerta RSI / TDI permite monitorar RSIs de uma só vez (selecionável por você) em todos os principais pares que você negocia. Você pode usá-lo de duas maneiras: 1. Selecione vários prazos e o traço mostrará quando houver vários prazos estendidos além das condições normais de negociação. Um ótimo indicador de que o preço aumentou muito recentemente, pois atingiu um nível de sobrecompra ou sobrevenda em vários prazos, de modo que uma retração ou reversão deve ocorrer em breve. 2. U
Monitore todos os símbolos e todos os períodos gráficos com seus indicadores favoritos a partir de um único gráfico. O Ultimate Indicator Dashboard oferece uma visão completa de múltiplos símbolos, múltiplos indicadores e múltiplos períodos gráficos — tudo em um painel limpo e arrastável. Pare de ficar alternando entre gráficos. Veja RSI, MACD, Bollinger Bands, Ichimoku, ATR, volume e muito mais em todos os seus instrumentos de uma vez. Sinais com código de cores mostram exatamente onde estão as
Rsi Aligator
Dmitriy Konogorov
The indicator do have inside two a tehnical its "RSI" and "Aligator" indicators with histogram for technical analysis of the market, currencies, currency pairs, precious metals and oil, and you can also analyze various cryptocurrencies such as Bitcoin and Ethereum. The indicator analyzes quotes and, based on their data, displays its icons on the chart for trading analysis. The indicator works very well, does not freeze and does not slow down even a weak processor in the computer, and is also no
Rung
Iurii Tokman
Rung   Indicador de tendência. O indicador identifica e marca em cores diferentes as principais tendências do movimento dos preços, ao mesmo tempo que elimina e não reage ao ruído e aos movimentos dos preços de curto prazo contra a tendência principal. O indicador é uma ferramenta que determina a tendência atual do mercado. Com as configurações padrão, uma tendência de alta ("tendência de alta"), o indicador marca com uma linha verde, uma tendência de baixa ("tendência de baixa") - com uma linha
FREE
Mean Reversion Probability indicator is a tool based on a mathematical theory of mean reversion . As the markets very often shows the behavior of diverging from its mean, up to a certain distance, and then start to converge its mean again. This is a very well known phenomenon in stochastic processes and the price series is also a stochastic variable so we apply certain mathematical and statistical procedures to estimate the turning point . Using Mean Reversion indicator, traders could potentiall
Forex Gump
Andrey Kozak
2.4 (5)
Forex Gump is a fully finished semi-automatic trading system. In the form of arrows, signals are displayed on the screen for opening and closing deals. All you need is to follow the instructions of the indicator. When the indicator shows a blue arrow, you need to open a buy order. When the indicator shows a red arrow, you need to open a sell order. Close orders when the indicator draws a yellow cross. In order to get the most effective result, we recommend using the timeframes H1, H4, D1. There
Rira Renko
Vitor Palmeira Abbehusen
RENKO on Time Chart This indicator is an enhanced Renko, so you can watch the Renko bricks on the chart to understand price movement more clearly the other improvement is automated box size according to ATR (Average True Range) period you can set the ATR number as you want and the box size of Renko changes automatically based on price movement Inputs Mode: Box size is the input to specify the size of the Renko box you want to print on the chart. This input lets you choose the fixed box siz
O indicador de MTF Qristalium Arrows é semi-acabados, sistema de negociação. Funciona em todos os pares de moedas. No indicador envolvidos em três regras: 1)o comércio é apenas uma tendência, 2)"da compra, quando tudo o que vender e vender, quando todo mundo está comprando", 3) o Preço sempre vai contra a multidão.  O indicador de MTF Qristalium Arrows filtra os dados da regra de vários таймфреймам com a ajuda de indicadores internos. Com a coincidência de tendência em determinados cortes t
O indicador Multiple MA MAP (Mapa de Médias Móveis Múltiplas) não se limita a desenhar linhas; funciona como um painel estratégico para visualizar tendências em múltiplos períodos de tempo de forma rápida e prática. Se antes precisava de utilizar três, quatro ou seis monitores para acompanhar as tendências durante as suas negociações, agora pode visualizar as tendências em múltiplos períodos de tempo de forma rápida e prática num único ecrã. Dominar as médias móveis por si só já permite operar
UT BOT Simple MT4
Bartlomiej Tadeusz Tomaja
**Features:** 1. **Innovative Trend Tracking:** The UT BOT Simple Indicator leverages the power of the Average True Range (ATR), a renowned volatility measure, to calculate precise trailing stop values, providing unparalleled insights into market trends. 2. **Customizable Settings:** Flexibility is paramount in any trading strategy. With this in mind, our indicator allows you to adjust the ATR periods and other key parameters to tailor the tool to your trading style and strategy. 3. **Real-t
This is an arrow indicator without a future function,developed based on the most advanced profit trading algorithms.It has the most innovative and advanced dual trend analysis module, as well as the latest and highly effective market trend prediction algorithm.Trends are your friends, and following larger trends can earn the maximum profit in foreign exchange. This indicator helps traders identify current trends and track them. Someone once made a profit of 10 times in a week by relying on it.No
Market Trend Strength Heatmap  Smart Structure Heatmap is a multi-timeframe trend analysis indicator designed to help traders quickly identify market direction and overall trend strength based on real time. The indicator combines several technical filters into a simple heatmap dashboard, allowing traders to view trend conditions across multiple timeframes in one place. Trend direction is displayed using color signals: Green Uptrend (buy) Red Downtrend (sell) Yellow Sideways  S
Ultimax Dashboard
AURELIE HAI-SIEU SOUKANH
Complete newbie Trader Guide  Ultimax Dashboard! Everything you need to know to read the dashboard and make confident trading decisions even as a complete beginner. Features: Pair Scanner LWMA Trends Confluence Score RSI ADR% Market Sessions Currency Strength Smart Alert Overview What does Ultimax actually do? Ultimax is a single-screen command centre for forex trading. Instead of juggling 10 separate indicators across multiple charts, everything you need to evaluate a trade is right in fron
Power Renko is an indicator which plots Renko bricks underneath the chart using a histogram. You can select the brick size and the timeframe of the Renko bricks as well as whether or not to use the close price or the high/low price of the candles. Renko bricks are based on price alone, not time, therefor the Renko bricks will not be aligned with the chart's time. They are extremely useful for trend trading and many different strategies can be formed from them. Buffers are provided allowing you t
Robot scalper for M5 timeframe. Trades on the GBPUSD currency pair. This robot has been specially developed by a company of professional traders for trading in the pound sterling. The robot approximately opens 5 to 15 trades every day. It is best to trade with brokers that have a low spread on GBPUSD up to 10 pips. The recommended minimum deposit to start is $500 or more. Advantages: does not use martingale. not a net. every trade has a stop loss. professional bot specifically for the GBPUSD p
Show Swap
Yuriy Yepifanov
showSwap is a simple indicator. shows SWAP on the instrument chart for this instrument. You can specify the magic of the instrument, if 0, then that’s it. as well as the coordinates of the indicator panel on the chart. In forex trading, SWAPs can be either positive or negative depending on the interest rate differential between the two currencies involved in the trade. Traders may either receive or pay SWAPs depending on whether they are holding a position past a certain time (usually at the end
FREE
Ultimate ADX Multi-timeframe Indicator This indicator provides real-time ADX values for multiple timeframes in one unobtrusive label panel. It i s especially useful for gauging trend strength across timeframes without constantly switching charts. Choose which periods to display, anchor the panel to any chart corner, and color-code ADX strength levels to your taste. Key Features & Personalization Multi-Timeframe ADX - Toggle visibility for 9 built-in periods (M1, M5, M15, M30, H1, H4, D1, W1, MN1
FREE
The Stochastic Oscillator is a momentum indicator that uses support and resistance levels. The term "stochastic" refers to the point of a current price in relation to its price range over a period of time. You can use a New Stochastic in the same way as classical one: Overbought and Oversold areas to make a Buy or Sell orders. This new indicator shows all variety of Fibonacci Levels (from 23.6 to 76.4) which can be used as Overbought and Oversold levels as well as points to close an open positio
Este indicador irá detectar padrões harmônicos desenhados no gráfico através de métodos manuais e automáticos. Adicione a sua avaliação, por favor. Notas: O indicador possui um painel de controle e salvará cada configuração (gráfico e período de tempo). Você pode minimizá-lo para ter mais espaço no gráfico e pode pressionar o botão de fechar para ocultar todos os dados do indicador no gráfico, caso prefira trabalhar com outras ferramentas de análise. Quando você usar esse indicador e alterar as
Lyne
Maksim Kalachev
About the Lyne indicator Lyne is a Metatrader 4 (MT4) indicator, the essence of which is to transform the accumulated historical data. The Lyne indicator makes it possible to detect various features and patterns in price dynamics that are invisible to the naked eye. Based on this information, traders can anticipate further price movement and adjust their strategy accordingly. This indicator has proven itself in the scalping strategy. The indicator works without repainting.
Os compradores deste produto também adquirem
Neuro Poseidon MT4
Daria Rezueva
4.94 (35)
Neuro Poseidon is a new indicator by Daria Rezueva. It combines precise trading signals with adaptive TP/SL levels - creating best possible trades as a result! Message me and get  Neuro Poseidon Assistant  as a gift to automize your trading process! What makes it stand out? 1. Proven profitability on all assets and timeframes 2. Only confirmed BUY and SELL signals present on the chart 3. Adaptive TP & SL levels generated by the software for each trade 4. Easy to understand - suitable for all
Gann Made Easy
Oleg Rodin
4.84 (165)
Gann Made Easy é um sistema de negociação Forex profissional e fácil de usar, baseado nos melhores princípios de negociação usando a teoria do sr. W. D. Gann. O indicador fornece sinais precisos de COMPRA e VENDA, incluindo níveis de Stop Loss e Take Profit. Você pode negociar mesmo em movimento usando notificações PUSH. Entre em contato comigo após a compra para receber instruções de negociação e ótimos indicadores extras gratuitamente! Provavelmente você já ouviu muitas vezes sobre os métodos
M1 Sniper
Oleg Rodin
5 (24)
O M1 SNIPER é um sistema indicador de negociação fácil de usar. É um indicador de seta projetado para o período M1. O indicador pode ser usado como um sistema independente para scalping no período M1 e pode ser usado como parte do seu sistema de negociação existente. Embora este sistema de negociação tenha sido projetado especificamente para negociação no M1, ele também pode ser usado em outros períodos. Originalmente, desenvolvi este método para negociar XAUUSD e BTCUSD. Mas considero-o útil ta
Trend Catcher ind
Ramil Minniakhmetov
5 (2)
INDICADOR TREND CATCHER O Indicador Trend Catcher analisa os movimentos de preços do mercado, utilizando uma combinação de indicadores de análise de tendências adaptativos, proprietários e personalizados pelo autor. Identifica a verdadeira direção do mercado, filtrando o ruído de curto prazo e focando a força do momentum subjacente, a expansão da volatilidade e o comportamento da estrutura de preços. Utiliza também uma combinação de indicadores personalizados de suavização e filtragem de tendê
Este indicador é um indicador para análise automática de ondas que é perfeito para negociações práticas! Caso... Nota:   Não estou acostumado a usar nomes ocidentais para classificação de ondas. Devido à influência da convenção de nomenclatura de Tang Lun (Tang Zhong Shuo Zen), nomeei a onda básica como   uma caneta   e a banda de onda secundária como   um segmento   . ao mesmo tempo, o segmento tem a direção da tendência.   O segmento de tendência principal   é nomeado (esse método de nomencl
Scalper Inside PRO
Alexey Minkov
4.74 (68)
Scalper Inside PRO Scalper Inside PRO is an intraday trend and scalping indicator for MetaTrader 4 that uses an exclusive algorithm to quickly detect market direction and key target levels. It automatically calculates entry, exit and multiple profit targets, and shows detailed performance statistics so you can see how different instruments and strategies performed. This helps you choose the most suitable trading instruments for the current market conditions. Additionally, you can easily integrat
Breakout Arrows Mt4
Michael Oko Oboh
5 (1)
Trend Breakout Arrows Indicator The Trend Breakout Arrows Indicator is a momentum-based signal tool designed to identify potential bullish and bearish breakout opportunities. It displays clear arrow signals directly on the price chart, helping traders quickly recognize possible trend changes and continuation setups. Up Arrow (Buy Signal) A magenta up arrow appears below a candle when bullish momentum begins to strengthen. This signal indicates that buying pressure may be overtaking selling press
O sistema PRO Renko é um sistema de negociação altamente preciso especialmente concebido para a negociação de gráficos RENKO. Trata-se de um sistema universal que pode ser aplicado a vários instrumentos de negociação. O sistema neutraliza eficazmente o chamado ruído de mercado, dando-lhe acesso a sinais de inversão precisos. O indicador é muito fácil de usar e tem apenas um parâmetro responsável pela geração de sinal. Você pode facilmente adaptar a ferramenta a qualquer instrumento de negocia
Current event:  https://c.mql5.com/1/326/A2SR2025_NoMusic.gif A. O que é A2SR ?   * É um indicador técnico importante (sem repintura, sem atraso). -- Orientação : -- em https://www.mql5.com/en/blogs/post/734748/page4#comment_16532516 -- e https://www.mql5.com/en/users/yohana/blog A2SR tem uma técnica especial para determinar os níveis de Suporte (demanda) e Resistência (oferta). Ao contrário da maneira comum que vimos na rede, o A2SR tem um conceito original na determinação dos níveis reais
Advanced Supply Demand
Bernhard Schweigert
4.91 (300)
Atualmente com 30% de desconto! A melhor solução para qualquer Trader Novato ou especialista! Este indicador é uma ferramenta de negociação exclusiva, de alta qualidade e acessível porque incorporamos uma série de recursos proprietários e uma nova fórmula. Com esta atualização, você poderá mostrar fusos horários duplos. Você não só será capaz de mostrar um TF mais alto, mas também mostrar ambos, o TF do gráfico, MAIS o TF mais alto: MOSTRANDO ZONAS ANINHADAS. Todos os traders de Oferta e Demanda
MetaBands M4
Vahidreza Heidar Gholami
3.5 (6)
MetaBands utiliza algoritmos poderosos e únicos para desenhar canais e detectar tendências, a fim de fornecer aos traders pontos potenciais para entrar e sair de negociações. É um indicador de canal mais um indicador de tendência poderoso. Inclui diferentes tipos de canais que podem ser mesclados para criar novos canais simplesmente usando os parâmetros de entrada. O MetaBands usa todos os tipos de alertas para notificar os usuários sobre eventos de mercado. Recursos Suporta a maioria dos algori
Genesis Matrix Pro is a professional multi-timeframe trend detection indicator designed to help traders identify high-quality market alignment with clarity and structure. It combines 12 different technical indicators into one visual alignment matrix, allowing traders to quickly see when market conditions are bullish, bearish, or neutral. A signal is generated only when the selected strategies are aligned, helping reduce noise and improve decision-making. PLEASE CONTACT ME AFTER PURCHASE TO GET
Este produto foi atualizado para o mercado de 2026 e otimizado para as versões mais recentes do MT5. AVISO DE ATUALIZAÇÃO DE PREÇO: Smart Trend Trading System está atualmente disponível por $99 . O preço aumentará para $199 após as próximas 30 compras . OFERTA ESPECIAL: Após comprar o Smart Trend Trading System, envie-me uma mensagem privada para receber o Smart Universal EA GRÁTIS e transformar seus sinais do Smart Trend em operações automatizadas. Smart Trend Trading System é um sistema de tr
Dynamic Forex28 Navigator
Bernhard Schweigert
4.43 (7)
Dynamic Forex28 Navigator - A ferramenta de negociação Forex de última geração. ATUALMENTE 49% DE DESCONTO. Dynamic Forex28 Navigator é a evolução dos nossos indicadores populares de longa data, combinando o poder de três em um: Indicador Advanced Currency Strength28 (695 avaliações) + Advanced Currency IMPULSE com ALERTA (520 avaliações) + Sinais CS28 Combo (Bônus). Detalhes sobre o indicador https://www.mql5.com/en/blogs/post/758844 O que o Next-Generation Strength Indicator oferece?  Tudo
BTMM State Engine Pro is a MetaTrader 4 indicator for traders who use the Beat The Market Maker approach: Asian session context, kill zone timing, level progression, peak formation detection, and a multi-pair scanner from a single chart. It combines cycle state logic with a built-in scanner dashboard so you do not need the same tool on many charts at once. What it does Draws the Asian session range; session times can follow broker server offset or be set in inputs. Tracks level progression (L
IQ FX Gann Levels a precision trading indicator based on W.D. Gann’s square root methods . It plots real-time, non-repainting support and resistance levels to help traders confidently spot intraday and scalping opportunities with high accuracy. William Delbert Gann (W.D. Gann) was an exceptional market analyst, whose trading technique was based on a complex blend of mathematics, geometry, astrology, and ancient mathematics which proved to be extremely accurate. Setup & Guide:  Download  MT5 Ver
PZ Swing Trading
PZ TRADING SLU
5 (3)
Swing Trading é o primeiro indicador projetado para detectar oscilações na direção da tendência e possíveis oscilações de reversão. Ele usa a abordagem de negociação de linha de base, amplamente descrita na literatura de negociação. O indicador estuda vários vetores de preço e tempo para rastrear a direção da tendência agregada e detecta situações nas quais o mercado está sobrevendido ou sobrecomprado em excesso e pronto para corrigir. [ Guia de instalação | Guia de atualização | Solução de prob
Neo Wave PRO
Nikolay Raykov
5 (1)
Price & Time Market Structure Indicator A professional market structure tool that analyzes waves through both price and time — not price alone. Main Description NeoWave PRO is a professional market structure indicator for MetaTrader 4 designed for traders who want to move beyond traditional one-dimensional wave tools such as ZigZag, swing indicators, and basic high/low systems. Most wave indicators analyze only one thing: Price. But a real market wave is not only a price movement. A true wave de
GOLD Impulse with Alert
Bernhard Schweigert
4.67 (12)
Este indicador é uma super combinação dos nossos 2 produtos Advanced Currency IMPULSE with ALERT  +   Currency Strength Exotics . Funciona para todos os períodos de tempo e mostra graficamente impulso de força ou fraqueza para as 8 principais moedas mais um Símbolo! Este Indicador é especializado para mostrar a aceleração da força da moeda para quaisquer símbolos como Ouro, Pares Exóticos, Commodities, Índices ou Futuros. É o primeiro do seu género, qualquer símbolo pode ser adicionado à 9ª
Market Structure Order Block Dashboard MT4 é um indicador MetaTrader 4 desenvolvido para traders que querem ler a estrutura de mercado e as principais zonas de reação do preço diretamente no gráfico. Combina BOS, ChoCH, Order Blocks, Fair Value Gaps (FVG), Liquidez, Kill Zones, Volume Profile e um dashboard compacto para análise rápida. Este indicador é destinado a traders que usam estrutura de mercado, conceitos ICT e Smart Money como base de decisão. Pode ajudar a identificar continuações de t
O indicador " Dynamic Scalper System " foi desenvolvido para o método de scalping, operando dentro de ondas de tendência. Testado nos principais pares de moedas e ouro, é possível a compatibilidade com outros instrumentos de negociação. Fornece sinais para a abertura de posições de curto prazo ao longo da tendência, com suporte adicional para o movimento dos preços. O princípio do indicador: As setas grandes determinam a direção da tendência. Um algoritmo para gerar sinais de scalping sob a fo
Versão MT5 também disponível https://www.mql5.com/pt/market/product/170916 Versão Swing M30/H1/H4 disponível Quer pegar os grandes movimentos? Gold Signal Swing Pro (M30/H1/H4). Alvo: $20-$80+ por operação. https://www.mql5.com/en/market/product/177643 KURAMA GOLD SIGNAL PRO (MT4) — Sistema Completo de Trading XAUUSD com Filtro de 7 Camadas, TP/SL Automático e Pontuação de Qualidade SEM REPINTURA. SEM REDESENHO. SEM
PZ 123 Pattern
PZ TRADING SLU
1 (1)
O 123 Pattern é um dos padrões de gráficos mais populares, poderosos e flexíveis. O padrão é composto por três pontos de preço: fundo, pico ou vale e retração de Fibonacci entre 38,2% e 71,8%. Um padrão é considerado válido quando as quebras de preços além do último pico ou vale, momento em que o indicador traça uma flecha, sobe um alerta, e o comércio pode ser colocado. [ Guia de instalação | Guia de atualização | Solução de problemas | FAQ | Todos os produtos ] Sinais de negociação claros C
Enigmera
Ivan Stefanov
5 (8)
ENIGMERA: O núcleo do mercado Importante: A demonstração do MQL5.com funciona no Strategy Tester e pode não refletir completamente a funcionalidade do Enigmera. Verifique a descrição, as capturas de tela e o vídeo para mais detalhes. Fique à vontade para me enviar uma mensagem com qualquer dúvida! O código do indicador foi completamente reescrito. A versão 3.0 adiciona novas funcionalidades e corrige erros acumulados desde o início do indicador. Introdução Este indicador e sistema de negociação
O Detetor de Terremoto do Mercado  Sismógrafo. Description in English : https://www.mql5.com/en/market/product/113869?source=Site+Market+Product+Page#description How to use the Seismograph : https://www.mql5.com/en/market/product/113869#!tab=comments&page=2&comment=52806941 Create an EA : https://www.mql5.com/en/market/product/113869#!tab=comments&page=3&comment=52816509 Seja qual for a maneira como você negocia, você definitivamente quer evitar a entrada no mercado de baixa liquidez.- O
Scalper Vault
Oleg Rodin
5 (37)
Scalper Vault é um sistema profissional de escalpelamento que fornece tudo o que você precisa para um escalpelamento bem-sucedido. Este indicador é um sistema de negociação completo que pode ser usado por comerciantes de forex e opções binárias. O período de tempo recomendado é M5. O sistema fornece sinais de seta precisos na direção da tendência. Ele também fornece sinais superiores e inferiores e níveis de mercado Gann. Os indicadores fornecem todos os tipos de alertas, incluindo notificações
Introduction to Fractal Pattern Scanner Fractal Indicator refers to the technical indicator that makes use of the fractal geometry found in the financial market. Fractal Pattern Scanner is the advanced Fractal Indicator that brings the latest trading technology after the extensive research and development work in the fractal geometry in the financial market. The most important feature in Fractal Pattern Scanner is the ability to measure the turning point probability as well as the trend probabi
Trend Lines PRO
Roman Podpora
5 (1)
LINHAS DE TENDÊNCIA PRO       Ajuda a entender onde o mercado está realmente mudando de direção. O indicador mostra inversões de tendência reais e pontos onde os principais participantes retornam ao mercado. Você vê     Linhas BOS     Análise de tendências e níveis-chave em prazos maiores — sem configurações complexas ou ruídos desnecessários. Os sinais não são repintados e permanecem no gráfico após o fechamento da barra. VERSÃO MT 5      -      Revela seu potencial máximo quando emparelhada co
The Propfolio Master Suite is the ultimate all-in-one analytical workstation for professional traders. Combining the power of the Beat The Market Maker (BTMM) methodology, Smart Money Concepts (SND/Liquidity), and Advanced Volume Profile, this suite replaces multiple different indicators with one optimized engine. Monitor up to 14 pairs simultaneously from a single chart, instantly identify market cycles, and seamlessly map institutional footprints with the click of a button. The Command Center
RFI levels PRO
Roman Podpora
5 (1)
O indicador mostra com precisão os pontos de reversão e as zonas de retorno de preço onde o   Principais players . Você identifica onde novas tendências estão se formando e toma decisões com máxima precisão, mantendo o controle sobre cada negociação. VERSION MT5     -     Revela seu potencial máximo quando combinado com o indicador   TREND LINES PRO. O que o indicador mostra: Estruturas de reversão e níveis de reversão com ativação no início de uma nova tendência. Exibição dos níveis de   TAKE
Mais do autor
Neurone
Sergey Rashevskiy
Neurone is a trend strategy based on neural network analysis. Strategy Description The strategy is based on the algorithm of a self-learning neural network. The idea of the algorithm was taken from a famous demonstration of artificial intelligence training in the game with 11 matches. The trading day is divided into 6 trading intervals, which are associated with the H4 candles. Each candle withing a day is a neuron. The history data associated with the neuron are passed as input for the neurons
Neurone MT5
Sergey Rashevskiy
Neurone is a trend strategy based on neural network analysis. Strategy Description The strategy is based on the algorithm of a self-learning neural network. The idea of the algorithm was taken from a famous demonstration of artificial intelligence training in the game with 11 matches. The trading day is divided into 6 trading intervals, which are associated with the H4 candles. Each candle withing a day is a neuron. The history data associated with the neuron are passed as input for the neurons
Filtro:
Sem comentários
Responder ao comentário