Lot sl tp visualizer
- Indicadores
- Versão: 1.0
- Ativações: 5
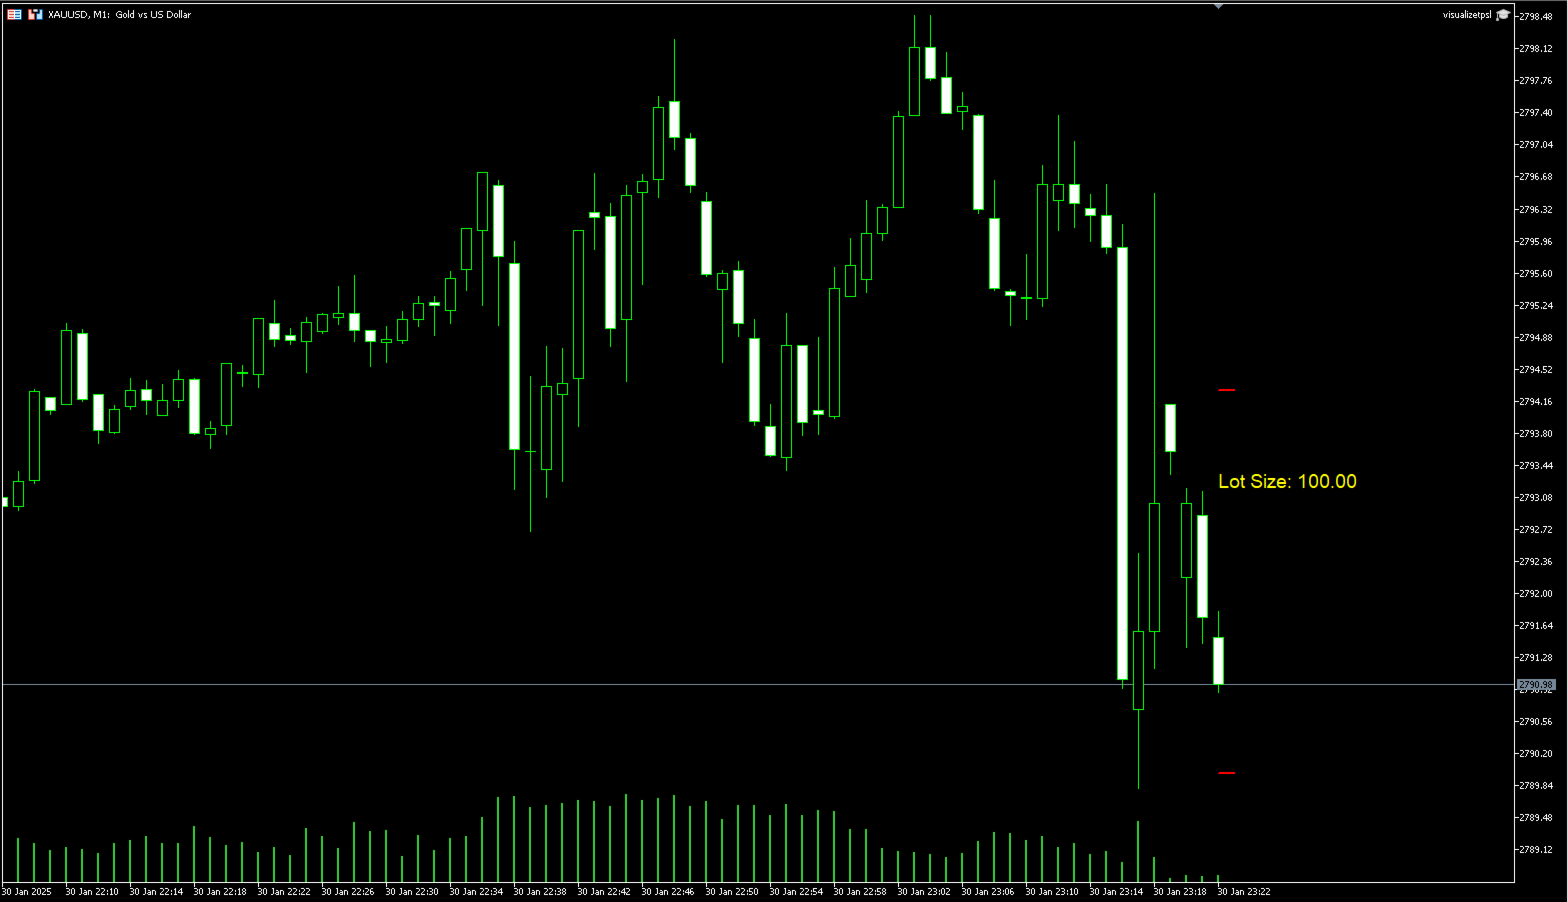
very simple indicator to help with fast risk management during volatility.
~Displays:
- stop loss in points of your choice.
- take profit in points of your choice.
- what lot size to risk on the trade relative percentage.
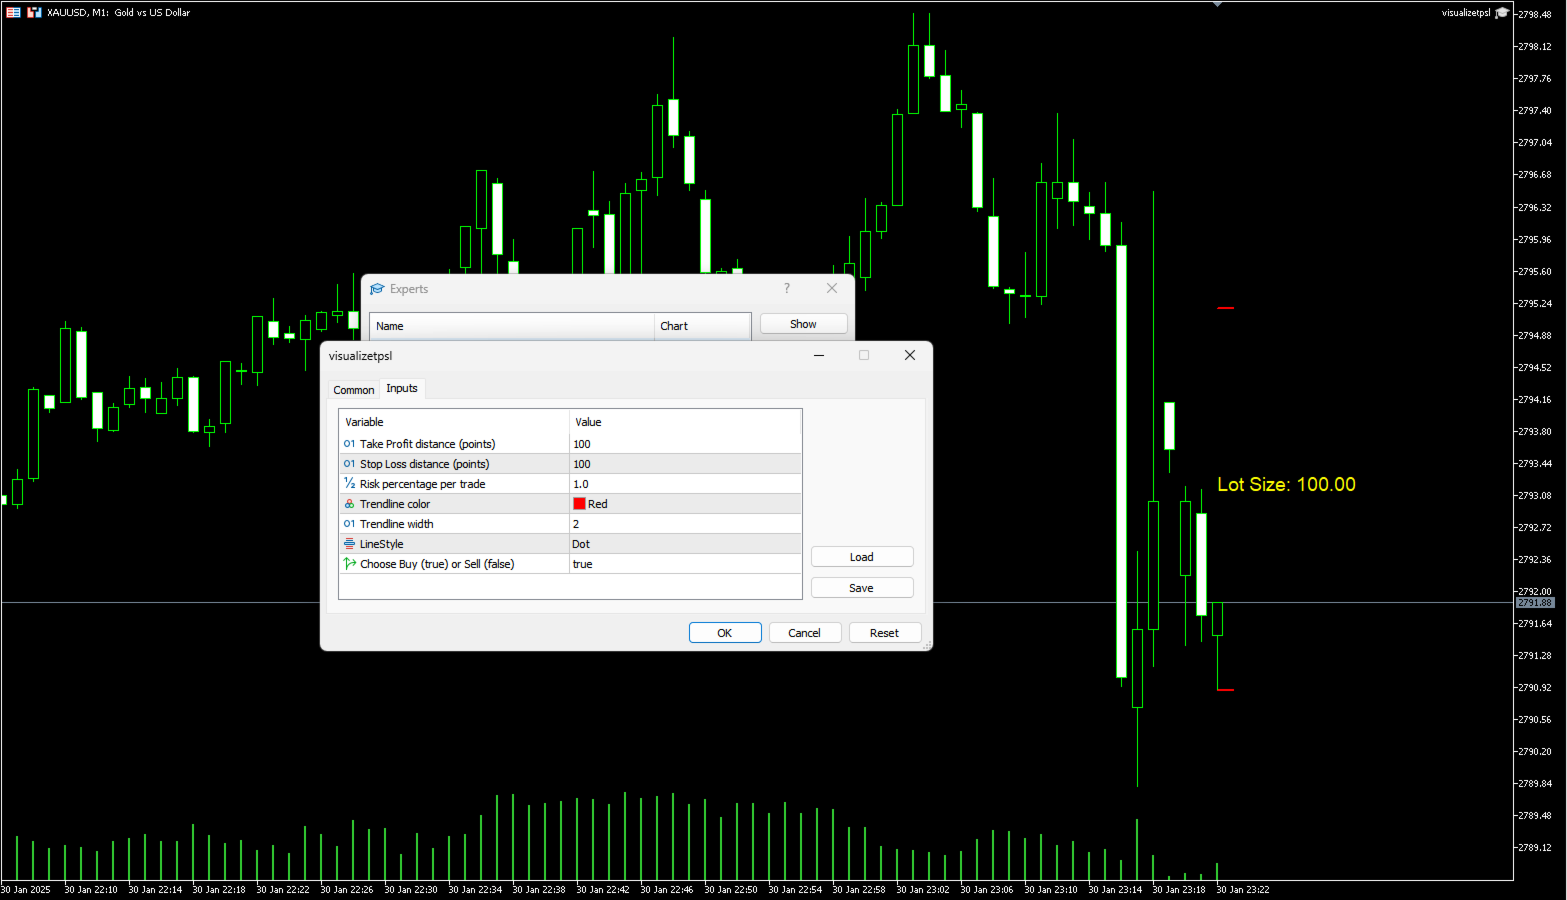
~Values that can be changed:
- take profit points.
- stop loss points.
- risk in percentage.
- color of lines.
- width of lines.
- linestyle.
- buy / sell trade.