Bars Deflection

5

The Bars Deflection trend indicator can be used with any trading pair and on any time frame. With this indicator it is impossible to miss the beginning of a trend.

Use Bars Deflection as a standalone strategy or as an addition to yours.

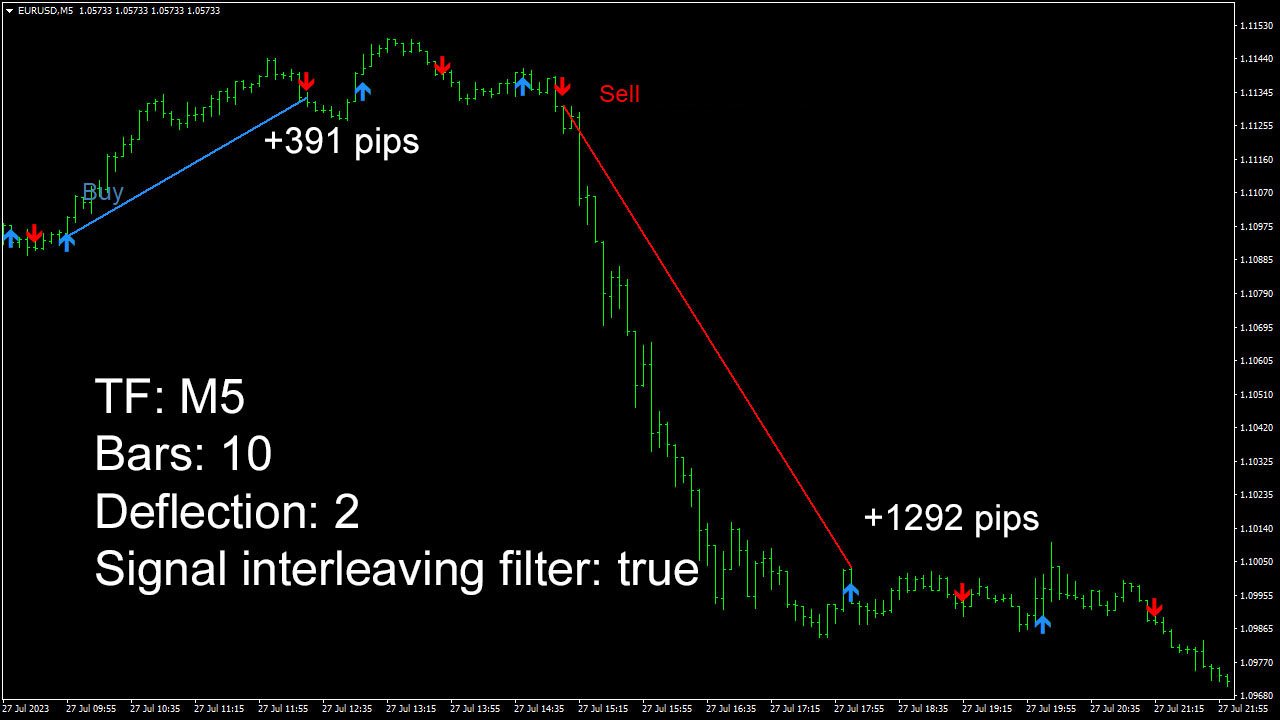
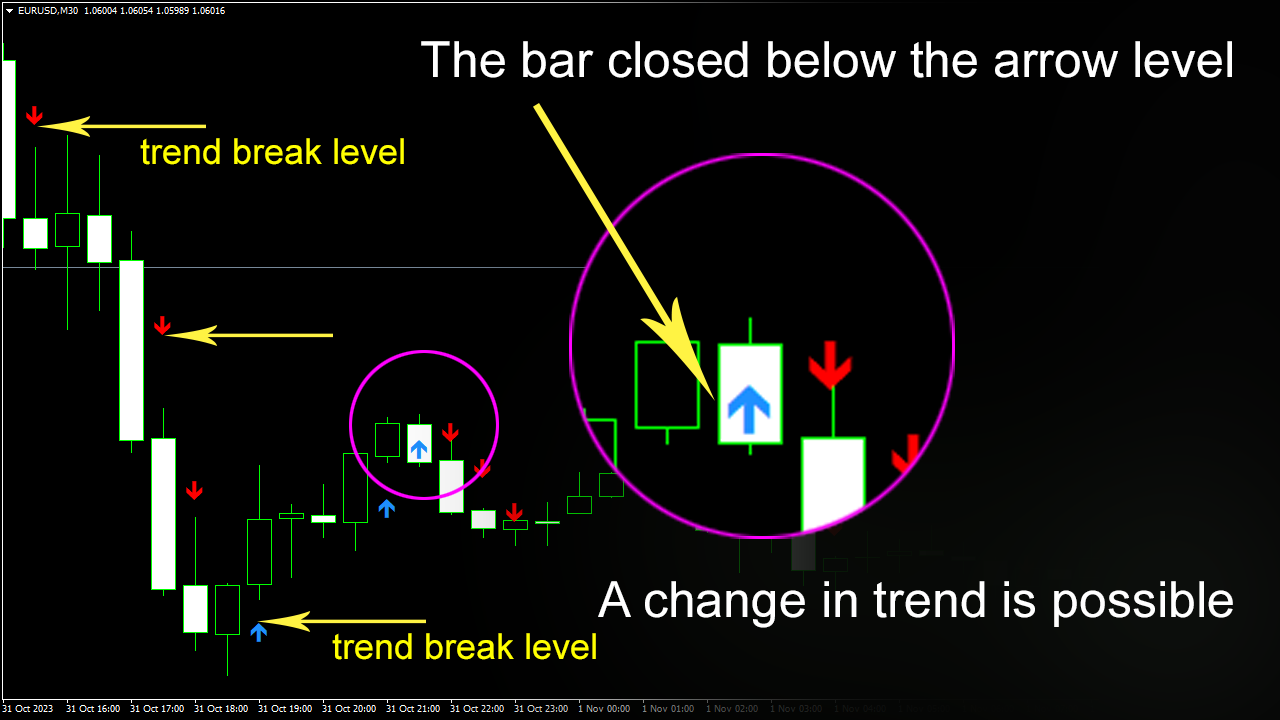
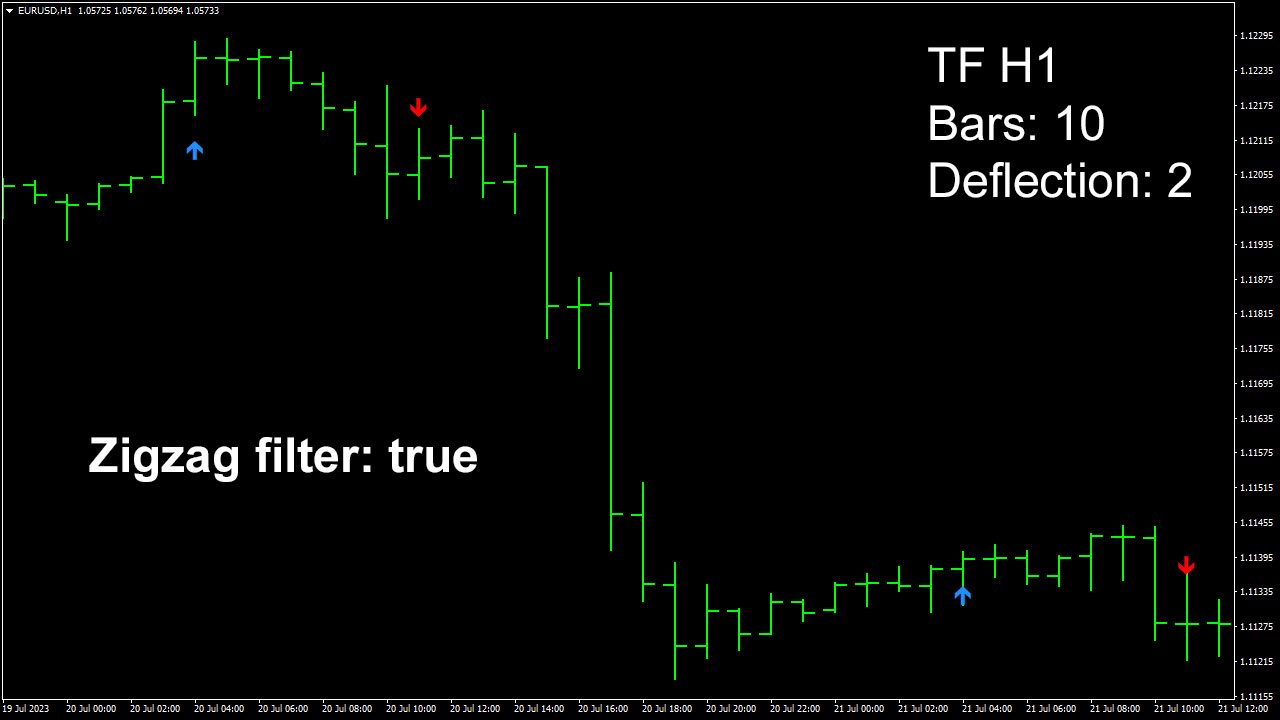
Signal arrows appear on the chart at the moment the bar opens and are located at the breakout level of the reverse movement. Thus, the arrows not only indicate the possible direction of movement of the quote, but also act as levels for analyzing the placement of stop orders. The arrows do not disappear or redraw.

The indicator provides two signal display modes:

  • Signal arrow only on the first bar of the trend (interleaving filter: true)
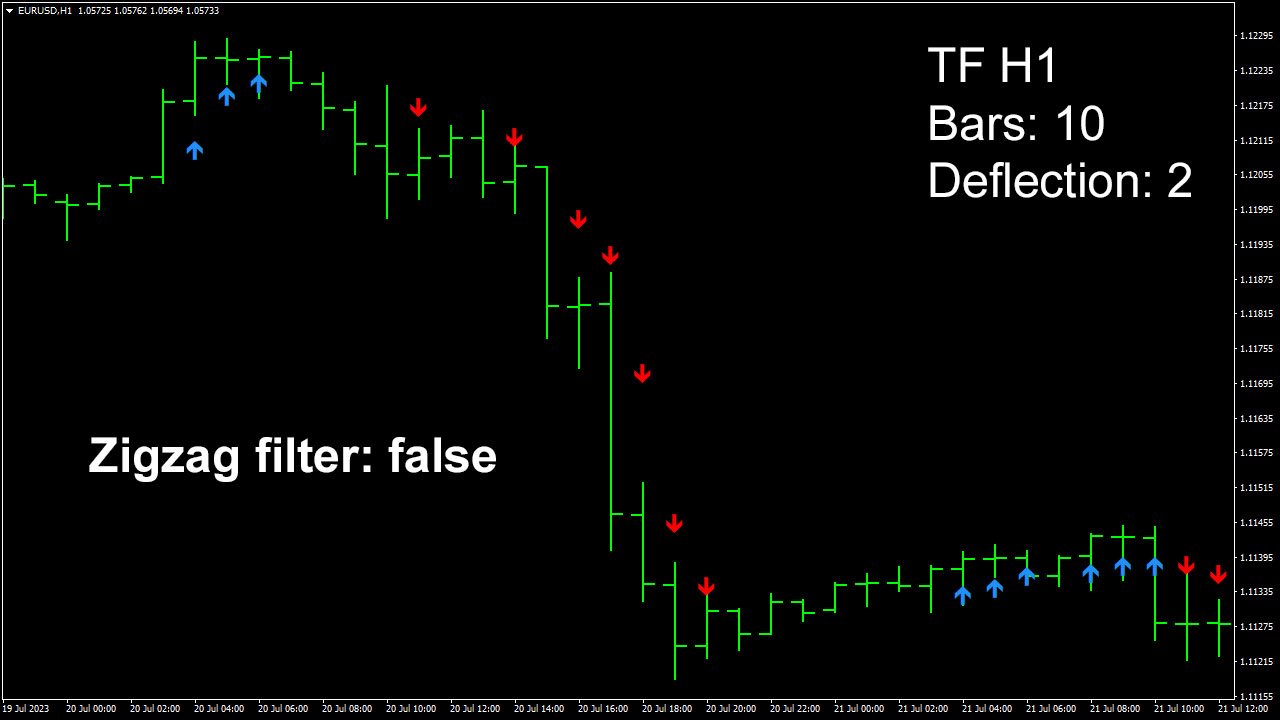
  • Signal arrow on each trend bar (interleaving filter: false)
Bars Deflection has only two technical settings:
  • Number of monitored bars (Bars)*
  • Deflection coefficient (Deflection)*
* The values of these parameters are chosen depending on the style of your approach to trading. The lower the value, the more aggressive trading.

The indicator is equipped with Alerts and Notifications functions. Enable or disable the messaging features you want.

This is the basic version of Bars Deflection. In the future, as the indicator is significantly updated and supplemented, the price of the product may increase.


Comentários 1
jabautista
4114
jabautista 2023.11.10 19:01 
 

Good indicator and author is very responsive to changes and updates.

Produtos recomendados
How to find out where to expect a price reversal with a probability of 80% - 90%? The "Statistics of Price Movements" indicator collects statistics of significant price movements, skipping all small pullbacks, for a certain period of time and displays them in Excel file. Sort the data in ascending order and get statistics of price reversals in 80%, 85%, 90%, 95% of all cases! (for example, in 2 years!) After the reversal, the price will move from 1000 pips or more! So... Open the daily cha
Desvendando o Indicador de Tendência XY Não Repaint: Seu Guia Definitivo para o Sucesso no Forex e Opções Binárias No mundo dinâmico do Forex e da negociação de opções binárias, ficar à frente da curva é fundamental. Os traders estão constantemente à procura de ferramentas que possam lhes fornecer uma vantagem competitiva, e uma dessas ferramentas poderosas que tem feito sucesso na comunidade de traders é o indicador "Non-Repainting XY Trend". Introdução: O indicador Non-Repainting XY Trend é um
The indicator is designed for binary options. It produces a sound alert, after which you should instantly enter the market. The indicator operates based on signals form RSI and CCI, as well as support and resistance levels. When the chart is in overbought and oversold zones, the indicator finds a level in this zone and notifies you using a sound and a message. Indicator Parameters dist - the number of points to generate a signal. Suitable values ​​are from 21 to 50. Filtr_SMA - the filter, used
Bermaui Pin Bars
Muhammad Elbermawi
5 (13)
Bermaui Pin Bars Ou (BPB) é um indicador que encontra o padrão de ação do preço das Barras de Pin no gráfico. Pin Bars é um atalho para "Pinocchio Bars", que é uma alternativa clássica de padrão de barra aos castiçais japoneses com altas sombras superiores ou inferiores e corpos muito pequenos, como Martelo, Martelo Invertido, Homem Pendurado, Estrela Cadente, Doji de Mosca de Dragão ou Doji de Pedra Grave . O indicador Bermaui Pin Bars encontra esse padrão dependendo de uma fórmula que pode se
Upper and Lower Reversal - Sistema para previsão antecipada de momentos de reversão. Permite encontrar pontos de viragem de preços nos limites dos canais de movimento de preços superiores e inferiores. O indicador nunca irá recolorir ou alterar a posição das setas de sinalização. As setas vermelhas são um sinal de compra, as setas azuis são um sinal de venda. Ajusta-se a quaisquer prazos e instrumentos de negociação O indicador não redesenha, só funciona quando a vela fecha. Existem vários tip
The indicator shows you buy/sell signals and does not repaint. It works well with almost all pairs, while the best ones are GBPUSD, XAUUSD and EURUSD. The product works better on H1 and H4. You can change the parameters in the inputs tab to get the best signals and the best trade results on each pair. You can enable/disable alerts when signal appears. The indicator is easy to use. Parameters barstrip & Sensitive: amount of bars to process the highest and lowest prices (relates to the internal l
Doji Marker Point
Alexander Shienkov
This indicator shows the levels and signal dots of the Doji pattern. The indicator allows traders to easily determine possible location of a price rebound. Doji is a candlestick with Open and Close price equal, or almost equal. It should also have shadows of approximately the same size on both sides. Doji denotes the balance between buyers and sellers, or the absence of major players, or level testing. This pattern can mean both a reversal and a continuation of the trend. Indicator Parameters I
ForexFire Renkotrader Recognize profitable entries & trade with confidence! Highlights: Precise signals – Identifies reversal candles in the trend EMA filter - Uses Ema`s for reliable signals Intelligent signal limiting - Only qualified signals are displayed Easy to use – Perfect for beginners & professionals Visual support - arrows in the chart + SL display in the chart Notifications – Receive alerts & push notifications This is how the indicator works: Long Signal:
Welcome to the world of SMC (Smart Money Concepts) Trading, where we empower traders with the tools and knowledge to make smarter trading decisions. Our latest addition to our suite of trading tools is the SMC Trading Pro indicator, version 1.0. Key Features: Major Market Structure Identification with BODY break. Order Block must be in Major Swing ( not Small Swing ). Order Block with Fair Value Gap Detection. Order Block in Discount | Premium zone. Filter for only Bullish, Bearish or All Order
Dear traders this is Our new Indicator called Hull Pro MTF Indicator — Precision Multi-Timeframe Trend Visualizer Overview The Hull Pro MTF Indicator is a next-generation Heiken-Ashi-based multi-timeframe visual tool designed for top-down market analysis . It blends the power of Hull Moving Average (HMA) logic and multi-level Heiken-Ashi smoothing to reveal directional bias, volatility ranges, and price symmetry across hourly, daily, weekly, monthly, and yearly structures — all in a single c
Engulfingfinder
Miracle Obinna Okafor
The indicator is based on identifying engulfing candlestick patterns within the current timeframe. When such patterns are found, it generates buy and sell signals represented by up and down arrows, respectively. However, the user is responsible for determining the prevailing trend. Once the trend is identified, they should trade in line with the corresponding signal that aligns with the trend direction.
FREE
Quantum Trend Scanner (Non-Repaint) Stop hunting the market. Let the market come to YOU. Quantum Trend Scanner NonRepaint is the precision tool every serious trader has been waiting for. While most indicators repaint their signals and leave you second-guessing every trade, QTS locks every signal the moment a candle closes — and never moves it again. Sniper-precision entry signals. A red arrow appears at the top of a rally when the market is ready to reverse down. A green arrow appears at the bot
The technical indicator "Reversal patterns" is a mathematical interpretation of the classic reversal patterns: Pin Bar, Harami and Engulfing. That is, the "reversal bar", "Harami" and "Absorption". This indicator allows you to determine the moment of reversal of quotes based on market dynamics and the winner between the "bulls" and "bears". The indicator displays the moment of reversal at the local highs and lows of the chart of any timeframe, which allows you to increase the accuracy of the s
SignalPinner is a trend line Indicator which can detect market trends early by including three types of signal arrows. Non repaint and trend following. Signals on the strong trend, signals in the beginning of trend and signals with multiple market analysis algorithm as the main signals. Supported by alert notification message to keep you getting signals while on the go. Symbols: Any Timeframes: Any Features Histogram buffers as a sign the trend is started. It can help the trader knowing the mar
Adjustable Consecutive Fractals  looks for 2 or more fractals in one direction and sends out a on screen alert, sound alert and push notification, for strong reversal points . Adjustable Consecutive Fractals, shows the fractals on chart along with a color changing text for buy and sell signals when one or more fractals appear on one side of price. Adjustable Consecutive Fractals is based Bill Williams Fractals . The standard Bill Williams fractals are set at a non adjustable 5 bars, BUT withe th
This indicator has a unique support and resistance calculation program, which is a unique trading system. Index characteristics Imagine if you can accurately determine the important trading support and resistance areas and points in advance, how will your trading improve? Based on a unique calculation method, the indicator analyzes the trend, analyzes the current support and resistance, and obtains the current important support resistance and single direction, the calculated stop profit and sto
Night ghost
Dmitriy Kashevich
Night Ghost - Indicador de seta para opções binárias. Este é um assistente confiável para você no futuro! - Sem redesenho no gráfico -Funciona muito bem em todos os pares de moedas! -Precisão do indicador de até 90% (especialmente à noite) -Não há necessidade de configurar por um longo tempo (Configurar perfeitamente para Opções Binárias) - Sem sinais de atraso - O aparecimento de um sinal na vela atual -Perfeito para o período M1 (não mais!) - Cor de vela amigável aos olhos (vermelho
Binary SS é uma ferramenta para negociação de opções binárias que: Funciona em qualquer período de tempo. Compatível com qualquer par de moedas. Gera sinais baseados em tendências com alta precisão. Como funciona? O sinal para a próxima vela aparece como uma seta no gráfico (antes do fechamento da vela atual): Seta azul — sinal de compra. Seta vermelha — sinal de venda. Expiração padrão: 1 vela , ajustável para 1 a 4 velas nas configurações. Instalação: Baixe a pasta "MQL5" : Baixar aqu
FREE
Smart Line is a trend indicator. It helps you find trend reversal points. This trading strategy is designed for trend trading. The indicator algorithm accurately determines the trend on various trading instruments, at different time intervals. The Smart Line indicator can be used as an additional tool, or as the main one. The color of the indicator lines changes depending on the current trend, as well as built-in indicators of possible entries in the position, indicated by arrows. Parameters
Trend Long
Maryna Shulzhenko
The Trend Long indicator accompanies long trends. It can be used only to determine the global trend, but not as an entry point. Any reliable entry indicator can be used for the entry point. Or the standard RSI, based on overbought / oversold levels. The indicator can be used without restrictions on instruments or timeframes. Experiment with the parameters! The parameters are not linear! When you specify a period, you only specify a period to determine the price range for a certain interval. Th
Candle Arrow indicator give you the power of the candle when you see the Arrow on Chart that mean a price Action will happen soon so important thing you must draw the supply and demand area on the chart and the wait the Signal Appear with Candle you must wait until candle close and i advice you take look on higher timefram then back to smaller timeframe it will give you a good entry point 
Binary Options Support Resistance Indicator This indicator is designed for binary options trading and effectively shows retracements from support and resistance levels. Signals appear on the current candle. A red arrow pointing downwards indicates a potential selling opportunity, while a blue arrow pointing upwards suggests buying opportunities. All that needs adjustment is the color of the signal arrows. It is recommended to use it on the M1-M5 timeframes as signals are frequent on these timef
Trend Ray
Andriy Sydoruk
The indicator shows the potential trend direction by cyclical-wave dependence. Thus, all the rays of the intersection will be optimal rays, in the direction of which the price is expected to move, taking into account the indicator period. Rays can be used as a direction for potential market movement. But we must not forget that the approach must be comprehensive, the indicator signals require additional information to enter the market.
Indicador de sesion de trabajo
Edmundo Antonio Bazan Garcia
Permite ver el horario comprendido entre la hora inicial que indique el usuario y la hora final, de esa manera, si el usuario desea ver sobre el grafico una sesion de trabajo, solo tiene que indicar la hora incial y la hora final de la sesion que desee. Esto permite que el usuario identifique con mayor facilidad el horario que comprenda la sesion de trabajo que el usuario desee vigilar, o trabajar, o simplemente tener como referencia.
Do you want to always know in a quick glance where price is going? Are you tired of looking back and forth between different timeframes to understand that? This indicator might just be what you were looking for. Trend Signal Multitimeframe shows you if the current price is higher or lower than N. candles ago, on the various timeframes. It also displays how many pips higher or lower current price is compared to N. candles ago. Number N. is customizable The data is shown in a window that you can m
SuperRSI
Andriy Sydoruk
The SuperRSI indicator is an advanced index of internal strength. The indicator shows not the relative strength of the trading instruments being compared, but the internal strength of a single instrument, therefore, it is the “Internal Strength Index”. This is an advanced form of the SuperRSI indicator. It converts the signal so that low-frequency components are delayed much more than high-frequency components. In general, the data of the last bar have more weight than previous data, like an exp
Extremum Reverse Bar
Yurij Izyumov
2.8 (5)
This indicator has been created for finding the probable reversal points of the symbol price. A small candlestick reversal pattern is used it its operation in conjunction with a filter of extremums. The indicator is not redrawn! If the extremum filter is disabled, the indicator shows all points that have a pattern. If the extremum filter is enabled, the condition works – if the history Previous bars 1 candles back contains higher candles and they are farther than the Previous bars 2 candle, such
FREE
Meraz V2
Md Meraz Mahmud
Hello Alright. This indicator works on MT4 and is very easy to use. When you receive a signal from it, you wait for that candle with the signal to close and you enter your trade at the beginning of the next new candle. A red arrow means sell and a green arrow means buy. All arrows comes with a long dotted like for easy identification of trade signal. Are you okay with that?   100% non repaint Work All Major currency  Pair,  1 minute time frame 1 minute expire, 5 minute timeframe 5 minute expire
CycleIdentifier
Amyr Shryf Mhmd Salh
The Cycle Identifier MT4 indicator is a great choice of custom indicator for both short-term and long-term traders. The Cycle Identifier MT4 generates filtered price action signals to assist traders to identify when the conditions are right to open buy and sell positions. How it works The Cycle Identifier MT4 indicator displays on a separate indicator chart below the main chart where it draws an oscillating gray line. This gray line is characterized by upward and downward spikes that are accompa
Double HMA lines MTF
Pavel Zamoshnikov
5 (1)
This is a multi-timeframe version of the popular Hull Moving Average (HMA). The Double HMA MTF Light indicator combines two timeframes on a single chart. The HMA of the higher timeframe defines the trend, and the HMA of the current timeframe defines short-term price movements. The indicator is freely distributed and hasn't audio signals or messages. Its main function is the visualization of price movements. If you need advanced functionality of the HMA multi-timeframe indicator (information ab
FREE
Os compradores deste produto também adquirem
PZ Harmonacci Patterns
PZ TRADING SLU
3.17 (6)
Este é sem dúvida o indicador de reconhecimento automático de formação de preço harmônico mais completo que você pode encontrar para a MetaTrader Platform. Ele detecta 19 padrões diferentes, leva as projeções de Fibonacci tão a sério quanto você, exibe a Zona de Reversão Potencial (PRZ) e encontra níveis adequados de stop loss e take-profit. [ Guia de instalação | Guia de atualização | Solução de problemas | FAQ | Todos os produtos ] Detecta 19 formações harmônicas de preços diferentes Traça
Scalper Inside PRO
Alexey Minkov
4.74 (69)
Scalper Inside PRO – Since 2020. An exclusive indicator that utilizes an innovative algorithm to swiftly and accurately determine the market trend. The indicator automatically calculates opening, closing, and profit levels, providing detailed trading statistics. With these features, you can choose the most appropriate trading instrument for the current market conditions. Additionally, you can easily integrate your own arrow indicators into Scalper Inside Pro to quickly evaluate their statistics
Quantum Breakout Indicator PRO
Bogdan Ion Puscasu
4.96 (26)
Apresentando       Quantum Breakout PRO   , o inovador Indicador MQL5 que está transformando a maneira como você negocia Breakout Zones! Desenvolvido por uma equipe de traders experientes com experiência em negociação de mais de 13 anos,   o Quantum Breakout PRO   foi projetado para impulsionar sua jornada comercial a novos patamares com sua estratégia inovadora e dinâmica de zona de rompimento. O Quantum Breakout Indicator lhe dará setas de sinal em zonas de breakout com 5 zonas-alvo de lucro
The Propfolio Master Suite is the ultimate all-in-one analytical workstation for professional traders. Combining the power of the Beat The Market Maker (BTMM) methodology, Smart Money Concepts (SND/Liquidity), and Advanced Volume Profile, this suite replaces multiple different indicators with one optimized engine. Monitor up to 14 pairs simultaneously from a single chart, instantly identify market cycles, and seamlessly map institutional footprints with the click of a button. The Command Center
Se você comprar este indicador, receberá meu Gerenciador de Operações Profissional   + EA  GRATUITAMENTE. Primeiramente, vale ressaltar que este Sistema de Trading é um Indicador Não Repintado, Não Redesenho e Não Atrasado, o que o torna ideal tanto para o trading manual quanto para o automatizado. Curso online, manual e download de predefinições. O "Sistema de Trading Inteligente MT5" é uma solução completa de trading projetada para traders novos e experientes. Ele combina mais de 10 indicador
Please send me Direct message on MQL5 CHAT after purchasing the Indicator for Training and Installation Support There are some additional files that is important to use with the Indicator . So be sure to contact me after purchasing the Indicator So that I can add you for training and support . If you find any difficulty with installation then send me Direct message here So that I can connect with you via Anydesk or Teamview for the product installation. " Smart Order Block Indicator " to find m
Sinal de tendência GoldRush Arrow O indicador Sinal de tendência GoldRush Arrow fornece uma análise precisa e em tempo real das tendências, adaptada para scalpers de alta velocidade e curto prazo em XAU/USD. Criada especificamente para o intervalo de tempo de 1 minuto, esta ferramenta exibe setas direcionais para pontos de entrada claros, permitindo que os scalpers naveguem em condições de mercado voláteis com confiança. O indicador consiste em setas de alerta PRIMÁRIAS e SECUNDÁRIAS. Os sin
PZ Trend Trading
PZ TRADING SLU
4.8 (5)
O Trend Trading é um indicador projetado para lucrar o máximo possível com as tendências que ocorrem no mercado, cronometrando retrocessos e rupturas. Ele encontra oportunidades de negociação analisando o que o preço está fazendo durante as tendências estabelecidas. [ Guia de instalação | Guia de atualização | Solução de problemas | FAQ | Todos os produtos ] Negocie mercados financeiros com confiança e eficiência Lucre com as tendências estabelecidas sem ser chicoteado Reconhecer retrocessos
GOLD Impulse with Alert
Bernhard Schweigert
4.67 (12)
Este indicador é uma super combinação dos nossos 2 produtos Advanced Currency IMPULSE with ALERT  +   Currency Strength Exotics . Funciona para todos os períodos de tempo e mostra graficamente impulso de força ou fraqueza para as 8 principais moedas mais um Símbolo! Este Indicador é especializado para mostrar a aceleração da força da moeda para quaisquer símbolos como Ouro, Pares Exóticos, Commodities, Índices ou Futuros. É o primeiro do seu género, qualquer símbolo pode ser adicionado à 9ª
Market Structure Patterns MT4
Samuel Manoel De Souza
5 (18)
Market Structure Patterns   é um indicador baseado em   smart money concepts   que apresenta elementos de   SMC/ICT   capazes de elevar suas decisões de negociação a um novo patamar. Aproveite os   alertas ,   notificações   push   e   mensagens  por  e-mail   para ser informado sobre quando um elemento se forma no gráfico, o preço cruza um nível e/ou entra em uma região delimitada por uma retângulo. Desenvolvedores podem acessar valores dos elementos do indicador por meio de   variáveis globais
Advanced Supply Demand
Bernhard Schweigert
4.91 (300)
Atualmente com 40% de desconto! A melhor solução para qualquer Trader Novato ou especialista! Este indicador é uma ferramenta de negociação exclusiva, de alta qualidade e acessível porque incorporamos uma série de recursos proprietários e uma nova fórmula. Com esta atualização, você poderá mostrar fusos horários duplos. Você não só será capaz de mostrar um TF mais alto, mas também mostrar ambos, o TF do gráfico, MAIS o TF mais alto: MOSTRANDO ZONAS ANINHADAS. Todos os traders de Oferta e Demanda
Este indicador examina a estrutura de preços de fractais de diferentes períodos para determinar possíveis pontos de reversão no mercado, proporcionando tempo aos traders posicionais que já possuem um modelo de avaliação fundamental ou técnico. Diferentemente de seu irmão mais novo, Reversal Fractals , esse indicador não perde reversões por causa do período selecionado e encontra fractais de reversão em zigue-zague, ignorando as reversões que não possuem impulso suficiente para iniciar um movime
PZ Support Resistance
PZ TRADING SLU
3.33 (3)
Cansado de traçar linhas de suporte e resistência? A Resistência de suporte é um indicador de período múltiplo que detecta e plota automaticamente linhas de suporte e resistência no gráfico com um toque muito interessante: conforme os níveis de preços são testados ao longo do tempo e sua importância aumenta, as linhas se tornam mais espessas e mais escuras. [ Guia de instalação | Guia de atualização | Solução de problemas | FAQ | Todos os produtos ] Melhore sua análise técnica da noite para o d
O indicador " Dynamic Scalper System " foi desenvolvido para o método de scalping, operando dentro de ondas de tendência. Testado nos principais pares de moedas e ouro, é possível a compatibilidade com outros instrumentos de negociação. Fornece sinais para a abertura de posições de curto prazo ao longo da tendência, com suporte adicional para o movimento dos preços. O princípio do indicador: As setas grandes determinam a direção da tendência. Um algoritmo para gerar sinais de scalping sob a fo
They say history repeats itself. What if you could prove it in real-time? The Propfolio Ghost Pattern is an advanced algorithmic pattern-matching engine. It empowers you to select any current price action structure on your chart and instantly scan thousands of historical candles to find the exact moment in the past where the market did the exact same thing. Once it finds the highest probability match, it projects the historical outcome into the future as "Ghost Candles"—giving you a highly calcu
Atomic Analyst
Issam Kassas
5 (5)
Primeiramente, vale ressaltar que este Indicador de Negociação não repinta, não redesenha e não apresenta atrasos, tornando-o ideal tanto para negociação manual quanto automatizada. Manual do utilizador: configurações, entradas e estratégia. O Analista Atômico é um Indicador de Ação de Preço PA que utiliza a força e o momentum do preço para encontrar uma vantagem melhor no mercado. Equipado com filtros avançados que ajudam a remover ruídos e sinais falsos, e aumentam o potencial de negociação.
ACTUALMENTE COM 26% DE DESCONTO!! Este indicador é uma super combinação dos nossos dois principais indicadores ( Advanced Currency Strength 28   &  Advanced Currency IMPULSE with ALERT ). Mostra valores de Força da Moeda para TICK-UNITS e sinais de alerta para 28 pares de Forex. Podem ser usadas 11 Tick-Units diferentes. Estas são 1, 2, 3, 4, 5, 6, 10, 12, 15, 20, e 30 segundos. A barra de Tick-Unit na sub-janela será mostrada e deslocada para a esquerda quando houver pelo menos 1 tick dentro
KURAMA GOLD SIGNAL PRO (MT4) — Sistema Completo de Trading XAUUSD com Filtro de 7 Camadas, TP/SL Automático e Pontuação de Qualidade SEM REPINTURA. SEM REDESENHO. SEM ATRASO. Cada sinal é permanente. O que você vê é o que recebe. BÔNUS: Compre a licença vitalícia e receba AI Zone Radar (valor $59) + manual PDF completo GRÁTIS. Me envie uma mensagem após a compra. AI Zone Radar: https://www.mql5.com/en/market/product/175834 CONFIADO POR TRADERS: Já utilizado por uma comunidade ativa de trader
ACTUALMENTE COM 40% DE DESCONTO A melhor solução para qualquer novato ou comerciante especializado! Este Indicador é uma ferramenta comercial única, de alta qualidade e acessível, porque incorporámos uma série de características proprietárias e uma nova fórmula. Com apenas UM gráfico, pode ler a força da moeda para 28 pares de Forex! Imagine como a sua negociação irá melhorar porque é capaz de apontar o ponto exacto do gatilho de uma nova tendência ou oportunidade de escalada? Manual do util
Um indicador técnico que estrutura gráficos e identifica movimentos cíclicos de preços. Pode funcionar em qualquer gráfico. Vários tipos de notificações. Existem setas adicionais no próprio gráfico. Sem redesenhar a história, trabalha no fecho da vela. TF recomendado a partir de M5 e superior. Parâmetros fáceis de utilizar e configurar. Ao utilizar 2 indicadores com parâmetros diferentes, pode utilizá-los sem outros indicadores. Tem 2 parâmetros de entrada Ciclicidade e duração do sinal Estes
KuKl
IGOR KIRIANEN
The indicator is built on a non-standard Zig Zag, it draws accumulations after which if the price leaves this zone and a test of this zone occurs, then a sound signal is given and an arrow appears - after the test candle closes.The indicator does not redraw its signals, it is very easy to use, there are only three settings 1- this is the zig zag parameter 2- this is the minimum price exit from the zone 3- this is the maximum price exit from the zone. The lower the parameter for Zig Zag, the more
Delta Fusion Pro
Francesco Secchi
5 (2)
Delta Fusion Pro – Análise Avançada de Order Flow para Trading Intradiário Delta Fusion Pro é um indicador profissional para MetaTrader 4 que revela o fluxo de ordens agressivas, mostrando a intensidade e a direção da pressão institucional em tempo real. Diferente dos indicadores volumétricos tradicionais, ele analisa a delta entre volumes Ask e Bid para antecipar reversões, confirmar tendências e identificar zonas de interesse profissional. Características Principais Sistema Inteligente de Au
Bull versus Bear
Mohamed Hassan
4.5 (18)
Send us a message after your purchase to receive more information on how to get your  BONUS  for FREE  that works in great combination with Bull vs Bear ! Bull versus Bear is an easy-to-use Forex indicator that gives traders clear and accurate signals based on clear trend retests . Forget about lagging indicators or staring at charts for hours because  Bull vs Bear provides real-time entries with no lag and no repaint, so you can trade with confidence. Bull vs Bear  helps you enter trades during
Gold PL MTF - este é um excelente indicador técnico de ações. O algoritmo do indicador analisa o movimento do preço do ativo e reflete automaticamente os Níveis de Pivot importantes do período de tempo especificado (TF) utilizando o método de Fibonacci (secção áurea). O indicador descreve perfeitamente a trajetória de preços do período selecionado (dia, semana, mês, ano), determina o início de uma tendência e o início de uma correção, que pode evoluir para uma tendência oposta. O indicador mo
RFI levels PRO
Roman Podpora
5 (1)
O indicador mostra com precisão os pontos de reversão e as zonas de retorno de preço onde o   Principais players . Você identifica onde novas tendências estão se formando e toma decisões com máxima precisão, mantendo o controle sobre cada negociação. VERSION MT5     -     Revela seu potencial máximo quando combinado com o indicador   TREND LINES PRO. O que o indicador mostra: Estruturas de reversão e níveis de reversão com ativação no início de uma nova tendência. Exibição dos níveis de   TAKE
Antes de tudo, vale ressaltar que esta Ferramenta de Negociação é um Indicador Não Repintante, Não Redesenhante e Não Atrasado, o que a torna ideal para negociação profissional. Curso online, manual do utilizador e demonstração. O Indicador de Conceitos de Ação de Preço Inteligente é uma ferramenta muito poderosa tanto para traders novos quanto experientes. Ele combina mais de 20 indicadores úteis em um único, combinando ideias avançadas de negociação como Análise do Trader do Círculo Interno e
Gold Venamax MT4
Sergei Linskii
3 (2)
Gold Venamax   - este é o melhor indicador técnico de ações. O algoritmo do indicador analisa o movimento do preço de um ativo e reflete a volatilidade e as zonas de entrada potenciais. Recursos do indicador: Este é um super indicador com Magic e dois blocos de setas de tendência para uma negociação confortável e lucrativa. O botão vermelho para alternar blocos é exibido no gráfico. Magic é definido nas configurações do indicador, para que você possa instalar o indicador em dois gráficos exibin
NAM Divergences
NAM TECH GROUP, CORP.
5 (1)
Indicador de detecção MT4 Multi-timeframe Divergence e Overbougt / Oversold. Características - Totalmente personalizável no painel de controle do gráfico, fornece interação completa. - Oculte e mostre o painel de controle onde quiser. - Informação em tempo real sobre divergências não capitalizadas. - Informações em tempo real sobre situações de sobrecompra / sobrevenda. - Informações em tempo real sobre divergências regulares. - Informações em tempo real sobre divergências ocultas. -
Super Signal – Skyblade Edition Sistema profissional de sinais de tendência sem repintar / sem atraso com taxa de acerto excepcional | Para MT4 / MT5 Funciona melhor em timeframes mais curtos, como 1 minuto, 5 minutos e 15 minutos. Principais características: Super Signal – Skyblade Edition é um sistema inteligente de sinais desenvolvido especificamente para operações com tendência. Utiliza uma lógica de filtragem em múltiplas camadas para detectar apenas movimentos direcionais fortes sustenta
O Detetor de Terremoto do Mercado  Sismógrafo. Description in English : https://www.mql5.com/en/market/product/113869?source=Site+Market+Product+Page#description How to use the Seismograph : https://www.mql5.com/en/market/product/113869#!tab=comments&page=2&comment=52806941 Create an EA : https://www.mql5.com/en/market/product/113869#!tab=comments&page=3&comment=52816509 Seja qual for a maneira como você negocia, você definitivamente quer evitar a entrada no mercado de baixa liquidez.- O
Mais do autor
The indicator searches for matches in history for a specified range of the latest known oscillated Moving Average data. Found matches are indicated on the graph as colored fields. Analysis of historical data (the behavior of quotes in history) will help make decisions in trading. The matches found are updated when a new bar is opened (i.e., the calculation is performed upon opening prices). The value of the increase accuracy (Accuracy) must be changed with a decrease in the timeframe, and de
FREE
Индикатор сглаженного Stochastic Oscillator (xStoh) Входные параметры: xK Period - K период xD Period - D период xSlowing - замедление xMethod - метод усреднения (0-SMA | 1-EMA | 2-SMMA | 3 - LWMA) xPrice field - тип цены (0 - Low/High | 1 - Close/Close) Принцип работы Индикатор перерассчитывает стандартный технический индикатор Stochastic Oscillator (дважды усредняет получаемые значения iStochastic).
FREE
Индикатор сглаженных Bollinger Bands (xBB) Входные параметры: xBB Period - период усреднения xBB Price - используемая цена ( 0 - CLOSE | 1 - OPEN | 2 - HIGH | 3 - LOW | 4 - MEDIAN | 5 - TYPICAL | 6 - WEIGHTED) xBB Deviation - отклонение xBBColor - цвет индикаторных линий xBB Width - толщина индикаторных линиц Принцип работы Индикатор перерассчитывает стандартный технический индикатор Bollinger Bands (дважды усредняет получаемые значения iBands). Период усреднения индикатора соответствует двой
FREE
Индикатор сглаженного MACD (xMACD) Входные параметры: Fast EMA Period - период быстрой EMA Slow EMA Period   - период медленной EMA Signal SMA Period   - период сигнальной SMA Applied Price - тип цены (0 - CLOSE | 1 - OPEN | 2 - HIGH | 3 - LOW | 4 - MEDIAN | 5 - TYPICAL | 6 - WEIGHTED) Принцип работы Индикатор перерассчитывает стандартный технический индикатор MACD (дважды усредняет получаемые значения). Индикаторный буфер не перерисовывается.
FREE
The indicator calculates a combination of two moving averages and displays their trend in derivative units. Unlike traditional oscillators, the maximum and minimum values ​​in this indicator always correspond to the number of bars you want to track. This allows you to use custom levels regardless of volatility and other factors. The maximum and minimum values ​​are always static and depend only on the initial Bar review settings. The indicator can be used as an independent trading systemtrading
FREE
Индикатор сглаженного Moving Average (xMA) Входные параметры: xMA Period - период усреднения xMA Method - метод усреднения  ( 0-SMA | 1-EMA | 2-SMMA | 3 - LWMA) xMA Price - используемая цена ( 0 - CLOSE | 1 - OPEN | 2 - HIGH | 3 - LOW | 4 - MEDIAN | 5 - TYPICAL | 6 - WEIGHTED) xMA Color - цвет индикаторной линии xMA Width - толщина индикаторной линии Принцип работы Индикатор перерассчитывает стандартный технический индикатор Moving Average (дважды усредняет получаемые значения iMA). Период с
FREE
Chartos
Victor Golovkov
Trend indicator with oscillator. Displays price area between two moving averages and an oscillator. An uptrend is indicated in red, a downtrend in blue. Settings: Slow MA Period - Slow MA period Fast MA Period - Fast MA period Smoothed Data - Smoothing data Show Area MA - Display MA price areas Show Oscillation - Display MA oscillation Move Oscillation to Slow MA - Display an oscillator on a slow MA Color Up - Uptrend color Color Down - Downtrend color Size Arrow - The size of the oscillator ic
FREE
Индикатор сглаженного DeMarker  Oscillator (xDeM) Входные параметры: Period - период усреднения Принцип работы Индикатор перерассчитывает стандартный технический индикатор DeMarker Oscillato r (дважды усредняет получаемые значения). Период усреднения индикатора соответствует двойному периоду стандартного DeMarker  Oscillato r . Например : xDeM с периодом усреднения 7 соответствует DeM c периодом 14. Индикаторный буфер не перерисовывается.
FREE
SData
Victor Golovkov
Сигнальный индикатор "SDATA" рассчитывается на основе стандартного отклонения от простой средней скользящей пропорционально среднеквадратичному отклонению. Настройки индикатора: Data bars - количество баров для рассчета Deviation Data - среднеквадратичное отклонение Smooth Data - сглаживание данных Code Arrow Buy - код значка на покупку Color Arrow Buy - цвет значка на покупку Code Arrow Sell - код значка на продажу Color Arrow Sell - цвет значка на продажу В момент инициализации индикатора (при
The Extremum Average signal indicator works on all timeframes and any markets. Analyzes the smoothed data of extremums and gives signals to sell or buy. The indicator has only two settings: Number of Bars - the number of last bars to search for an extremum Period Average - Period (number of last bars) for data smoothing For each timeframe and market, you need to select its own values. Additionally, in the indicator settings, you can set your own style of signal display: Size Arrow Code Arrow B
Changend
Victor Golovkov
The Changend signal indicator works on all timeframes and any markets. Analyzes data in the specified period and gives signals for a possible trend change (sell or buy). The indicator has only two settings: Period bars   - the number of last bars for data analysis Deviation level of bars  -the degree of deviation from the analyzed data Additionally, in the indicator settings, you can set your own style of signal display: Size Arrow Code Arrow Buy Color Arrow Buy Code Arrow Sell Color Arrow Sel
Atrade
Victor Golovkov
Full automatic. Does not require technical settings. Works on all currency pairs. The indicator has a built-in zigzag filter that limits repetitions of unidirectional signals (i.e. after a buy signal, the next one will be a sell signal, and vice versa). For the convenience of displaying, the indicator provides settings for the type of icons, their color and size: Size Arrow Code Arrow Buy Color Arrow Buy Code Arrow Sell Color Arrow Sell Indicator signals are not redrawn.
Tame the trend just got easier! The PDS indicator will signal the use of price sentiment. Just one setting! Study the offer of the indicator and get the opportunity for profitable trading based on a proven and tested strategy. The mathematical algorithm proves its performance even to skeptics under any market conditions. It goes well with any trading strategy. Never recalculates signals. Signals appear at the opening of the bar. Works with any financial instruments, including forex, cryptocurr
Martingale grid panel - a semi-automatic Expert Advisor with a built-in trading panel. The Expert Advisor is activated by standard MT4 tools (or via its own panel) and automatically sets Take Profit, Stop Loss, Trailing Stop. Automatically or manually opens averaging orders. Changes the volume of orders in accordance with the Martingale strategy. Works with all orders of the selected symbol or only those opened from the panel, when the ID number is set. The Expert Advisor (and its Free Demo) are
The trend indicator processes each bar of the chart and displays signal arrow on it. In the default display settings: red arrow - sell signal blue arrow - buy signal If the arrows are missing on some bars, this means that the algorithm has not identified a consensus on the signal on this bar. The indicator does not have any technical settings for the algorithm. The process of finding a consensus is fully automated. For ease of visualization on charts, user settings allow you to set the size of
Smart Predictor — Continuous Market Forecasting with Intelligent Signals SmartPredictor  offers a fresh perspective on technical analysis. This indicator combines price data smoothing with advanced forecasting elements to create a seamless, continuous "past-present-future" view. No more guessing where the price might go — you can now see the most probable scenario plotted directly on your chart. Key Innovation: Zero Visual Lag Unlike standard averaging indicators such as moving averages that a
Filtro:
jabautista
4114
jabautista 2023.11.10 19:01 
 

Good indicator and author is very responsive to changes and updates.

Victor Golovkov
3897
Resposta do desenvolvedor Victor Golovkov 2023.11.11 12:05
Thank you, happy trading!
Responder ao comentário