Trend Volatility
- 지표
- 버전: 1.0
- 활성화: 5
 Ltd")
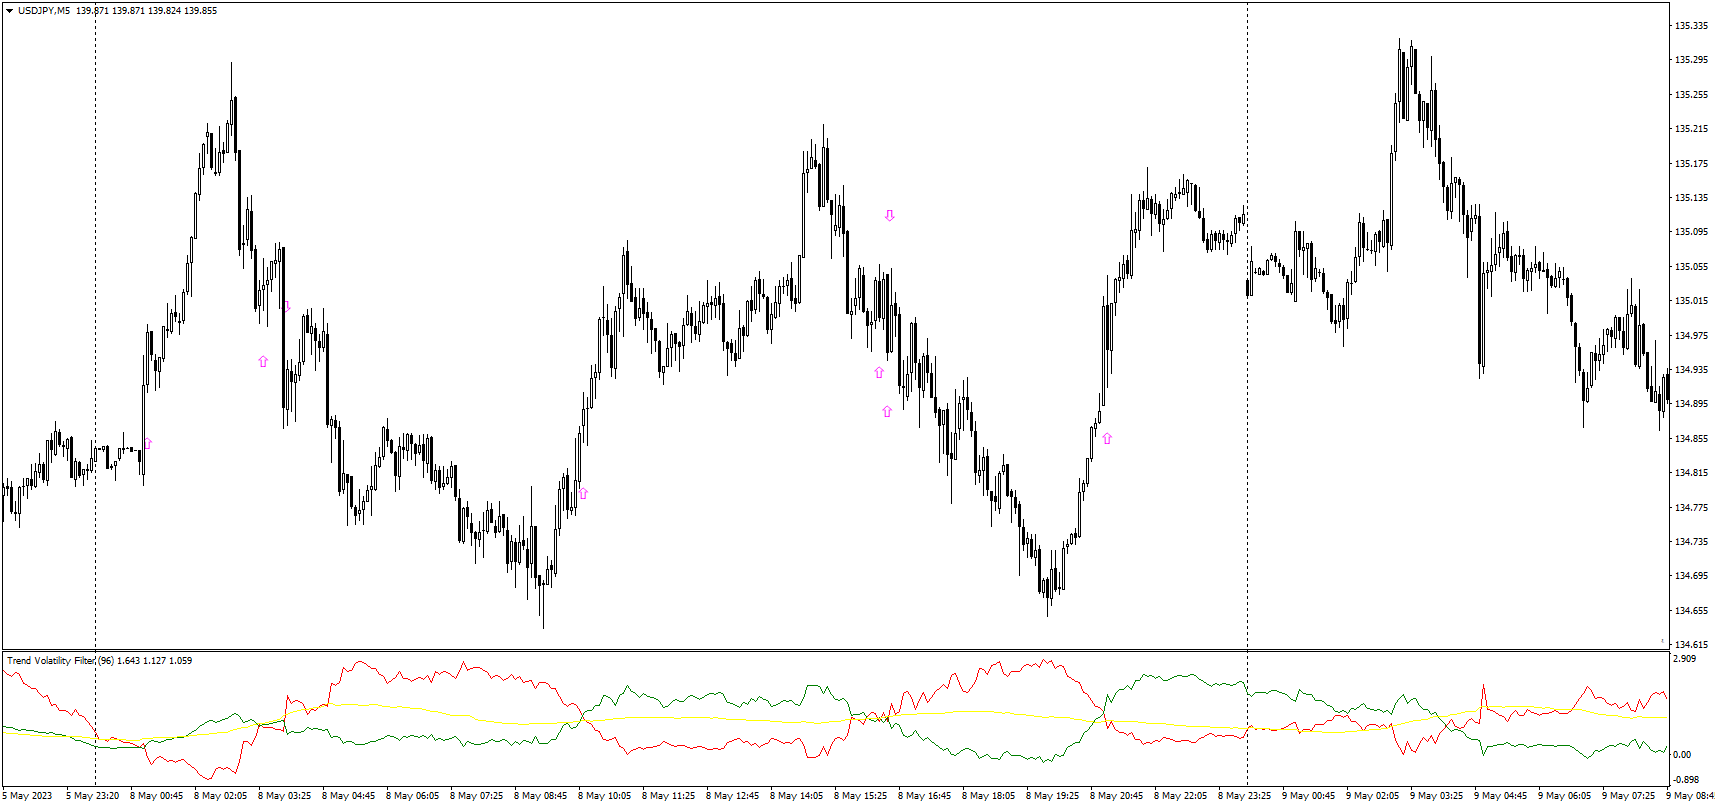
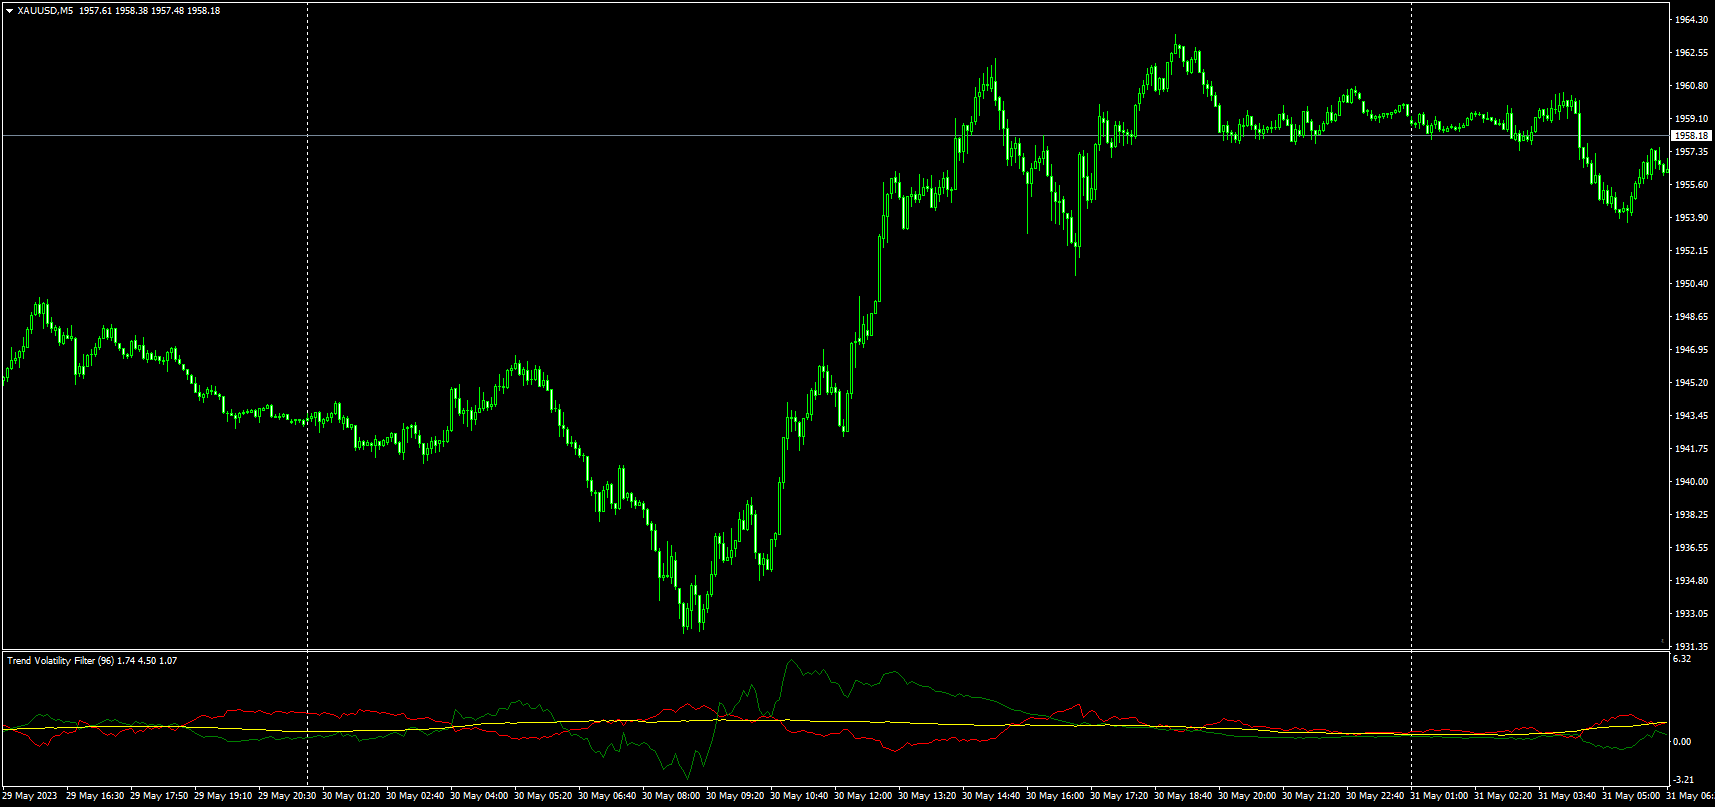
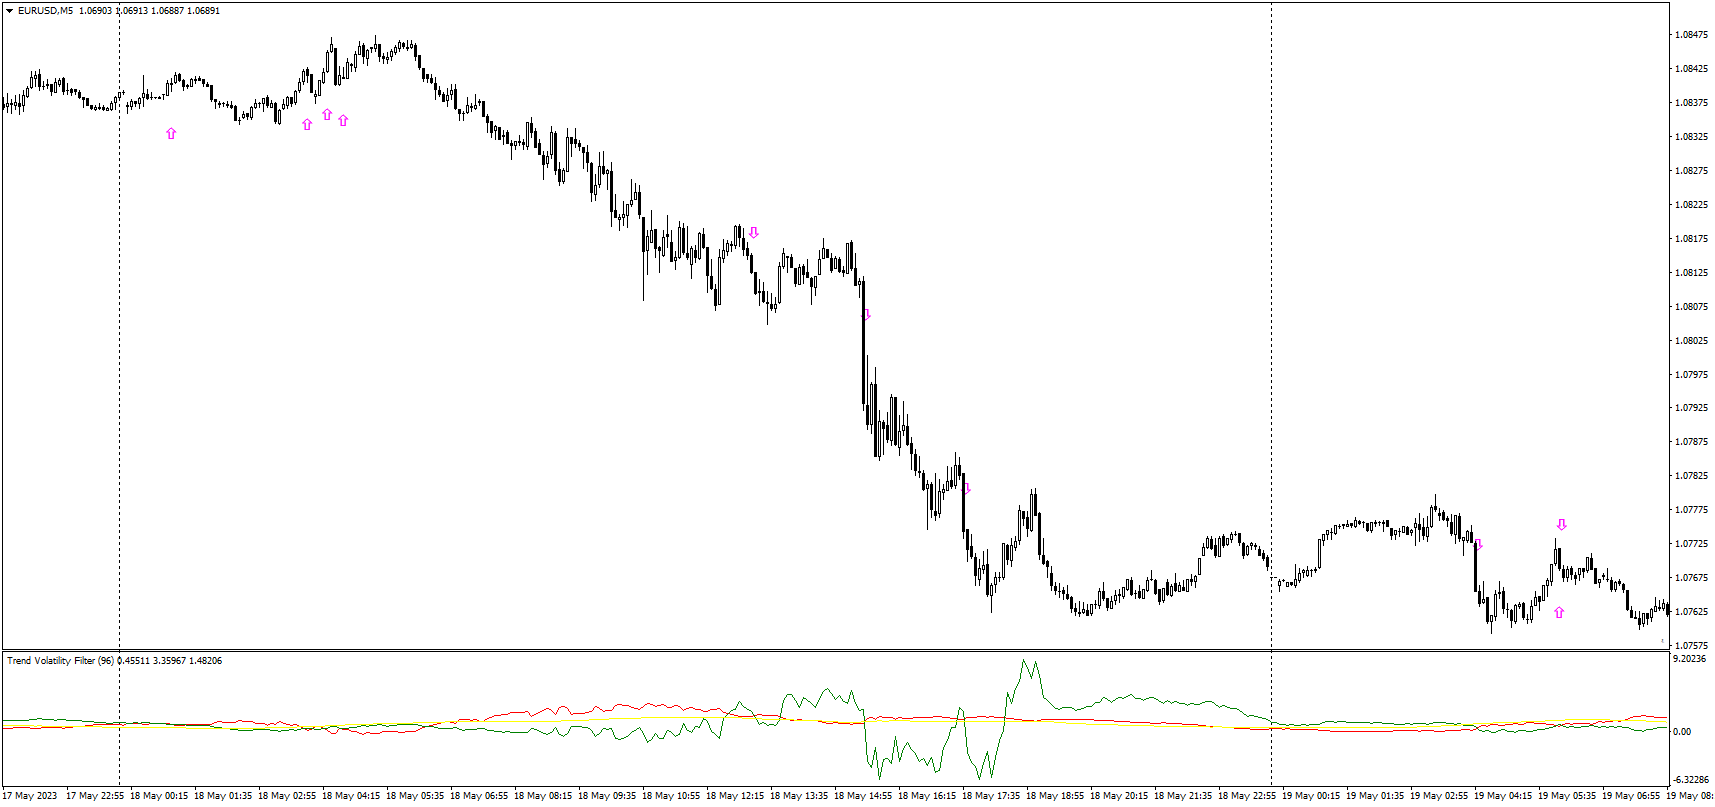
The indicator has been designed to function on any time-frame and any pair, although it is best suited for currency pairs on 5-minute charts, and used in conjunction with the Trend Direction Filter Indicator.
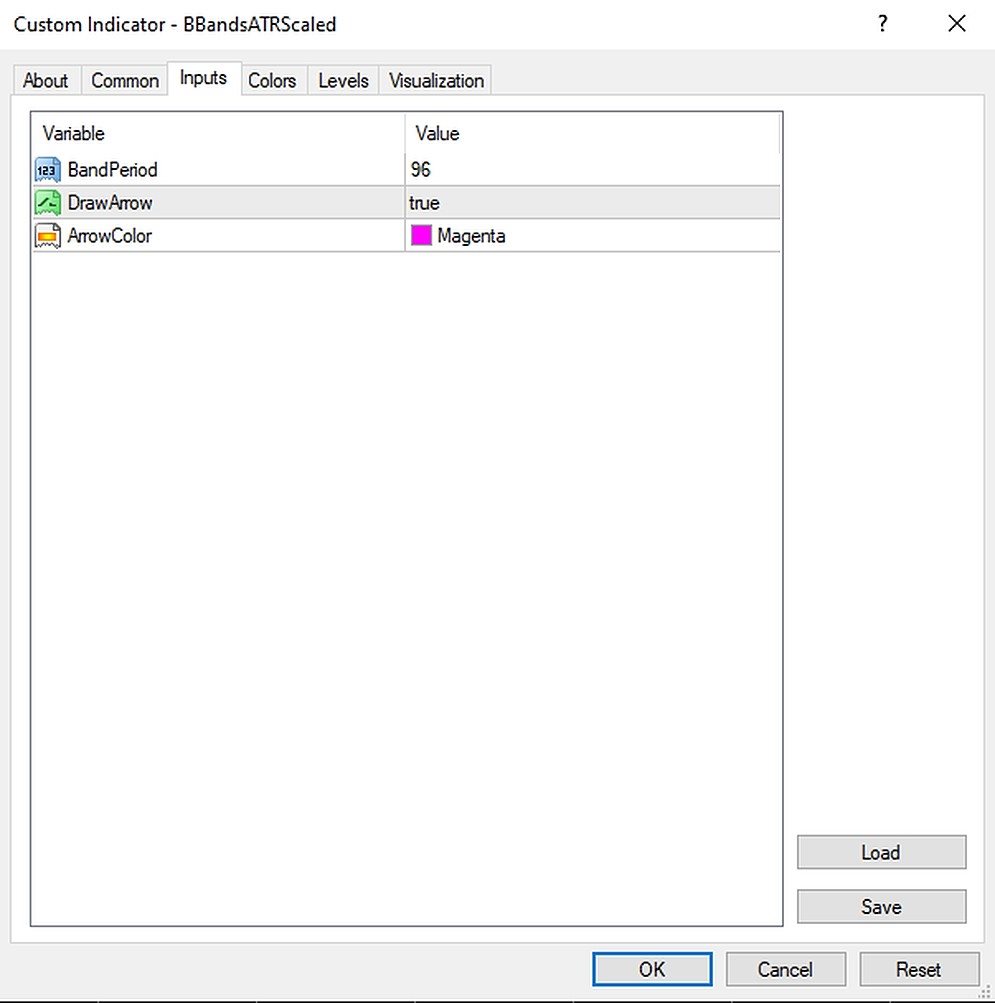
This trend volatility filter will help the trader better evaluate whether the current market is trending, and in which direction. A dynamic filter threshold has been added to help the trader avoid choppy market conditions, and add greater confidence when entering, with an added functionality of plotting signal arrows on the chart to aid in detecting possibly entries.
The Yellow indicator line is the filter. When both the Green and Red trending lines are above/below the Yellow filter, the market is in a choppy state, and trades should not be entered.
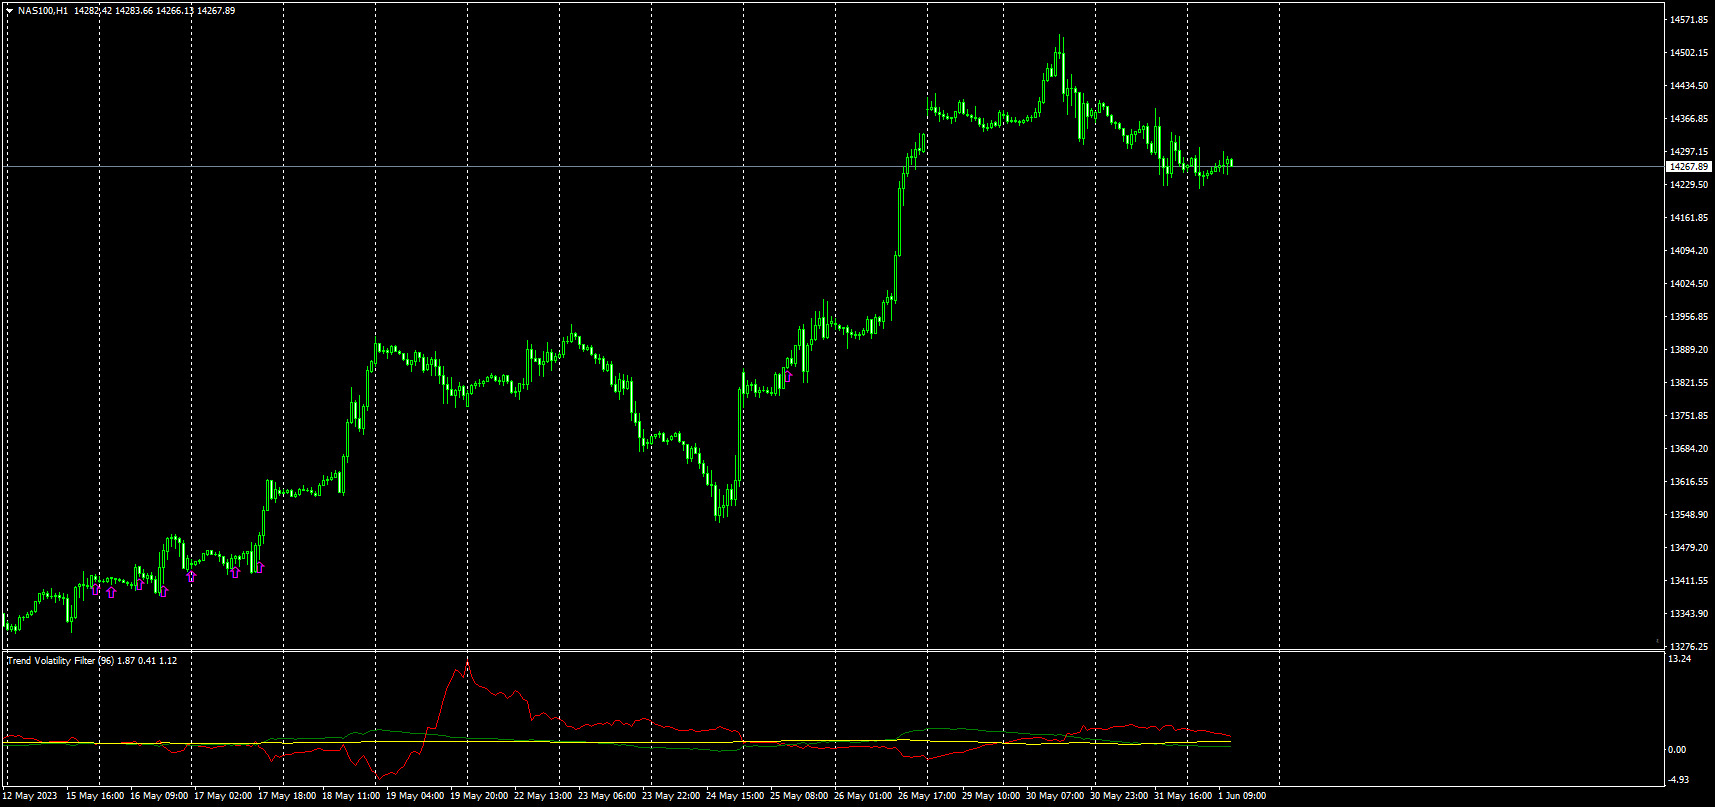
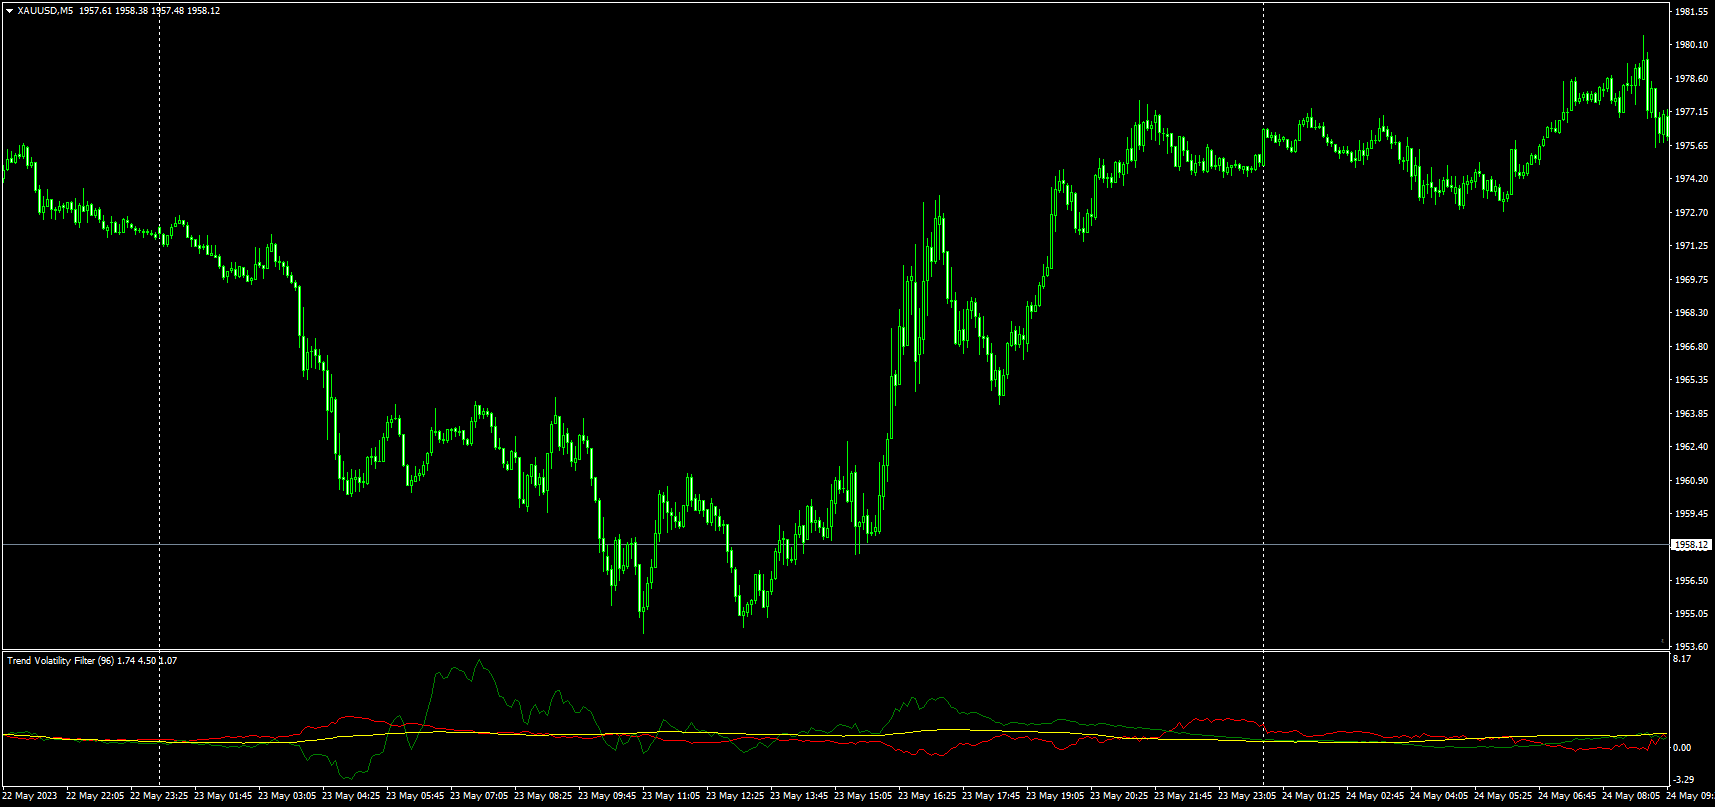
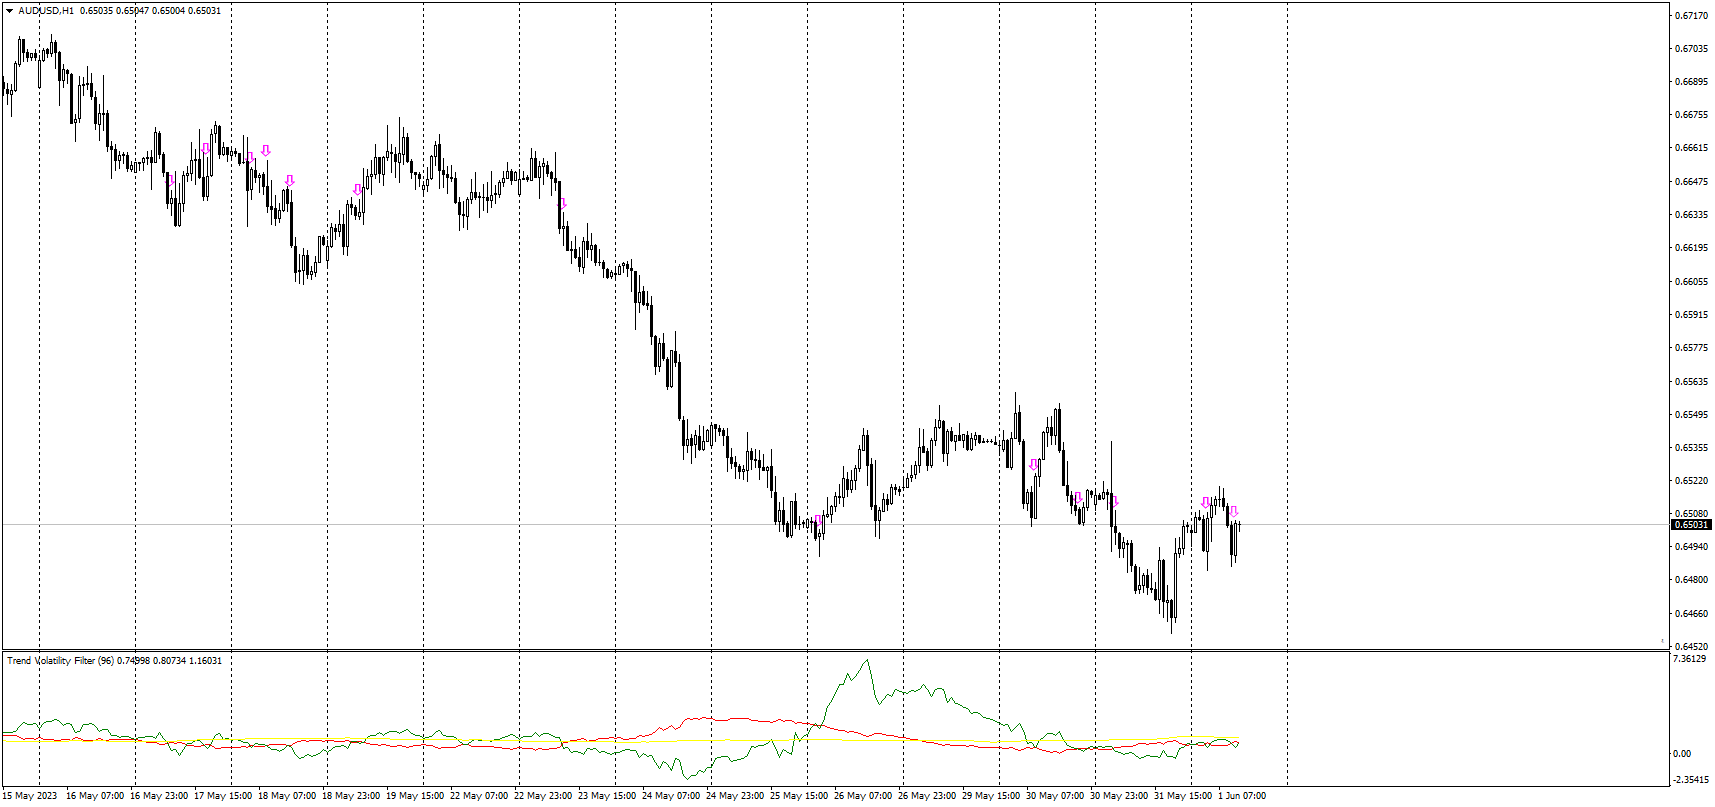
When the Green indicator line breaches the filter threshold, and the Red indicator line remains below the filter, the market is in an upward trending state.
When the Red indicator line breaches the filter threshold, and the Green indicator line remains below the filter, the market is in an downward trending state.
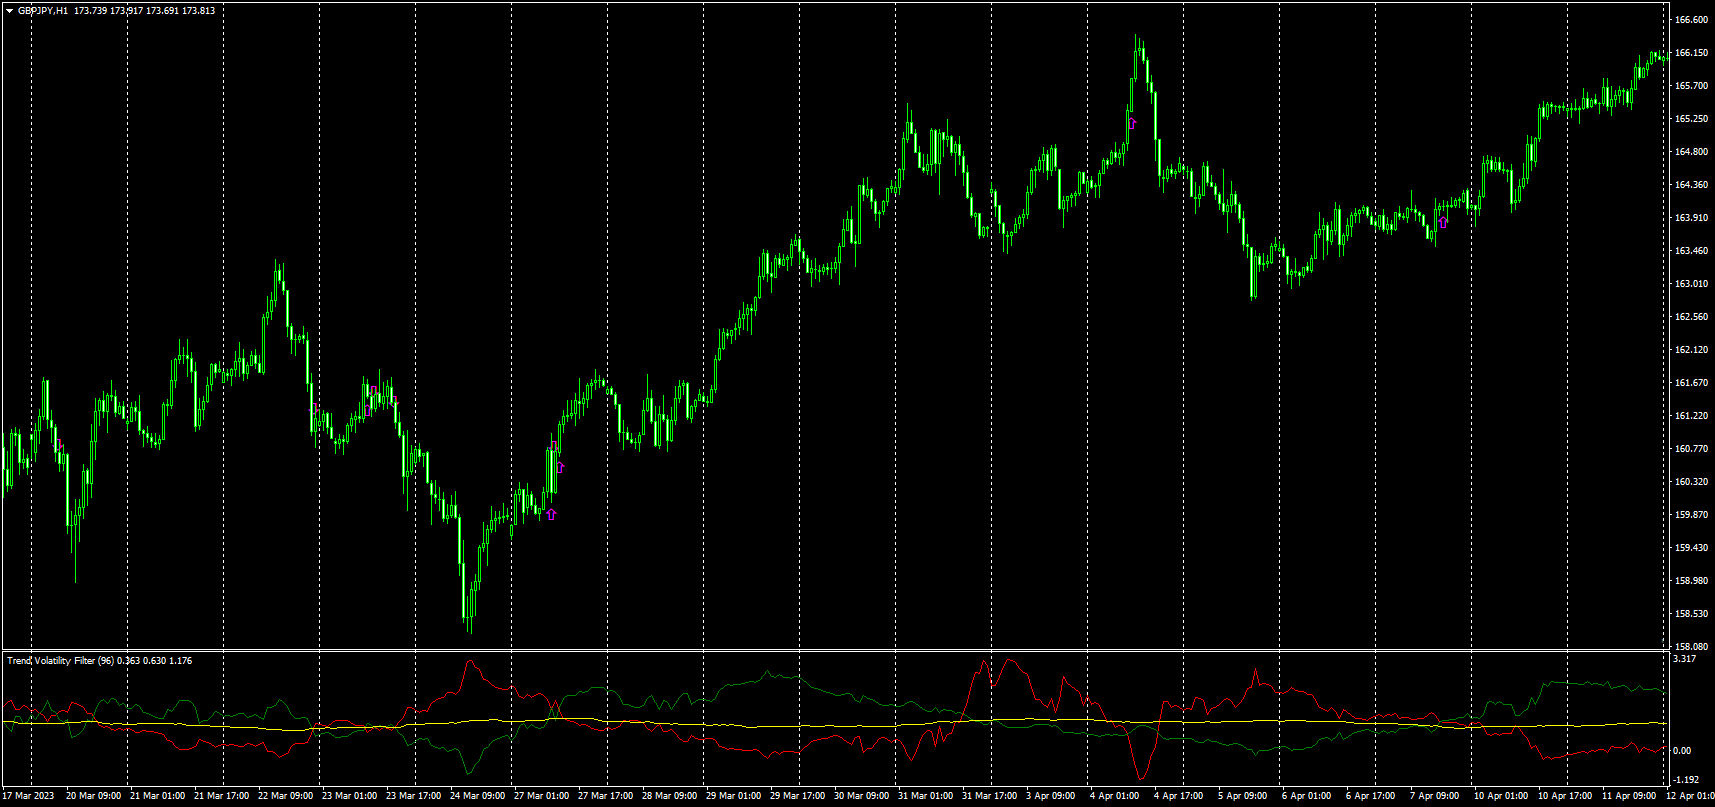
This indicator can be used on its own, although it is best suited when used with the Trend Filter Indicator, as the further confirmation due to its faster signal generation.