Base Box Indicator MT4
- 지표
- 버전: 1.0
- 활성화: 5

Overview
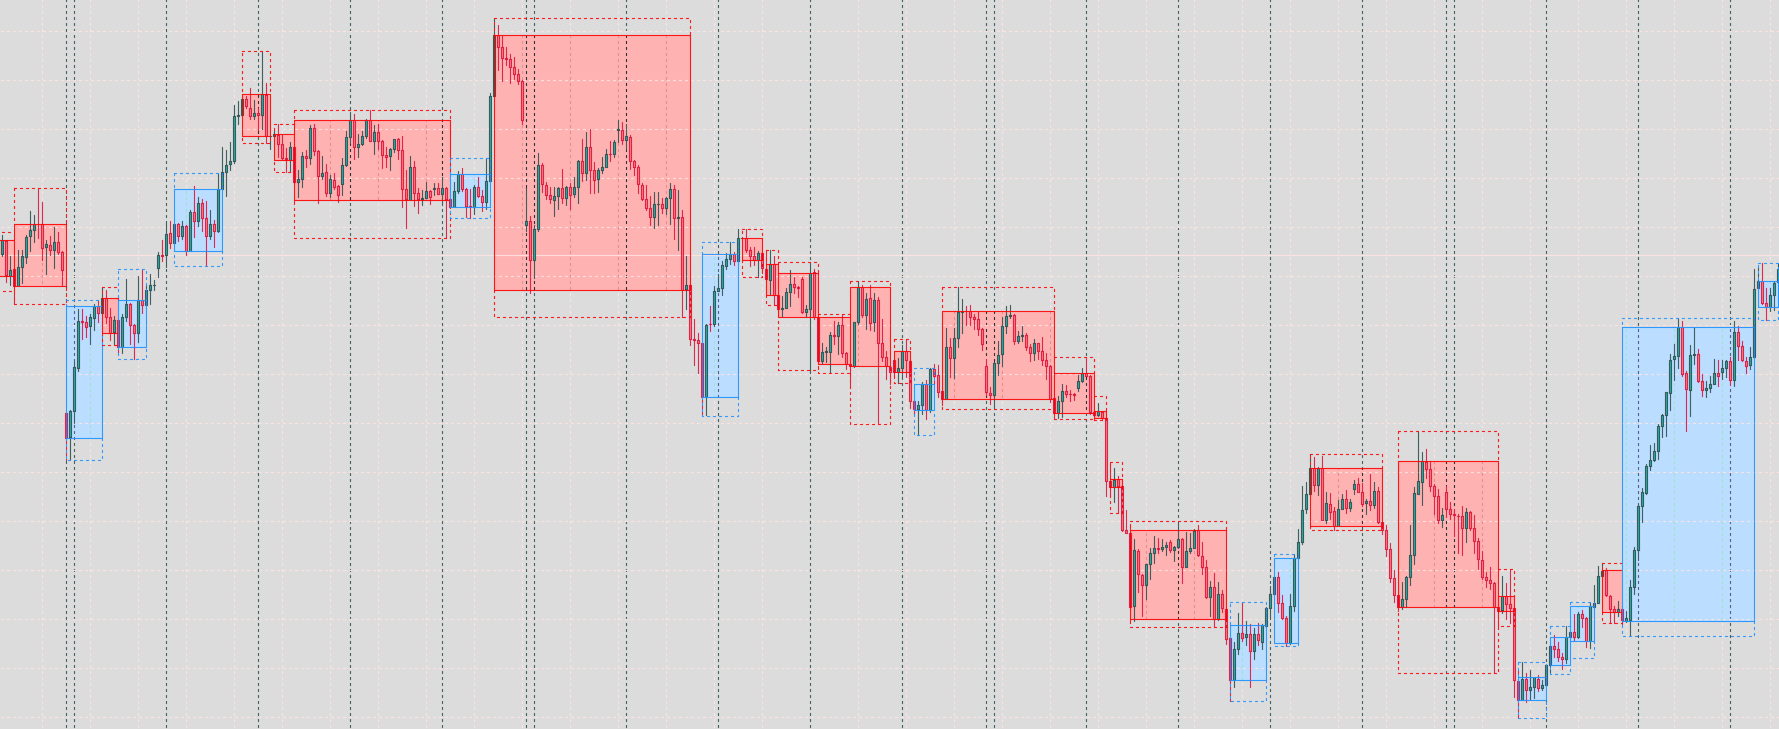
Base Box Indicator automatically detects and draws institutional supply and demand base zones using the Rally-Base-Rally (RBR) and Drop-Base-Drop (DBD) price action methodology — one of the most reliable frameworks for identifying high-probability reversal and continuation areas.
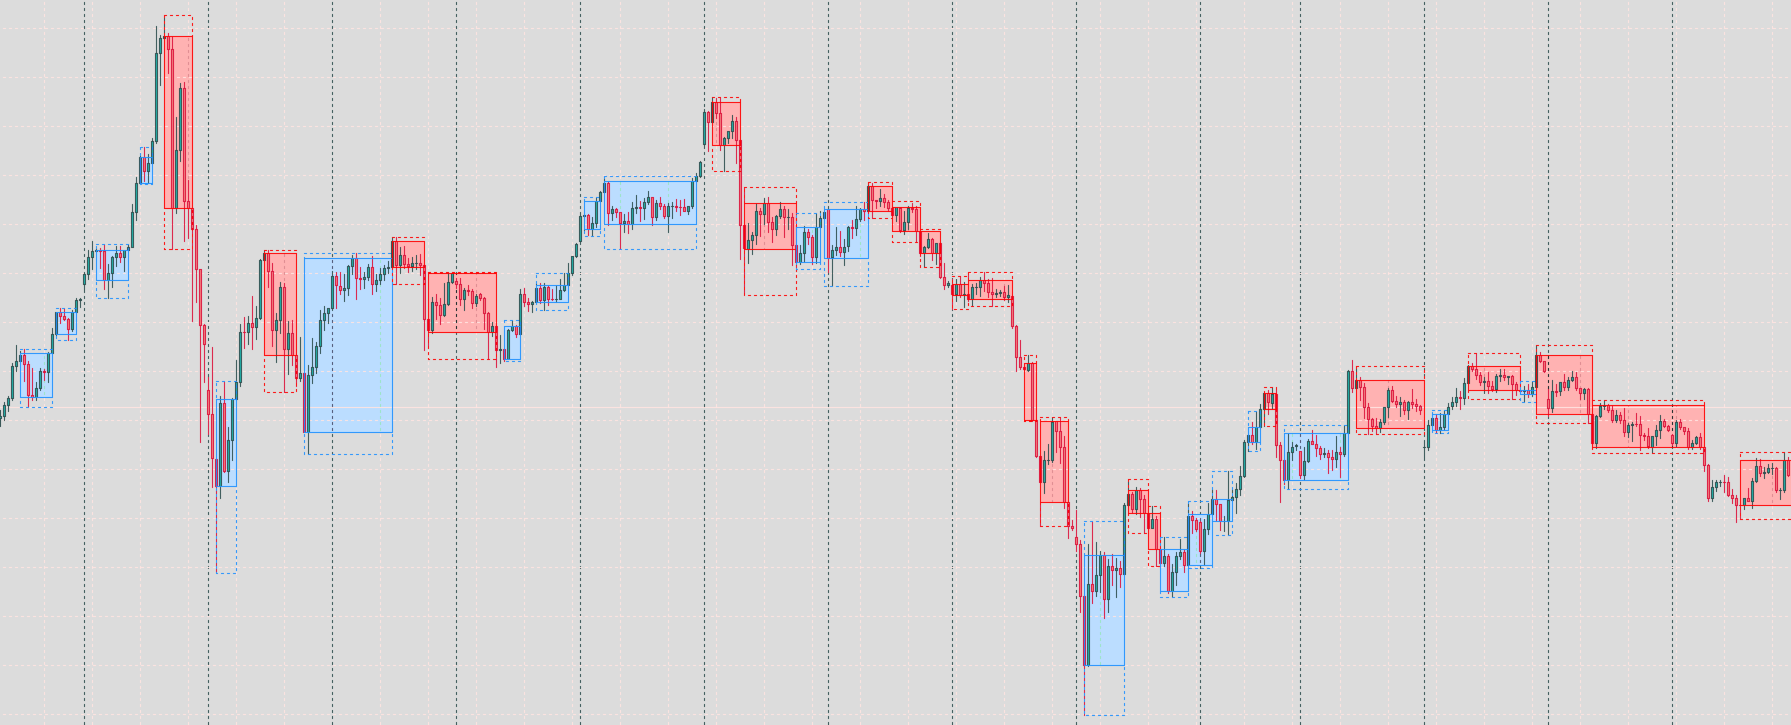
Unlike basic support/resistance tools, this indicator isolates the precise consolidation phase (the "Base") between two impulse moves and renders it as a structured 3-layer box that separates candle bodies from upper and lower wicks. Zones extend dynamically to the right, update in real time, and automatically reclassify if broken from the opposite direction. Multi-Timeframe analysis lets you study higher-timeframe zones on any chart period.
How It Works
RBR (Demand Zone)
- Identify the last bullish candle G in a rally sequence
- Find the first bearish candle that closes below 50% of G's body midpoint — this marks the base entry
- Collect all candles into the zone; body and wick boundaries expand to include every candle
- A confirming bullish candle must close above 50% of the most recent bearish candle's midpoint — the zone is now valid
- The zone extends to the right until a candle body closes more than 50% of its own size beyond either boundary
DBD (Supply Zone) is the exact mirror — starting from the last bearish candle, collecting a bullish base, and confirmed by a bearish close.
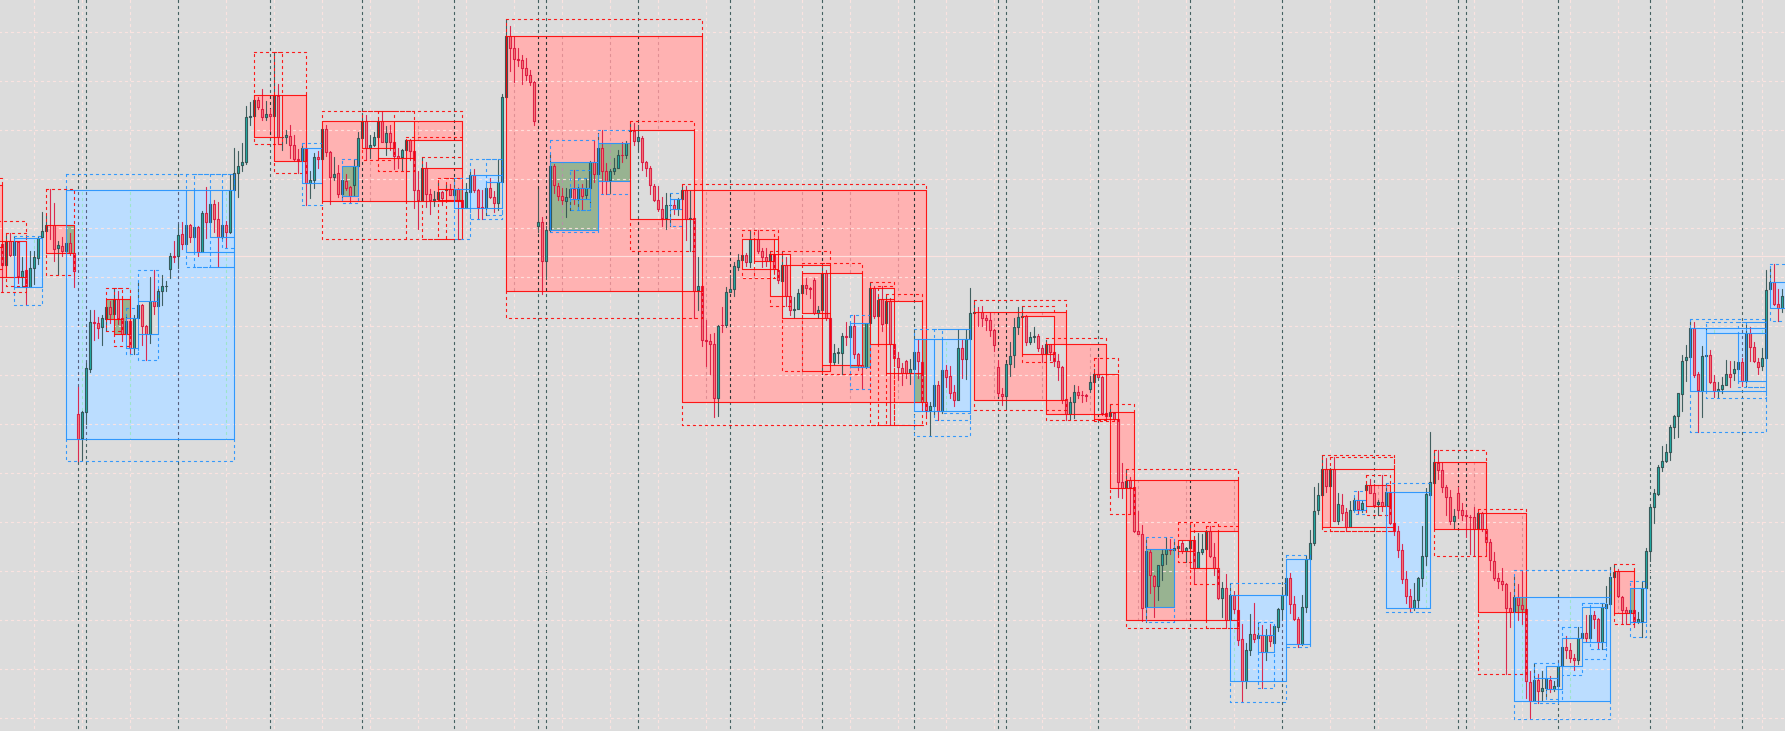
Zone Expansion — if a candle body partially crosses a boundary (≤ 50% outside), the boundary expands to cover that candle's full body and the zone continues. Expansion works in both directions, so a zone can widen upward or downward before ultimately breaking.
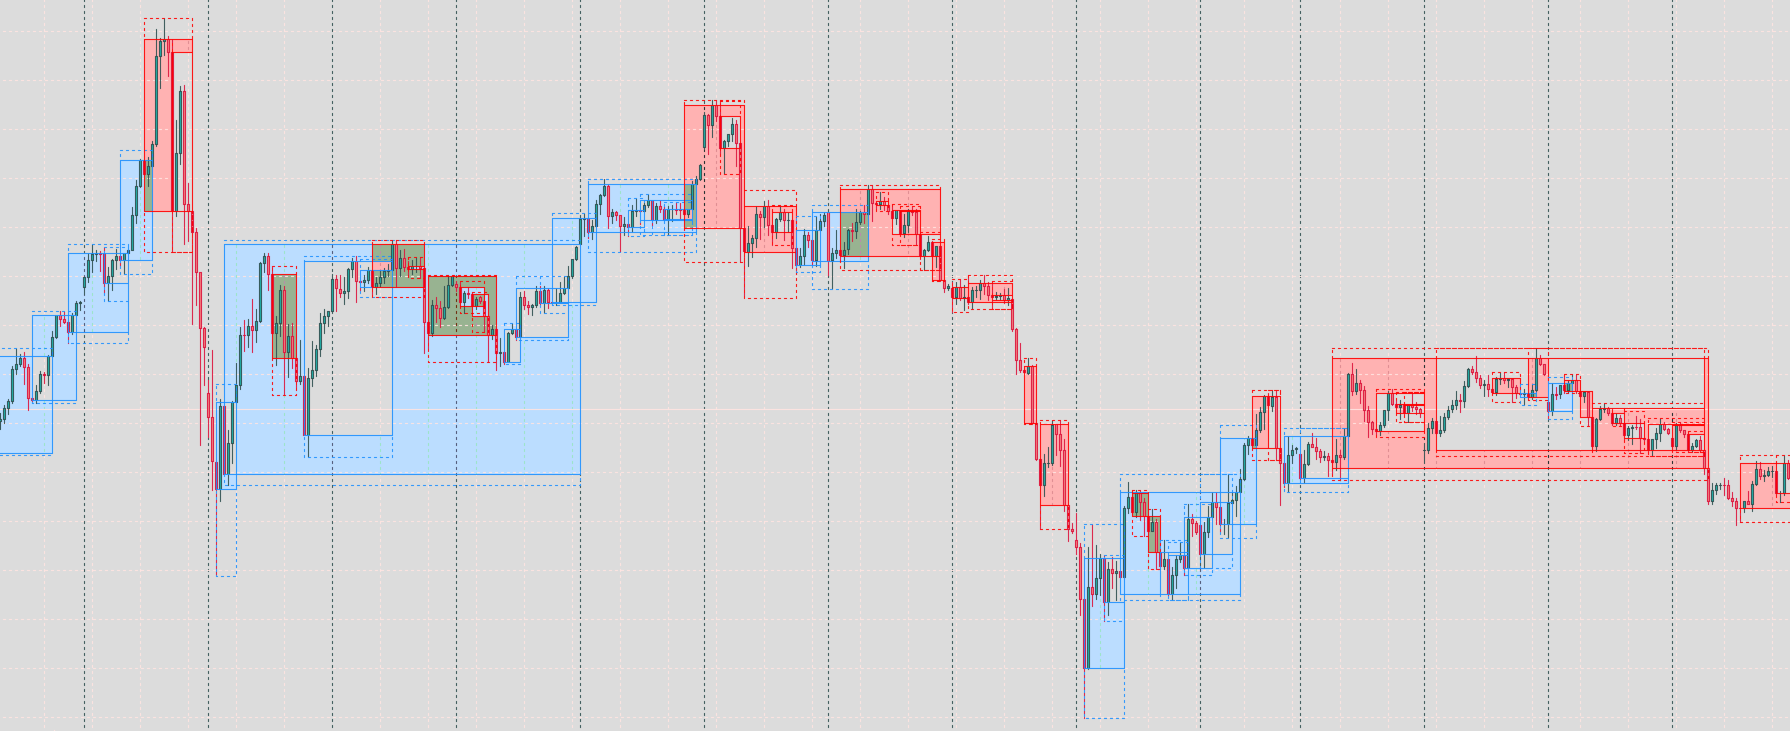
Zone Flip — if an RBR zone is broken downward (> 50% below the lower boundary), it automatically recolors to red and reclassifies as a Rally Base Drop (RBD). A DBD broken upward becomes a Drop Base Rally (DBR) in blue. The broken zone and the new zone are drawn independently.
Overlap Control — when a zone breaks, the scanner can restart from the confirming candle of the broken zone ( AllowOverlap = true ), allowing new nested bases to form inside previous ones, or restart only from the breaking candle ( AllowOverlap = false ) to keep zones strictly non-overlapping.
Key Features
- Multi-Timeframe (MTF) — analyse any timeframe while viewing a different chart period
- Automatic detection — no manual drawing; scans the full lookback window on every tick
- 3-Layer zone rendering — Body zone (solid), Upper wick zone, Lower wick zone drawn in correct z-order so body borders always appear on top
- Bidirectional extension — zones can expand both upward and downward before breaking
- Zone flip logic — RBR ↔ RBD and DBD ↔ DBR automatically reclassify on opposite-side breaks
- Overlap mode toggle — choose nested or non-overlapping zone behaviour
- Real-time alerts — popup, push notification, and Telegram, each firing exactly once per analysis-timeframe bar close
- Fully customisable — colors, fill brightness, wick border style, lookback depth, and extend bars
Alert & Notification System
Alerts trigger when the last closed candle of the analysis timeframe (bar index 1) breaks a zone by more than 50% of its own body size. A deduplication guard ensures each alert fires only once per analysis-timeframe bar close — no repeated messages on every chart tick regardless of which chart timeframe is displayed.