KT Connors RSI MT4
- 지표
-
KEENBASE SOFTWARE SOLUTIONS
 무료 트레이딩 도구, 튜토리얼 및 상세한 제품 사용 가이드를 이용하려면 당사 웹사이트를 방문해 주세요:
https://www.keenbase-trading.com
Keenbase Trading은 전 세계 트레이더들이 사용하는 MetaTrader 4 및 MetaTrader 5용 전문 지표와 전문가 자문 프로그램(EA)을 개발합니다. - 버전: 1.0
- 활성화: 5
KT Connors RSI is a modified and more advanced version of the original Connors RSI developed by Larry Connors. It was designed to help traders generate trade signals based on short-term price movements.
The Connors combine the standard RSI calculation with two additional elements: a short-term RSI, ROC, and a moving average.
Features
- Provides more transparent and more actionable buy and sell signals using the overbought/oversold zones.
- Incorporates short-term RSI and moving average, providing a complete picture of market conditions and trends.
- Filters out false signals by requiring the RSI to reach extreme levels before generating a trade signal.
- Better suited for short-term trading strategies.
- A highly respected trader and analyst, Larry Connors, developed and tested it.
- All Metatrader alerts are included.
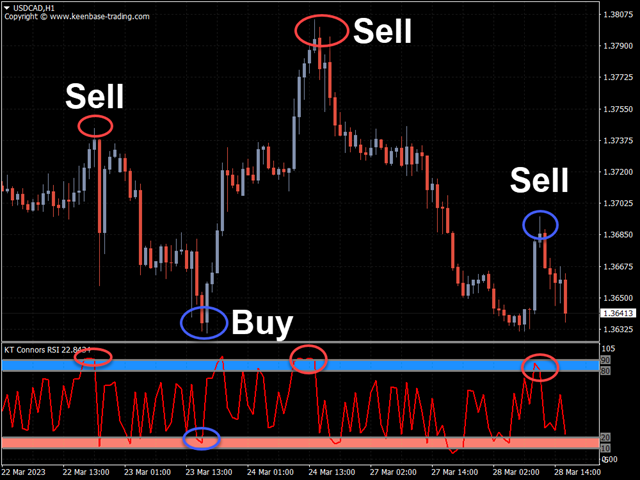
How to Use the KT Connors RSI
Traders can use the CRSI to identify potential buy and sell signals based on extreme levels of the RSI.
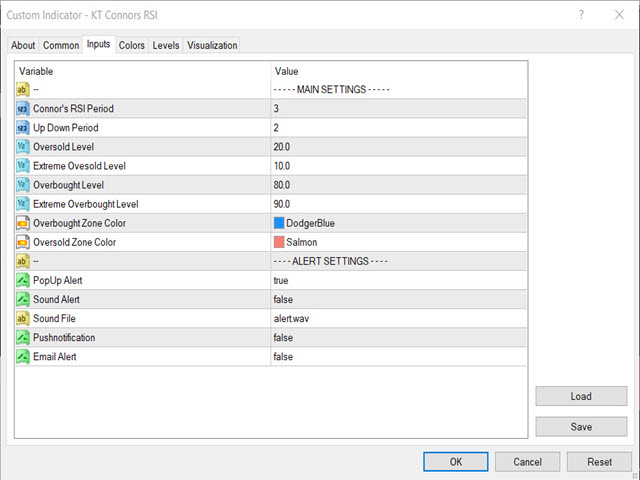
The security is overbought when the CRSI is above 90, and a sell signal is generated. Conversely, when the CRSI is below 10, the deposit is oversold, and a buy signal is generated. We've developed a fully automated Connors RSI EA using a similar strategy.
Traders can also use the CRSI to identify trend reversals. For example, when the CRSI crosses above 50, it indicates a bullish trend reversal; when it crosses below 50, it means a bearish trend reversal.