Obie Scalper Alerts

MT5용 Obie Scalper Alerts 지표는 스캘퍼와 데이 트레이더 모두를 위한 탁월한 매수/매도 신호 도구입니다.

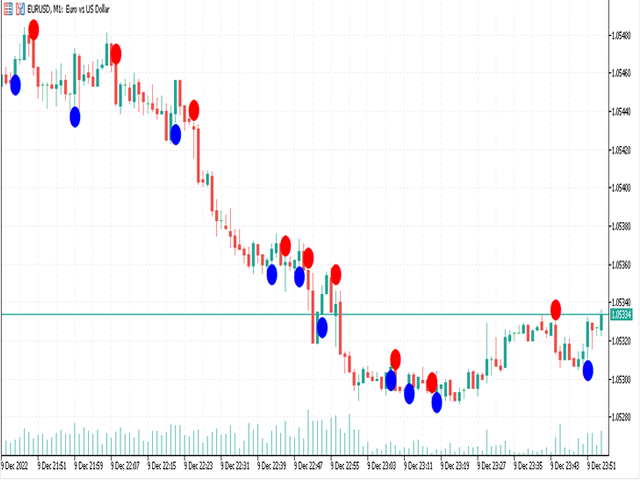
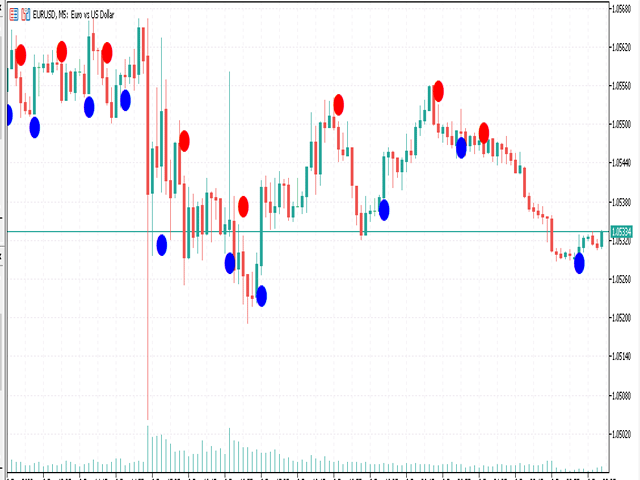
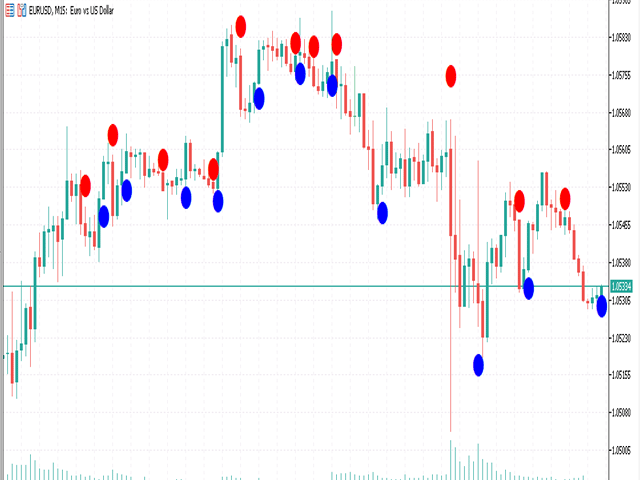
신호는 매우 이해하기 쉽고 기본 차트 창에 파란색과 빨간색 점으로 나타납니다.

구매 및 판매 신호:
파란색 점은 매수 신호입니다.
빨간색 점은 매도 신호입니다.
지표의 다양한 설정과 입력 값을 자유롭게 실험해 보십시오.

이 표시기는 모든 통화 쌍(메이저, 마이너 및 엑조틱)에서 동일하게 잘 작동하며 올바르게 사용하면 유망한 결과를 보여줍니다.

거래 팁:
이 스캘퍼 표시기로 거래할 때 자신이 좋아하는 거래 항목, 손절매 및 이익실현 전략을 자유롭게 사용하십시오.

항상 그렇듯이 전체 추세에 동의하고 이 지표를 완전히 이해할 때까지 먼저 데모 계정에서 연습하십시오.

표시기 사양 및 입력:
거래 플랫폼: Metatrader 5(MT5)용으로 개발됨

거래 상품: Forex, 주식, 상품, 주가 지수, 귀금속, 에너지 및 주식에 대한 작업

시간 프레임: 모든 시간 프레임에서 작동

거래 스타일: 스캘핑, 데이 트레이딩 및 스윙 트레이딩에 사용

입력 매개변수: 변수(입력 탭), 색상 설정 및 스타일

표시기 유형: 신호

표시기가 다시 칠합니까? 아니.
추천 제품
WaveTrend Oscillator Indicator for MT5
Mohammad Taher Halimi Tabrizi
Introduction The Wave Trend Oscillator Indicator for MT5 is one of the well known indicators in the market, helping traders find strong entry points into the market. Like any other MetaTrader 5 indicator , it can produce both good and bad signals, but the number of accurate buy/sell signals is significantly higher than the weak ones. This makes it a powerful tool for improving your forex trading strategy , whether you are a beginner or an advanced trader. How does this indicator work? This indic
SPECIAL LAUNCH OFFER: $30 (1-Month Rent) Limited time offer to build our community and gather feedback! AmbM GOLD Institutional Scalper A high-precision M5 algorithm for XAUUSD (Gold) , engineered to trade exclusively at Institutional Liquidity Levels ($5/$10 psychological marks). PERFORMANCE DATA (BUY ONLY) • Win Rate: 87.09%. • Safe Growth: +$4,113 profit on $10k (13.75% Max Drawdown). • Extreme Stress Test: Successfully generated +$22,997 in a 5-year stress test (2020-2026), proving
Boom kerdoskopos
David Chokumanyara
Boom Kerdoskopos Indicator – Sell With Confidence The Boom Kerdoskopos Indicator is a scalper’s dream for Boom markets on M1 timeframe . Built to protect you from spikes, it gives precise yellow down arrows for sell entries and red cross exit signals so you always know when to enter and leave the trade. With smart alerts (audible, push, email), you can trade stress-free and secure 8–10 safe candles every time. It’s perfect for scalpers who want fast, consistent profits. Why Traders Choose
Visual Range Directional Force Indicator
AL MOOSAWI ABDULLAH JAFFER BAQER
Range Directional Force Indicator – Designed for You to Optimize! The Range Directional Force Indicator is a cutting-edge tool designed to empower traders by visualizing market dynamics and directional strength. Built to offer insights into market trends and reversals, this indicator is an invaluable asset for traders seeking precision in their strategies. However, it is important to note that this indicator is not optimized, leaving room for you to tailor it to your unique trading preferences.
Max Min Delta Indicator - Market Volume Imbalance Analysis Gain Deeper Insights into Market Volume Imbalance with Delta Analysis What is the Max Min Delta Indicator? The Max Min Delta Indicator is a powerful market volume analysis tool that visually represents maximum and minimum delta values using a histogram. It helps traders identify market strength, weakness, absorption, and aggressive buying/selling activity with precision. Key Features Histogram Visualization: Displays Max Delta (Green) an
우리의   Basic Support and Resistance   표시기는 기술 분석을 향상시키는 데 필요한 솔루션입니다.이 표시기는 차트/ MT4 버전 특징 피보나치 수준의 통합 : 지원 및 저항 수준과 함께 피보나치 수준을 표시하는 옵션과 함께, 우리의 지표는 시장 행동과 가능한 역전 영역에 대한 더 깊은 통찰력을 제공합니다. 성능 최적화 : 각 막대의 개구부에서만 확장 라인을 업데이트하는 옵션을 사용하여, 우리의 지표는 지원 및 저항 수준의 정확도를 희생하지 않고 최적의 성능을 보장합니다. 입력 주요 설정 Timeframe:  이 입력을 통해 차트에 더 높은 기간의 지지선과 저항선을 표시하도록 선택할 수 있습니다. Support/Resistance Strength [Number of Bars]:   이 입력을 사용하면 지지대와 저항의 강도를 결정할 수 있습니다.숫자가 높을수록지지/저항이 더 강해집니다. Price mode:  이 매개 변수를 사용하면 지원 및 저항 수준을
Liquidity Oscillator
Paolo Scopazzo
3 (2)
A powerful oscillator that provide Buy and Sell signals by calculating the investor liquidity. The more liquidity the more buy possibilities. The less liquidity the more sell possibilities. Please download the demo and run a backtest! HOW IT WORKS: The oscillator will put buy and sell arrow on the chart in runtime only . Top value is 95 to 100 -> Investors are ready to buy and you should follow. Bottom value is 5 to 0 -> Investors are ready to sell and you should follow. Alert + sound will appe
Trend Master V2
Oratile Pitsoane
What Is Trend Master Pro? Trend Master Pro   is a professional-grade trend trading indicator built for MetaTrader 5. It was designed with one goal in mind — to keep you on the right side of the market at all times by combining three powerful technical tools into a single, clean, easy-to-read display directly on your price chart. Instead of cluttering your screen with multiple separate indicators, Trend Master Pro fuses an   EMA Ribbon trend filter , a   ZigZag swing point engine , and a   breako
Matrix Currency
Augusto Martins Lopes
Matrix Currency – Multi-Timeframe Analysis Tool The Matrix Currency is an advanced indicator designed to analyze currency strength in the Forex market. It provides efficient monitoring and strategic support for traders seeking clear and actionable insights. Key Features Multi-Timeframe Analysis : Simultaneously monitors multiple timeframes (from M1 to MN1) with real-time updates, displayed in an intuitive matrix format. Alert System : Customizable notifications via pop-up, email, and mobile devi
FREE
DYJ BoS
Daying Cao
DYJ BoS 지표는 다음을 포함하여 시장 구조 변화의 필수 요소를 자동으로 식별하고 표시합니다. 구조 돌파(BoS): 가격이 크게 움직여 이전 구조 지점을 돌파할 때 감지됩니다. 상승 추세선과 하락 추세선(UP & DN, 즉 연속적인 신고가와 신저가)을 표시하고, 가격이 이러한 선을 돌파하면 빨간색(BEAR)과 초록색(BULL) 화살표를 표시합니다. BoS는 일반적으로 가격이 이전 가격 움직임에 의해 확립된 스윙 저점이나 스윙 고점을 확실히 통과할 때 발생합니다. 가격이 스윙 하이보다 높거나 스윙 로우보다 낮게 움직일 경우, 이는 단순히 이전에 형성된 시장 구조를 깨는 것이므로 "브레이크아웃" 구조라고 합니다. 이는 종종 시장 심리와 추세 방향의 변화를 나타내며, 기존 추세가 지속되거나 새로운 추세가 시작됨을 알립니다. 일반적으로 마감 정확도를 높이기 위해 손절매와 이익실현을 설정하지 않는 것이 좋습니다. 최종 포지션은 일반적으로 같은 방향의 다음 돌파점에서 마감되거나 반
Level Volume Pro
John Samfel Bucton Josol
HAT IT DOES   MONTHLY HIGH & LOW — AUTO-DRAWN EVERY MONTH Draws the High and Low of every month for the current year (or any year you set). Each level extends as a horizontal ray into the future so you always see where price is reacting to historical monthly extremes. Color-coded (blue = high, red = low), labeled (JAN HIGH, FEB LOW etc.), fully customizable width and style. Toggle individual months on or off.   WEEKLY HIGH & LOW
SMC Venom Model BPR 지표는 Smart Money(SMC) 개념 내에서 일하는 트레이더를 위한 전문 도구입니다. 가격 차트에서 두 가지 주요 패턴을 자동으로 식별합니다. FVG (공정 가치 갭)는 3개의 캔들의 조합으로, 첫 번째와 세 번째 캔들 사이에 갭이 있습니다. 이는 볼륨 지원이 없는 레벨 사이에 구역을 형성하여 종종 가격 수정으로 이어집니다. BPR (균형 가격 범위)은 두 개의 FVG 패턴의 조합으로, "브리지"를 형성합니다. 이는 가격이 낮은 볼륨 활동으로 움직일 때 브레이크아웃과 레벨로의 복귀 구역으로, 캔들 사이에 갭을 생성합니다. 이러한 패턴은 거래자가 차트에서 거래량과 가격 역학을 분석하여 주요 지지/저항 수준, 돌파 구역 및 진입 지점을 식별하는 데 도움이 되며, 여기서 대형 시장 참여자와 일반 참여자 간의 상호 작용이 발생합니다. 이 지표는 사각형과 화살표 형태로 패턴을 시각화하며 유연한 경고 설정도 지원합니다. 주요 특징: 패턴 표시 모드
Advanced Fibonacci
Marius Ovidiu Sunzuiana
Fibonacci Advanced Indicator – Precision Meets Intelligence The Fibonacci Advanced Indicator is a cutting-edge technical analysis tool designed for traders who demand more than conventional retracement levels. Built on the foundational principles of Fibonacci mathematics, this indicator transcends tradition by integrating dynamic market behavior , multi-timeframe analysis , and adaptive algorithms to deliver high-probability trading zones with surgical accuracy. 1. Multiple Fibonacci Levels
Noize Absorption Index
Ekaterina Saltykova
Noize Absorption Index - is the manual trading system that measures the difference of pressure between bears forces and bulls forces. Green line - is a noize free index that showing curent situation. Zero value of index shows totally choppy/flat market.Values above zero level shows how powerfull bullish wave is and values below zero measures bearish forces.Up arrow appears on bearish market when it's ready to reverse, dn arrow appears on weak bullish market, as a result of reverse expectation.
KT Renko Patterns MT5
KEENBASE SOFTWARE SOLUTIONS
KT Renko Patterns는 렌코 차트를 벽돌 하나하나 분석하여, 전 세계 다양한 금융 시장에서 트레이더들이 자주 사용하는 유명한 차트 패턴들을 찾아냅니다. 시간 기반 차트와 비교하면, 렌코 차트는 시각적으로 단순하고 깔끔하여 패턴 중심의 트레이딩이 훨씬 쉽게 가능합니다. KT Renko Patterns에는 다양한 렌코 패턴이 포함되어 있으며, 이 중 상당수는 Prashant Shah의 저서 『Profitable Trading with Renko Charts』에서 자세히 설명되어 있습니다. KT Renko Patterns 인디케이터를 기반으로 한 100% 자동화된 EA는 여기에서 이용할 수 있습니다 - KT Renko Patterns EA . 기능 소개 최대 8개의 명확한 렌코 패턴을 거래할 수 있어, 혼동 없이 신뢰도 높은 트레이딩이 가능합니다. 객관성을 제공하기 위해 각 패턴에는 손절선과 피보나치 목표가 함께 제공됩니다. KT Renko Patterns는 각 패턴의 정
Triangle Pattern Gann v3.1 - Complete Feature Documentation Core Functionality OverviewTriangle Pattern Gann v3.1 is a sophisticated MetaTrader 5 indicator that combines W.D. Gann's geometric trading principles with advanced triangle pattern recognition to deliver actionable trading signals. Primary Features1. Triangle Pattern Detection SystemAscending Triangle Recognition Function: Automatically identifies bullish continuation patterns Detection Criteria: Flat horizontal resistance line
Market Session Visual
Kambiz Shahriarynasab
The  Market Sessions Indicator for MT5 helps you  predict market turnarounds  by detecting major supply and demand areas. These pivot points tend to occur after a new session has started and the previous one is still open. It is also used to gauge how many points or pips the market moves on average during a session. This helps us to place better our take profits and stop losses. The indicator works on all forex pairs, gold, silver, commodities, stocks, indices and any other instrument that you
Fibonacci Bollinger Bands Indicator for MT5 The Fibonacci Bollinger Bands Indicator for MetaTrader 5 (MT5) is a powerful trading tool that combines the strength of Bollinger Bands with Fibonacci retracement levels . Since price often reacts strongly to Fibonacci levels, this indicator helps traders identify high-probability reversal zones and breakout opportunities. Key Features & Inputs Bollinger Bands Length – customizable parameter for band calculation. Price Mode Selection – choose from C
Multi ZigZag
Jose Freitas Alves Neto
# Indicador MultiZigZag Pro para MetaTrader 5 O MultiZigZag Pro é um poderoso indicador técnico para a plataforma MetaTrader 5 que identifica, de forma inteligente e flexível, os principais pontos de inflexão e tendências nos gráficos de preços. ## Características principais: - Algoritmo avançado que filtra ruídos e movimentos irrelevantes do mercado  - Múltiplos timeframes para análise de tendências de curto a longo prazo - Parâmetros de profundidade e desvio personalizáveis para adaptação a
Gartley Projections D
Oleksandr Medviediev
3 (2)
The indicator identifies the harmonic patterns (XABCD) according to developments of H.M.Gartley ( "Profits in the Stock Market" , 1935г). It projects D-point as a point in the perspective projection (specify ProjectionD_Mode = true in the settings). Does not redraw. When a bar of the working timeframe closes, if the identified pattern point has not moved during Patterns_Fractal_Bars bars, an arrow appears on the chart (in the direction of the expected price movement). From this moment on, the ar
Trading hours, Market hours, Business hours, Forex trading hours, Trading schedule, Market open/close times, Trading time zones, Time zone indicators, Market clock, ICT, Asia KillZone, London Killzone, New York Killzone **Prices tend to move and form every 2 - 4 hours.** Traders should pay attention to the impact of trading time zones, as different market hours and trading volumes can directly affect the volatility and trading opportunities of a currency pair. To help traders understand the m
UT Bot Simple
Bartlomiej Tadeusz Tomaja
**Features:** 1. **Innovative Trend Tracking:** The UT BOT Simple Indicator leverages the power of the Average True Range (ATR), a renowned volatility measure, to calculate precise trailing stop values, providing unparalleled insights into market trends. 2. **Customizable Settings:** Flexibility is paramount in any trading strategy. With this in mind, our indicator allows you to adjust the ATR periods and other key parameters to tailor the tool to your trading style and strategy. 3. **Real-t
Trade smarter, not harder: Empower your trading with Harmonacci Patterns This is arguably the most complete harmonic price formation auto-recognition indicator you can find for the MetaTrader Platform. It detects 19 different patterns, takes fibonacci projections as seriously as you do, displays the Potential Reversal Zone (PRZ) and finds suitable stop-loss and take-profit levels. [ Installation Guide | Update Guide | Troubleshooting | FAQ | All Products  ] It detects 19 different harmonic pric
Provided Trend
Nadiya Mirosh
Provided Trend is a complex signal formation indicator. As a result of the work of internal algorithms, you can see only three types of signals on your chart. The first is a buy signal, the second is a sell signal, and the third is a market exit signal. Options: CalcFlatSlow - The first parameter that controls the main function of splitting the price chart into waves. CalcFlatFast - The second parameter that controls the main function of splitting the price chart into waves. CalcFlatAvg - Para
Fibaction
Abdelkhalek Orabi
Indicator Name: Fibaction – price action candle Detector Description: Fibo Signal Boxes is a powerful Smart Money Concept (SMC)-inspired indicator that auto-detects price action candles. bullish hammers and shooting stars, then draws precise Fibonacci entry zones and multiple take-profit levels directly on the chart. as for the SL personally i use 40 pips rules  Key Features: Detects bullish hammer and shooting star reversal candles. Automatically draws Fibonacci entry and TP boxes. as
Stop being the Liquidity. Start being the Hunter! Most retail traders fail because they don't see where the real orders are sitting. Titan Liquidity & Gap Hunter is an elite-grade analytical tool designed to expose the "Invisible Targets" on your chart. It automates the detection of institutional gaps and high-probability liquidity pools, transforming your chart into a professional hunting ground. The Hunter’s Arsenal: Automated Market Structure (BOS/CHOCH): Instantly identifies trend shifts
Introducing the Bollinger Flipper Indicator – Your Ultimate Trading Edge!   Are you tired of second-guessing your entries and exits? The Bollinger Flipper Indicator is here to flip the game in your favor.   Built with the power of Bollinger Bands + Level 3 Power System + ZigZag Fractals, this advanced tool is designed to spot high-probability buy & sell signals with precision. SPECIAL BONUS (VALID TILL JUNE 2026)- OUR DAILY SCALPER EA for BTCUSD and VIX75 •································
HMA Trend Professional MT5
Pavel Zamoshnikov
4.25 (4)
Improved version of the free HMA Trend indicator (for MetaTrader 4) with statistical analysis. HMA Trend is a trend indicator based on the Hull Moving Average (HMA) with two periods. HMA with a slow period identifies the trend, while HMA with a fast period determines the short-term movements and signals in the trend direction. The main differences from the free version: Ability to predict the probability of a trend reversal using analysis of history data. Plotting statistical charts for analyzi
Harmonic Pattern Hunter
Shingidzano Lesetedi
Harmonic Pattern Hunter Harmonic Pattern Hunter is a technical indicator for MetaTrader 5 that automatically identifies and draws high-probability harmonic patterns directly on the chart. It is designed to assist traders who use harmonic analysis as part of their trading methodology. How It Works The indicator scans historical and live price data for completed XABCD harmonic structures using Fibonacci ratio validation. When a valid pattern is detected, it draws the full pattern geometry, marks t
이 제품의 구매자들이 또한 구매함
ARIPoint
Temirlan Kdyrkhan
ARIPoint is a powerful trading companion designed to generate high-probability entry signals with dynamic TP/SL/DP levels based on volatility. Built-in performance tracking shows win/loss stats, PP1/PP2 hits, and success rates all updated live. Key Features: Buy/Sell signals with adaptive volatility bands Real-time TP/SL/DP levels based on ATR Built-in MA Filter with optional ATR/StdDev volatility Performance stats panel (Success, Profit/Loss, PP1/PP2) Alerts via popup, sound, push, or email Cu
Divergence Bomber
Ihor Otkydach
4.9 (87)
이 지표를 구매하신 분께는 다음과 같은 혜택이 무료로 제공됩니다: 각 거래를 자동으로 관리하고, 손절/익절 수준을 설정하며, 전략 규칙에 따라 거래를 종료하는 전용 도우미 툴 "Bomber Utility" 다양한 자산에 맞게 지표를 설정할 수 있는 셋업 파일(Set Files) "최소 위험", "균형 잡힌 위험", "관망 전략" 모드로 설정 가능한 Bomber Utility의 셋업 파일 이 전략을 빠르게 설치, 설정, 시작할 수 있도록 돕는 단계별 영상 매뉴얼 주의: 위의 모든 보너스를 받기 위해서는 MQL5 개인 메시지 시스템을 통해 판매자에게 연락해 주세요. 독창적인 커스텀 지표인 “Divergence Bomber(다이버전스 봄버)”를 소개합니다. 이 지표는 MACD 다이버전스(괴리) 전략을 기반으로 한 올인원(All-in-One) 거래 시스템입니다. 이 기술 지표의 주요 목적은 가격과 MACD 지표 간의 다이버전스를 감지하고, **향후 가격이 어느 방향으로 움직일지를 알려주는
SignalTech MT5
Yue Wang
5 (18)
SignalTech MT5 is a fully rule based trading system for EURUSD, USDCHF, USDJPY, AUDUSD, NZDUSD, EURJPY, AUDJPY, NZDJPY, CADJPY.  All the winning trades with chart setups are published on the comments page. 2025-12 1174 Pips 2026-01 2624 Pips 2026-02 2937 Pips 2026-03 2165 Pips 2026-04 2243 Pips It can generate signals with Buy/Sell Arrows and Pop-Up/Sound Alerts. Each signal has clear Entry and Stop Loss levels, which should be automatically flagged on the chart, as well as potential Targets 1,
Azimuth Pro
Ottaviano De Cicco
5 (7)
Azimuth Pro V2: Synthetic Fractal Structure and Confirmed Entries for MT5 Overview Azimuth Pro is a multi-level swing structure indicator by Merkava Labs . Four nested swing layers, swing-anchored VWAP, ABC pattern detection, three-timeframe structural filtering, and closed-bar confirmed entries — one chart, one workflow from micro-swings to macro-cycles. This is not a blind signal product. It is a structure-first workflow for traders who care about location, context, and timing. V2 Launch Offe
Quantum TrendPulse
Bogdan Ion Puscasu
5 (23)
SuperTrend   ,   RSI   ,   Stochastic   의 힘을 하나의 포괄적인 지표로 결합하여 트레이딩 잠재력을 극대화하는 궁극의 트레이딩 도구   인 Quantum TrendPulse를   소개합니다. 정밀성과 효율성을 추구하는 트레이더를 위해 설계된 이 지표는 시장 추세, 모멘텀 변화, 최적의 진입 및 종료 지점을 자신 있게 식별하는 데 도움이 됩니다. 주요 특징: SuperTrend 통합:   주요 시장 추세를 쉽게 따라가고 수익성의 물결을 타세요. RSI 정밀도:   매수 과다 및 매도 과다 수준을 감지하여 시장 반전 시점을 파악하는 데 적합하며 SuperTrend 필터로 사용 가능 확률적 정확도:   변동성이 큰 시장에서 숨겨진 기회를 찾기 위해 확률적 진동   을 활용하고 SuperTrend의 필터로 사용 다중 시간대 분석:   M5부터 H1 또는 H4까지 다양한 시간대에 걸쳐 시장을 최신 상태로 유지하세요. 맞춤형 알림:   맞춤형 거래 조건이 충족되면
Meridian Pro
Ottaviano De Cicco
5 (1)
Meridian Pro 2.00: Professional Multi-Timeframe Trend Matrix for MT5 Meridian Pro 2.00 is a professional adaptive trend matrix for MetaTrader 5. It combines the original Meridian trend engine, a clean chart ribbon, closed-bar signal arrows, an 8-timeframe dashboard, Fuel momentum, weighted consensus, synthetic HTF processing and chart-native higher-timeframe context lines. The goal is simple: read current trend, multi-timeframe structure, strength, momentum and EA-ready state from one discipline
소개       Quantum Breakout PRO   , 브레이크아웃 존 거래 방식을 변화시키는 획기적인 MQL5 지표! 13년 이상의 거래 경험을 가진 숙련된 트레이더 팀이 개발한       퀀텀 브레이크아웃 PRO       혁신적이고 역동적인 브레이크아웃 존 전략으로 거래 여정을 새로운 차원으로 끌어올리도록 설계되었습니다. Quantum Breakout Indicator는 5개의 이익 목표 영역이 있는 브레이크아웃 영역의 신호 화살표와 브레이크아웃 상자를 기반으로 한 손절 제안을 제공합니다. 초보자 거래자와 전문 거래자 모두에게 적합합니다. Quantum EA 채널:       여기를 클릭하세요 중요한! 구매 후 설치 매뉴얼을 받으려면 개인 메시지를 보내주십시오. 추천: 기간: M15 통화쌍: GBPJPY, EURJPY, USDJPY,NZDUSD, XAUUSD 계정 유형: 스프레드가 매우 낮은 ECN, Raw 또는 Razor 브로커 시간: GMT +3 중개인 :
Btmm state engine pro
Garry James Goodchild
5 (4)
BTMM State Engine Pro is a MetaTrader 5 indicator for traders who use the Beat The Market Maker approach: Asian session context, kill zone timing, level progression, peak formation detection, and a multi-pair scanner from a single chart. It combines cycle state logic with a built-in scanner dashboard so you do not need the same tool on many charts at once. What it does Draws the Asian session range; session times can follow broker server offset or be set in inputs. Tracks level progression (L
Grabber System MT5
Ihor Otkydach
4.83 (23)
탁월한 기술적 지표인 Grabber를 소개합니다. 이 도구는 즉시 사용 가능한 “올인원(All-Inclusive)” 트레이딩 전략으로 작동합니다. 하나의 코드 안에 강력한 시장 기술 분석 도구, 매매 신호(화살표), 알림 기능, 푸시 알림이 통합되어 있습니다. 이 인디케이터를 구매하신 모든 분들께는 다음의 항목이 무료로 제공됩니다: Grabber 유틸리티: 오픈 포지션을 자동으로 관리하는 도구 단계별 영상 매뉴얼: 설치, 설정, 그리고 실제 거래 방법을 안내 맞춤형 세트 파일: 인디케이터를 빠르게 자동 설정하여 최고의 성과를 낼 수 있도록 도와줍니다 다른 전략은 이제 잊어버리세요! Grabber만이 여러분을 새로운 트레이딩의 정점으로 이끌어 줄 수 있습니다. Grabber 전략의 주요 특징: 거래 시간 프레임: M5부터 H4까지 거래 가능한 자산: 어떤 자산이든 사용 가능하지만, 제가 직접 테스트한 종목들을 추천드립니다 (GBPUSD, GBPCAD, GBPCHF, AUDCAD, AU
우선적으로, 이 거래 도구는 전문적인 거래에 이상적인 비-다시 그리기 및 지연되지 않는 지표입니다.  온라인 강좌, 사용자 매뉴얼 및 데모. 스마트 가격 액션 컨셉트 인디케이터는 신규 및 경험 많은 트레이더 모두에게 매우 강력한 도구입니다. Inner Circle Trader Analysis 및 Smart Money Concepts Trading Strategies와 같은 고급 거래 아이디어를 결합하여 20가지 이상의 유용한 지표를 하나로 결합합니다. 이 인디케이터는 스마트 머니 컨셉트에 중점을 두어 대형 기관의 거래 방식을 제공하고 이동을 예측하는 데 도움을 줍니다.  특히 유동성 분석에 뛰어나 기관이 어떻게 거래하는지 이해하는 데 도움을 줍니다. 시장 트렌드를 예측하고 가격 변동을 신중하게 분석하는 데 탁월합니다. 귀하의 거래를 기관 전략에 맞추어 시장의 동향에 대해 더 정확한 예측을 할 수 있습니다. 이 인디케이터는 시장 구조를 분석하고 중요한 주문 블록을 식별하고 다양
OmniSync Projection
Antonio-alin Teculescu
5 (1)
Chronos Fractal Engine is an innovative price projection indicator for MetaTrader 5, designed to transform your technical analysis by intelligently identifying and projecting historical price patterns. Built upon an advanced correlation algorithm and the fractal principles of the market, this powerful tool visualizes potential future price movements, giving you a unique edge in your trading decisions. What is Chronos Fractal Engine? At its core, the Chronos Fractal Engine employs a sophisticat
" Dynamic Scalper System MT5 " 지표는 추세 파동 내에서 스캘핑 방식으로 거래하도록 설계되었습니다. 주요 통화쌍 및 금에서 테스트되었으며, 다른 거래 상품과의 호환성이 가능합니다. 추가적인 가격 변동 지원을 통해 추세에 따라 단기 포지션 진입 신호를 제공합니다. 지표의 원리 큰 화살표는 추세 방향을 결정합니다. 작은 화살표 형태의 스캘핑 신호를 생성하는 알고리즘은 추세 파동 내에서 작동합니다. 빨간색 화살표는 상승 방향을, 파란색 화살표는 하락 방향을 나타냅니다. 민감한 가격 변동선은 추세 방향으로 그려지며, 작은 화살표의 신호와 함께 작용합니다. 신호는 다음과 같이 작동합니다. 적절한 시점에 선이 나타나면 진입 신호가 형성되고, 선이 있는 동안 미결제 포지션을 유지하며, 완료되면 거래를 종료합니다. 권장되는 작업 시간대는 M1~H4입니다. 화살표는 현재 캔들에 형성되며, 다음 캔들이 이미 시작되었더라도 이전 캔들의 화살표는 다시 그려지지 않습니다. 입
Gartley Hunter Multi
Siarhei Vashchylka
5 (11)
Gartley Hunter Multi - An indicator for searching for harmonic patterns simultaneously on dozens of trading instruments and on all possible timeframes. Manual (Be sure to read before purchasing) | Version for MT4 Advantages 1. Patterns: Gartley, Butterfly, Shark, Crab. Bat, Alternate Bat, Deep Crab, Cypher 2. Simultaneous search for patterns on dozens of trading instruments and on all possible timeframes 3. Search for patterns of all possible sizes. From the smallest to the largest 4. All fou
Trend Forecaster
Alexey Minkov
5 (7)
Trend Forecaster – Since 2023. The Trend Forecaster indicator utilizes a unique proprietary algorithm to determine entry points for a breakout trading strategy. The indicator identifies price clusters, analyzes price movement near levels, and provides a signal when the price breaks through a level. The Trend Forecaster indicator is suitable for all financial assets, including currencies (Forex), metals, stocks, indices, and cryptocurrencies. You can also adjust the indicator to work on any time
KT Alpha Hunter Arrows MT5
KEENBASE SOFTWARE SOLUTIONS
대부분의 화살표 인디케이터는 신호만 보여주고, 나머지 판단은 모두 트레이더에게 맡깁니다. KT Alpha Hunter Arrows는 완성된 트레이딩 플랜을 제공합니다. 각 신호 화살표가 표시될 때마다 진입선, 손절선, 네 개의 익절 목표, 그리고 현재 심볼과 시간대가 지금 거래할 가치가 있는지 알려주는 실시간 엣지 판정이 함께 그려집니다. 포함된 Trade Manager EA는 사용자가 직접 진입한 뒤의 실행 관리를 맡아, 시장이 흔들리고 감정이 개입되기 쉬운 상황에서도 거래 원칙을 유지할 수 있도록 도와줍니다. 리페인트 없음. 종가 확정 후 신호만 표시. Forex, Gold, Indices 및 사용자가 거래하는 다양한 MT5 지원 상품에 맞게 설계되었습니다. 주요 기능 캔들이 마감된 후에만 표시되는 리페인트 없는 매수 및 매도 화살표. 각 신호마다 진입선, 구조적 손절선, 네 개의 익절 목표 표시. 현재 차트에서 매수와 매도 셋업을 별도로 평가하는 Edge Dashboard.
OrderFlux | MetaTrader 5용 풋프린트 오더플로우 버전 2.0 – 액티브 트레이더를 위한 실시간 Bid/Ask 시각화 OrderFlux는 MT5를 위한 풋프린트 및 오더플로우 지표입니다. 가격이 어디로 이동했는지뿐만 아니라, 그 움직임 내부에서 어떤 일이 발생하고 있는지(가격 수준별 Bid/Ask 거래량, 델타, 임밸런스, 거래량 분포)를 보여줍니다. 많은 차트가 캔들의 최종 결과만 보여줍니다. OrderFlux는 그곳에 도달하기까지의 과정을 보여줍니다. 이것이 바로 캔들 모양뿐만 아니라 시장 참여자들의 동향을 읽고자 할 때 정확히 도움이 되는 부분입니다. 라이브 차트에서 OrderFlux는 주로 다음 세 가지 질문에 답합니다: 현재 어디에서 공격적인 매수 또는 매도 압력이 시장에 진입하고 있는가? 어떤 가격 수준에서 거래량이 흡수되거나 거부되고 있는가? 현재의 움직임이 세션 컨텍스트(배경)에 어떻게 부합하는가? 인터페이스에서 제공되는 기능 메인 차트는 Canvas
ARICoins
Temirlan Kdyrkhan
ARICoin is a powerful trading companion designed to generate high-probability entry signals with dynamic TP/SL/DP levels based on volatility. Built-in performance tracking shows win/loss stats, PP1/PP2 hits, and success rates all updated live. Key Features: Buy/Sell signals with adaptive volatility bands Real-time TP/SL/DP levels based on ATR Built-in MA Filter with optional ATR/StdDev volatility Performance stats panel (Success, Profit/Loss, PP1/PP2) Alerts via popup, sound, push, or email Cust
Entry Points Pro for MT5
Yury Orlov
4.48 (138)
다시 색을 칠하지 않고 거래에 진입할 수 있는 정확한 신호를 제공하는 MT5용 지표입니다. 외환, 암호화폐, 금속, 주식, 지수 등 모든 금융 자산에 적용할 수 있습니다. 매우 정확한 추정값을 제공하고 매수와 매도의 가장 좋은 시점을 알려줍니다. 하나의 시그널로 수익을 내는 지표의 예와 함께 비디오 (6:22)시청하십시오! 대부분의 거래자는 Entry Points Pro 지표의 도움으로 첫 거래 주 동안 트레이딩 결과를 개선합니다. 저희의   Telegram Group 을 구독하세요! Entry Points Pro 지표의 좋은점. 재도색이 없는 진입 신호 신호가 나타나고 확인되면(시그널 캔들이 완성된 경우) 신호는 더 이상 사라지지 않습니다. 여타 보조지표의 경우 신호를 표시한 다음 제거되기 때문에 큰 재정적 손실로 이어집니다. 오류 없는 거래 게시 알고리즘을 통해 트레이드(진입 또는 청산)를 할 이상적인 순간을 찾을 수 있으며, 이를 통해 이를 사용하는 모든 거래자의 성공률이
Current event:  https://c.mql5.com/1/326/A2SR2025_NoMusic.gif MT5용 A2SR 지표: 자동화된 실제 수요 및 공급(S/R). + 거래 상품. Product description in English here. --   Guidance   : -- at   https://www.mql5.com/en/blogs/post/734748/page4#comment_16532516 -- and  https://www.mql5.com/en/users/yohana/blog 더욱 스마트한 거래 결정을 위한 강력하고, 정확하며, 시간 절약적인 기능 + EA 호환 객체. 주요 장점 선행 실제 SR 레벨(지연 또는 재표시 없음) 2014년부터 MT4 에서 수년간 입증된 신뢰성을 바탕으로 A2SR이 이제 MetaTrader 5에서도 사용 가능합니다. 가격이 도달하기 전에 실제 지지선과 저항선을 식별하는 선행적이고 재표시 없는 지표를 통해 트레이더에
Meravith MT5
Ivan Stefanov
5 (1)
마켓 메이커를 위한 도구. Meravith는 다음과 같은 기능을 제공합니다: 모든 타임프레임을 분석하고 현재 유효한 추세를 표시합니다. 강세와 약세 거래량이 동일한 유동성 구간(거래량 균형 구간)을 강조 표시합니다. 서로 다른 타임프레임의 모든 유동성 레벨을 차트에 직접 표시합니다. 텍스트 기반 시장 분석을 생성하여 참고용으로 제공합니다. 현재 추세를 기반으로 목표가, 지지선 및 손절가를 계산합니다. 거래의 위험 대비 보상 비율(Risk/Reward)을 계산합니다. 계좌 잔고에 따라 포지션 크기를 산출하고 잠재 수익을 추정합니다. 시장에 중대한 변화가 발생할 경우 경고도 제공합니다. 지표의 주요 라인: 강세/약세 거래량 소진 라인 — 목표가로 사용됩니다. 시장 추세를 나타내는 라인. 시장이 강세인지 약세인지에 따라 색상이 변경되며 추세 지지선 역할을 합니다. 색상은 주로 시장 심리를 보여줍니다. 거래량 균형선(Eq). Eq(Volume Equilibrium) 라인은 시스템의 핵심입니
FlowSeeker
Dawid Aaron Zinserling
FlowSeeker is a custom technical indicator for MetaTrader 5 (MT5), developed by Ultron Trading Solutions ( www.ultrontradingsolutions.co.za ). It is designed to identify momentum shifts and directional changes in the market through two primary signals. Providing visual plots, optional buy/sell arrows, reversal crosses, a multi-timeframe trend panel, a candle timer, and alert notifications. It includes user-configurable settings for signals, plotting, trend trading filters, alerts, and display op
RelicusRoad Pro MT5
Relicus LLC
5 (24)
RelicusRoad Pro: 퀀트 시장 운영 체제 70% 할인 평생 이용권 (한정 시간) - 2,000명 이상의 트레이더와 함께하세요 왜 대부분의 트레이더는 "완벽한" 지표를 가지고도 실패할까요? 진공 상태에서 단일 개념 만으로 거래하기 때문입니다. 문맥 없는 신호는 도박입니다. 지속적인 승리를 위해서는 컨플루언스(중첩) 가 필요합니다. RelicusRoad Pro는 단순한 화살표 지표가 아닙니다. 완전한 퀀트 시장 생태계 입니다. 독점적인 변동성 모델링을 사용하여 가격이 이동하는 "공정 가치 로드"를 매핑하고, 단순 노이즈와 실제 구조적 돌파를 구분합니다. 추측은 그만두세요. 기관급 로드 로직으로 거래를 시작하세요. 핵심 엔진: "Road" 알고리즘 시스템의 중심에는 시장 상황에 실시간으로 적응하는 동적 변동성 채널인 Road Algo 가 있습니다. 세이프 라인(평형) 과 가격이 수학적으로 반전될 가능성이 높은 확장 레벨 을 투영합니다. Simple Road: 일반적인 시장을 위
Niveaux mensuels + PinBar + Marubozu + ALERTES (MQL5) Version : 2.0 FINAL Auteur : KOUAME N'DA LEMISSA See More Description du produit Cet indicateur avancé pour MetaTrader 5 combine l'analyse des niveaux mensuels, la reconnaissance des modèles de chandeliers japonais (PinBar et Marubozu) et un système d'alerte en temps réel. Il aide les traders à identifier rapidement les zones clés du marché et les opportunités de trading à forte probabilité. Caractéristiques principales Affichage automatiqu
Bill Williams Advanced
Siarhei Vashchylka
5 (11)
Bill Williams Advanced is designed for automatic chart analysis using Bill Williams' "Profitunity" system. The indicator analyzes four timeframes at once. Manual (Be sure to read before purchasing) Advantages 1. Analyzes the chart using Bill Williams' "Profitunity" system. Signals are displayed in a table in the corner of the screen and on the price chart. 2. Finds all known AO and AC signals, as well as zone signals. Equipped with a trend filter based on the Alligator. 3. Finds "Divergence Bar
Precision Spike Detector
Francisco Mandomo Simbine
5 (1)
Precision Spike Detector V3 – Institutional-Grade AI Trading System Attention: The price increases by US$50 for every 10 purchases.  Final price: US$599 Precision Spike Detector V3   is a   state-of-the-art, institutional-grade market analysis system   for   MetaTrader 5 , designed to detect   high-probability market movements   in synthetic indices such as   Boom, Crash, GainX, and PainX . After purchase, please contact me through the MQL5 messaging system to receive the order management tool
Stargogs Spike Catcher
Lorenzo Edward Beukes
4.56 (9)
Stargogs Spike Catcher V4.0 This Indicator is Developed To milk the BOOM and CRASH indices . Now Also work on weltrade for PAIN and GAIN indices. Send me Message if you need any help with the indicator.  CHECK OUT THE STARGOGS SPIKE CATCHER EA/ROBOT V3: CLICK HERE ALSO CHECK OUT SECOND TO NONEFX SPIKE CATCHER:   CLICK HERE STARGOGS SPIKE CATCHER V4.0 WHATS NEW! Brand New Strategy. This is the Indicator you need for 2025. New Trend Filter to minimize losses and maximize profits. New Trendline th
Market Profile Heatmap
Samuele Borella
5 (1)
MP TPO Heatmap — Market Profile (TPO) with VAH/VAL/POC/IB Market Profile is a way to visualize how price accepts or rejects value within a session. Instead of averaging, it counts how often price traded at each level during equal-time “brackets.” The result is a distribution you can read at a glance: thick areas = acceptance; thin edges = rejection. This indicator implements a TPO-based Market Profile with clean session lines (POC, VAH, VAL, IBH, IBL) and a fast, two-tone heatmap cloud that high
Owl Smart Levels MT5
Sergey Ermolov
4.03 (32)
추세를 따라 거래할 때 가장 어려운 점은 레벨을 찾는 것이 아니라, 어디에서 진입이 실제로 유효한지를 이해하는 것입니다. 가격은 종종 레벨에 반응하지만 움직임이 이어지지 않는 경우가 많으며, 이는 잘못된 진입이나 기회 상실로 이어집니다. Owl Smart Levels는 단순히 레벨만 표시하는 것이 아니라 , 시장 구조와 되돌림을 기반으로 형성된 구간을 보여줍니다. 이를 통해 진입 포인트를 다르게 평가할 수 있으며 일부 잘못된 신호를 피할 수 있습니다. Owl Smart Levels 시스템 구성 Owl Smart Levels 는 단순한 레벨 표시가 아니라, 각 요소가 서로 보완하는 완전한 트레이딩 모델 입니다. 구성 요소: Owl Smart Levels (지표) 추세 방향, 되돌림 구간, 그리고 사전에 정의된 진입, StopLoss, TakeProfit 레벨을 표시 시스템 가이드 실제 거래에서 신호를 어떻게 활용할지 설명: 어떤 상황을 고려하고 어떤 상황을 건너뛸지, 그리고 거래
Weltrade Spike Sentinel
Batsirayi L Marango
5 (1)
Introducing Indicator for PainX and GainX Indices Traders on Weltrade Get ready to experience the power of trading with our indicator, specifically designed for Weltrade   broker's PainX and GainX Indices.  Advanced Strategies for Unbeatable Insights Our indicator employs sophisticated strategies to analyze market trends, pinpointing optimal entry and exit points.  Optimized for Maximum Performance To ensure optimal results, our indicator is carefully calibrated for 5-minute timeframe charts on
AriX
Temirlan Kdyrkhan
1 (4)
AriX Indicator for MT5 A powerful trend-following and signal-evaluation tool AriX is a custom MT5 indicator that combines Moving Averages and ATR-based risk/reward logic to generate clear buy/sell signals. It visualizes dynamic SL/TP levels, evaluates past trade outcomes, and displays win/loss statistics in a clean on-chart panel. Key features include: Buy/Sell signals based on MA crossovers ATR-based SL/TP1/TP2/TP3 levels with visual lines and labels Signal outcome tracking with real-time stat
제작자의 제품 더 보기
Cycle Identifier PRO
Obaida Kusibi
4 (4)
MT4용 주기 식별자 표시기는 거래자가 매수 및 매도 포지션을 열 수 있는 조건이 언제인지 식별할 수 있도록 필터링된 가격 조치 신호를 생성합니다. Cycle Identifier MT4 지표는 단기 및 장기 거래자 모두에게 적합한 맞춤형 지표입니다. 사이클 식별자 MT4는 거래자가 매수 및 매도 포지션을 열 수 있는 조건이 언제인지 식별할 수 있도록 필터링된 가격 조치 신호를 생성합니다. 작동 방식 주기 식별자 MT4 표시기는 진동하는 회색 선을 그리는 기본 차트 아래에 별도의 표시기 차트에 표시됩니다. 이 회색 선은 시장 추세와 추세 모멘텀을 보여주기 위해 각각 녹색과 빨간색 막대가 동반되는 상승 및 하락 스파이크가 특징입니다. 백그라운드에서 지표는 SMA(Smooth Moving Averages), RSI(Relative Strength Index) 및 가격 조치 필터 지표의 조합을 사용합니다. 이를 통해 지표는 시장 추세를 식별하고 강도(모멘텀)를 분석하며 잘못된 신호도
What is the Overlay Chart Indicator? The Overlay Chart indicator is exactly as its name suggests. It is a custom technical indicator which overlays another price chart over the current price chart window. It allows traders to overlay another currency pair over one pair which allows them to compare price movements and the characteristics of price action. It then plots a grid to indicate the price of the overlaid currency pair for better reference. It also plots the open, high, low, and close pric
Metatrader 4의 Three MA Buy and Sell Signals PRO 지표는 추세가 반대 방향으로 바뀔 때마다 매수 및 매도 신호를 제공하는 3 MA의 거래 시스템입니다. 이 시스템 지표는 3개의 서로 다른 기간을 사용하는 3개의 이동 평균으로 구성됩니다. 지표는 실제 거래 매수 및 매도 신호를 화살표 형태로 제공합니다. MT4 거래 플랫폼에 지표를 다운로드하고 설치하면 아래와 같은 이미지처럼 보일 것입니다. 키 포인트 추세 신호 표시기 다시 칠하지 않는 화살표 초보자 친화적 지표 컬렉션에 추가할 가치가 있음 이 지표는 추세 반전 신호 확인 도구로 기존 거래 전략 또는 시스템과 함께 작동할 수 있습니다. 기본 거래 신호 Metatrader 4에 대한 Three MA Buy and Sell Signals PRO 지표의 신호는 해석하기 쉽고 다음과 같이 진행됩니다. 구입 녹색 신호 화살표가 차트에 인쇄되는 즉시 매수 신호가 제공됩니다. 손절매를 지지선 아래에
MT4용 3번째 캔들 Forex Scalper 표시기는 모든 시간 프레임 및 쌍에 대해 잘 작동하는 진정한 스캘핑 표시기입니다. 키 포인트: 파란색 화살표는 구매 거래 기회를 나타냅니다. 빨간색 화살표는 매도 거래 기회를 나타냅니다. 지표는 매우 안정적이고 가벼우며 거래 플랫폼의 속도를 늦추지 않습니다. 그것으로 거래하는 방법? 파란색 스캘퍼 화살표가 차트에 나타날 때마다 매수 포지션을 엽니다. 빨간색 스캘퍼 화살표가 차트에 나타날 때마다 매도 포지션을 엽니다. 차트에서 반대 거래 신호가 발생하면 거래를 종료하십시오. 자신이 좋아하는 거래 방법을 자유롭게 사용하여 세 번째 캔들 외환 ​​스캘퍼 표시기로 거래를 열고 닫으십시오. 표시기 사양 거래 플랫폼: Metatrader 4(MT4)용으로 개발됨 통화 쌍: 모든 통화 쌍에서 작동합니다. 시간 프레임: 모든 시간 프레임에서 작동 입력 매개변수: 화살표 이동, 황소 곰 캔들 필터, 색상 설정 및 스타일 지표 유형:
Obie Scalper
Obaida Kusibi
Metatrader 4용 Obie Scalper 지표는 사용하기 쉬운 Forex 스캘핑 지표로 낮은 시간대에 빠른 수익을 제공합니다. 지표는 다양한 거래 세션 중에 발생할 수 있는 빠른 스캘핑 기회에 대해 차트를 분석합니다. 가장 변동이 심한 거래 세션(런던 및 미국)에서 최상의 결과를 얻었습니다. 당연히 Obie Scalper 표시기는 원하는 시간대와 통화 쌍에서 작동합니다. 그것으로 거래하는 방법(예시)? 밝은 파란색 화살표가 차트에 인쇄되자마자 매수 스캘핑 거래를 엽니다. 자홍색 화살표가 차트에 인쇄되자마자 매도 스캘핑 거래를 시작하십시오. 8-15 핍 이익을 위해 거래를 종료하십시오. 단기 손절매를 활용하여 손실을 최소화하십시오. AFSTAR Forex 지표로 거래를 열고 닫으려면 자신이 좋아하는 거래 방법을 자유롭게 사용하십시오. 표시기 사양 거래 플랫폼: Metatrader 4(MT4)용으로 개발됨 통화 쌍: 모든 통화 쌍에서 작동합니다. 시간 프레임
Obie 1M Scalper Metatrader 4 Forex Robot은 13개의 이동 평균을 활용하는 자동화된 외환 거래 소프트웨어입니다. 기본적으로 매수/매도 거래 신호에 대한 시장을 스캔하는 논리를 공식화할 때 여러 이동 평균을 사용하면 이러한 경고가 점점 더 정확해집니다. 이름에서 알 수 있듯이 GBP/USD, EUR/USD, USD/CHF, USD/CAD 등과 같은 주요 외환 쌍과 상장 주식에서 1분 단위로 가장 잘 작동하는 스캘핑 알고리즘입니다. 나스닥에서. 이 자동 거래 시스템 거래와 관련된 위험은 스프레드입니다. 따라서 1분 Scalper 전문 고문은 EUR/USD, USD/JPY 및 GBP/USD와 같이 상대적으로 스프레드가 적은 외환 쌍에만 배치해야 합니다. 전략 테스터 보고서 1분 차트에서 GBP/USD 외환 쌍에 대한 1분 Scalper 외환 로봇 전략 테스터 보고서를 아래에서 찾으십시오. 전반적인 성능 EA는 총 13번의 거래에서 총 $605.4
Pure Management Metatrader 4 Forex Robot은 하루 세션 동안 단 10핍의 이익을 얻도록 설계된 알고리즘 트레이더입니다. EA는 더 나은 결과를 찾기 위해 입찰에서 높은 연속 낙찰 가능성을 우선시하는 알고리즘을 배포하여 기대 보수를 향상시킵니다. 퓨어매니지먼트 전문 어드바이저는 거래 실패 후 로트의 증가와 함께 이력의 통계 데이터를 기반으로 한 자금 관리 기법을 활용합니다. Pure Management 외환 로봇은 몇 번의 연속 승리 직후에도 주문 로트를 늘려 위험을 낮춥니다. 기본 최대 로트 크기 한도인 5.0을 사용하여 이 증가하는 주문 로트를 확인합니다. 전략 테스터 보고서 1분 차트에서 EUR/USD 외환 쌍에 대한 Pure Management 로봇 전략 테스터 보고서를 아래에서 찾으십시오. 전반적인 성능 EA는 총 198건의 거래에서 총 $1640.00의 수익을 올렸습니다. 가장 큰 승리를 거둔 거래는 $50.00의 이익을 창출한
ObieAlerts
Obaida Kusibi
green up = buy red down = sell with alerts! that's how easy it is. --this indicator follows trend --based on moving averages and rsi and macd and pivot points --good for scalping and intraday trading and daytrading --works for swing --recommended time frame is 15m or 5m  contact me after purchase to receive a trading strategy with the indicator with another bonus indicator!
진정한 마진 세이프 실행을 제공하는 차세대 EMA/RSI + ATR 전략 개요 Signals w TP SL은 기존 EMA/RSI 교차 전략과 역동적인 ATR 기반 손절매 및 이익실현 목표가를 결합한 턴키 방식의 MetaTrader 4 전문가 자문 솔루션입니다. 업계 최초의 마진 세이프 랏 사이징 엔진도 탑재되어 있습니다. 모든 종목과 시간대에 맞춰 설계된 이 EA는 계좌 잔액에 맞춰 포지션 규모를 자동으로 조정하고, 과도한 레버리지를 사용하지 않으며, 실제로 감당할 수 있는 거래만 개시합니다. EURUSD, H1 또는 XAUUSD, D1 거래 여부에 관계없이 Signals w TP SL은 다음과 같은 이점을 제공합니다. 새로운 캔들에서 신뢰할 수 있는, 각 봉당 한 번의 신호 원활한 추세 감지를 위한 EMA 교차 필터 과매수/과매도 휩소 현상을 방지하는 RSI 확인 현재 변동성에 적응하는 ATR 기반 SL/TP 자본에 따라 확장되는 위험 비율 기반 랏 크기 조정 진정
Signals with TP SL Indicator — a powerful trading tool that combines EMA crossover , RSI filter , and ATR-based TP/SL levels to help you spot high-probability market entries. This indicator is built to visually support the Signals with TP SL Expert Advisor , but can also be used manually as a standalone confirmation tool for intraday and swing trading. Features: Buy/Sell arrows based on EMA crossover + RSI condition Real-time dynamic SL and TP levels calculated using ATR Plots arrows directly
This indicator is designed for scalping on low timeframes (M1-M15) in volatile markets like major forex pairs (e.g., EURUSD, GBPUSD). It generates non-repainting buy (green up arrow) and sell (red down arrow) signals based on EMA crossover confirmed by RSI momentum and MACD crossovers, minimizing false signals in ranging markets. How to Use: Attach the indicator to your MT4 chart. Look for arrows on the chart: Buy on green up arrow, Sell on red down arrow. Signals appear at the open of the new
Gann Hi Lo
Obaida Kusibi
Gann High Low Activator Metatrader 5 외환 지표는 Robert Krausz의 1998년 Stocks & Commodities Magazine에서 설명되었습니다. 기술 지표는 이전 N 기간의 저점 또는 고점의 단순 이동 평균(SMA)을 나타냅니다. 최고점과 최저점의 곡선은 Gann High Low Activator 표시기를 사용하여 적절하게 추적됩니다. 그럼에도 불구하고 막대의 닫기는 플롯되는 항목을 결정하는 것입니다. 지표는 이중 색상 선(주황색 빨간색 및 라임 녹색), 회색 점선(채널 중앙에 약간 있음) 및 Gainsboro 그림자로 차트에 나타납니다. Gann High Low Activator 표시기의 이러한 구성 요소는 추세가 변경될 경우 위반해야 하는 일종의 채널을 형성합니다. 스캘핑, 데이 트레이딩 및 스윙 트레이딩 목적으로 이 지표를 사용하십시오. 아래의 GBP/USD H1 차트는 작동 중인 Gann High Low Activat
추세를 따르고 다시 칠하지 않는 외환 거래 게이지. 신호는 완전 자동 방식으로 계산 및 제공되며 이동 평균 교차점을 기반으로 합니다. 이러한 신호는 단순한 매수/매도 화살표의 형태로 표시되므로 초보자에게 친숙한 도구입니다. 그럼에도 불구하고 신호 신뢰성은 정말 견고합니다. 모든 외환 거래 전략과 함께 사용할 수 있습니다. Trend Signals Alerts Indicator는 모든 종류의 기간 및 통화 쌍에 적합합니다. 메인 트레이딩 차트에 바로 표시됩니다. 기본 설정은 입력 탭에서 직접 수정할 수 있습니다. Trend Signals Alerts Indicator 자세히 보기 이 지표의 기본 아이디어는 시장 동향과 무역 신호를 보여주는 간단한 방법을 제공하는 것입니다. 결과적으로 초보자와 고급 거래자 모두 도구를 활용할 수 있습니다. 스크린샷에서 MT5에서 활성화되었을 때 어떻게 보이는지 살펴보십시오. 추세 신호 경고 표시기 해부 보시다시피, 그에 따라 거래하기 위한 매
ObieTrader
Obaida Kusibi
ObieTrader is a short term signals indicator. It is used for intraday trading. ObieTrader identifies the short term trend using Williams percent R indicator and average true range. When a short term trend is confirmed by the indicator, it plots semaphores on the bar to show the trend. Bars with red dots indicate downtrend and bars with blue dots indicate uptrend. When a trend is identified, open positions in the direction of the trend. When red circles appear open short position. When blue cir
신뢰할 수 없는 신호가 차트를 가득 채우고 비용을 낭비하는 데 어려움을 겪고 계신가요? 가장 신뢰할 수 있는 세 가지 기술 도구를 하나의 명확하고 재작업이 필요 없는 신호 생성기로 결합한 강력하고 사용하기 쉬운 지표를 원하시나요? 바로 이 지표입니다! 이 지표를 선택해야 하는 이유 트리플 컨펌 전략 EMA 크로스오버, RSI 모멘텀, MACD 히스토그램을 결합하여 신뢰할 수 있고 발생 가능성이 높은 신호를 생성합니다. 잘못된 진입을 줄이고 신뢰도를 높여줍니다! 재작업 없음 닫힌 봉에만 신호가 표시되므로, 보이는 신호가 최종 신호입니다. 추측이나 오해의 소지가 있는 알림이 없습니다. 차트에 크고 명확한 화살표 표시 정확한 캔들에서 매수 및 매도 신호를 즉시 확인하세요. 복잡하거나 혼란스러운 부분은 없습니다. 자동 이익실현 및 손절매 라인 설정 가능한 이익실현 및 손절매 라인이 차트에 동적으로 표시됩니다. 더욱 스마트하고 간편하게 위험을 관리하세요.
TrendPulse EA - 스마트한 추세 추종 전문가 어드바이저 TrendPulse EA는 강력한 시장 추세를 정확하게 포착하도록 설계된 강력하고 안정적인 트레이딩 로봇입니다. 검증된 빠른 지수이동평균(EMA)과 느린 지수이동평균(EMA)의 조합과 RSI 필터를 활용하여, 높은 확률의 진입 시점을 파악하고 맞춤형 손절매, 이익실현, 트레일링 손절매를 통해 위험을 관리합니다. 주요 기능: RSI 확인을 통한 동적 EMA 교차 전략 조정 가능한 위험 비율을 통한 스마트한 자금 관리 손절매, 이익실현, 트레일링 손절매 매개변수 설정 가능 다중 미결제 거래를 통해 안전하게 추세에 맞춰 확장 가능 모든 주요 외환 통화쌍 및 인기 시간대(H1, H4 권장)에서 작동 낮은 스프레드와 낮은 수수료의 브로커에 최적화 TrendPulse EA는 초보자부터 숙련된 트레이더까지 진입, 청산, 위험 관리를 자동화하여 거래를 간소화하고, 성장과 일관성에 집중할 수 있도록 지원합니다. 지
필터:
Clemildes Horta
287
Clemildes Horta 2024.09.25 14:30 
 

사용자가 평가에 대한 코멘트를 남기지 않았습니다

리뷰 답변