Imbalance Finder for SMC
- 지표
- 버전: 5.0
- 업데이트됨: 1 9월 2022
- 활성화: 15

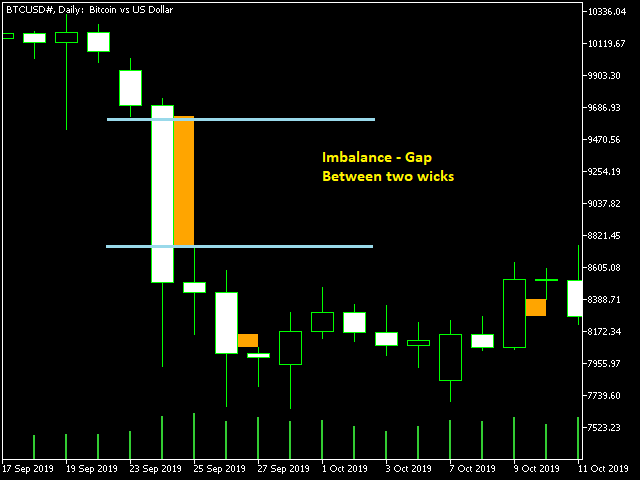
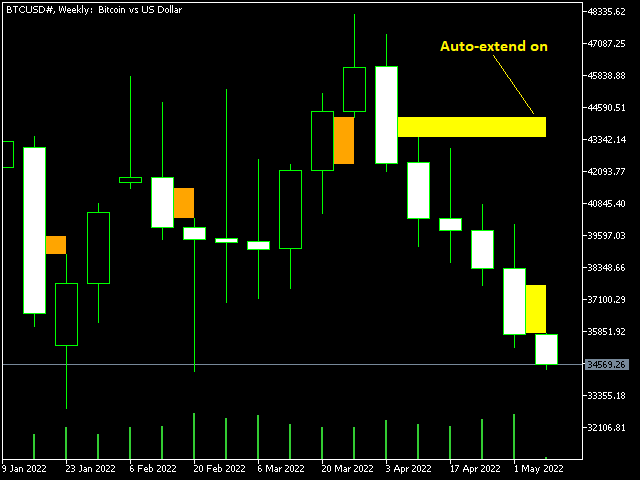
Imbalance / Fair Value Gap (FVG) , this is a zone / gap created when the price move with force in a given direction. It identify a zone where the price could
potentially go back. This gives perfect targets for your trades.Imbalance is created from the high and low of 3 candles. When the wicks the of 1st and 3rd candle does not fully overlap the middle one.
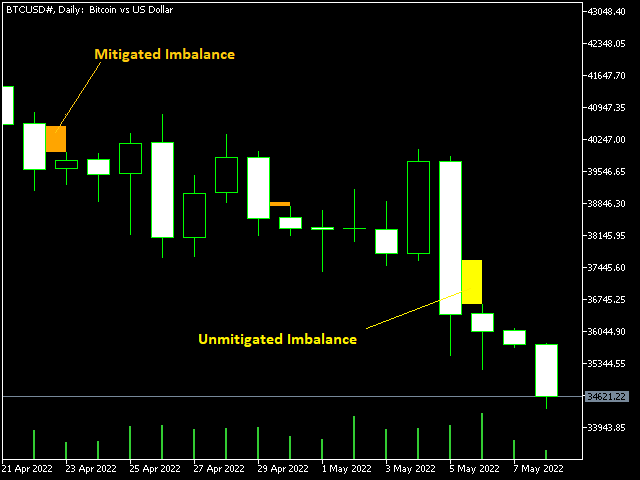
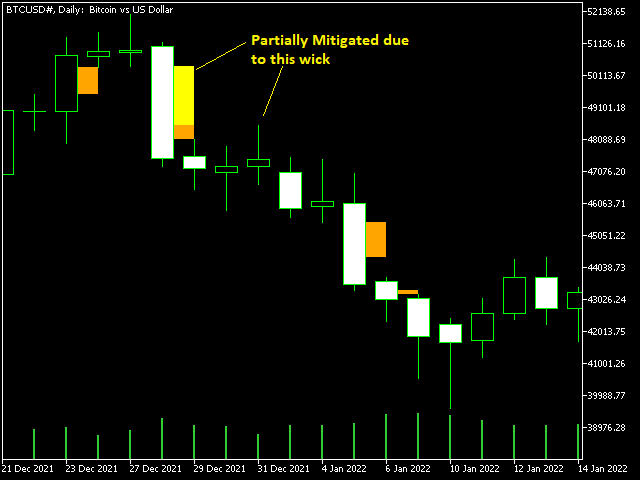
This indicator will help you to easily spot mitigated/unmitigated imbalances in your chart.
NEW UPDATE:
- Added Multi-Timeframe feature
- Added Alerts
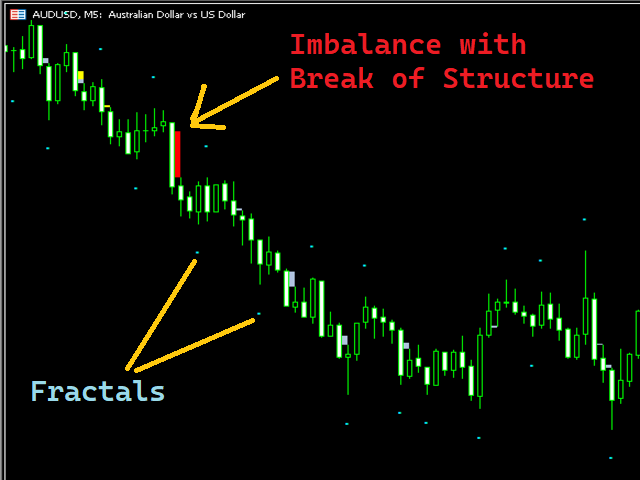
- Added Fractals
- Added Settings for Imbalance with Break of Structure
사용자가 평가에 대한 코멘트를 남기지 않았습니다