WSV mtf support resistance
- 지표
- 버전: 1.3
- 업데이트됨: 20 4월 2022
- 활성화: 5

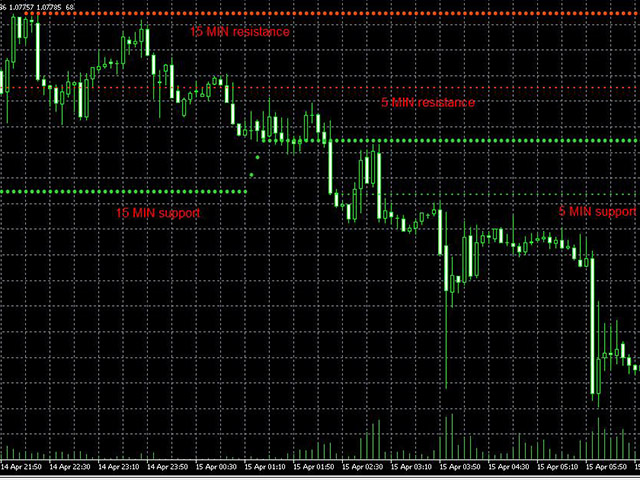
This indicator is the advanced edition of WRP&KD support resistance designed according to the combination of WPR, Stoch, RSI, CCI, and tick volume indicators. You can add other timeframe's support and resistance on the current chart. When WPR, Stoch, RSI, CCI goes up the same time quickly and the volume become larger, the price may meet strong resistance, many times short order will take profit, but if the price break through it, Long positions are more likely to be profitable, and the reverse held true as well.
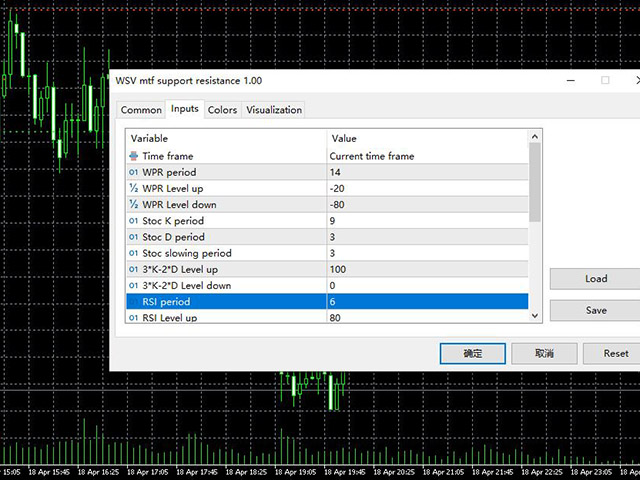
You can adjust the parameters of WPR and Stoc to Adapt the symbol you operate.
You can have a try using the free edition:https://www.mql5.com/en/market/product/80448, it has basic functions.
If you are interested in EA,click below links to take a look:
https://www.mql5.com/en/market/product/80170
https://www.mql5.com/en/market/product/81136
Key features
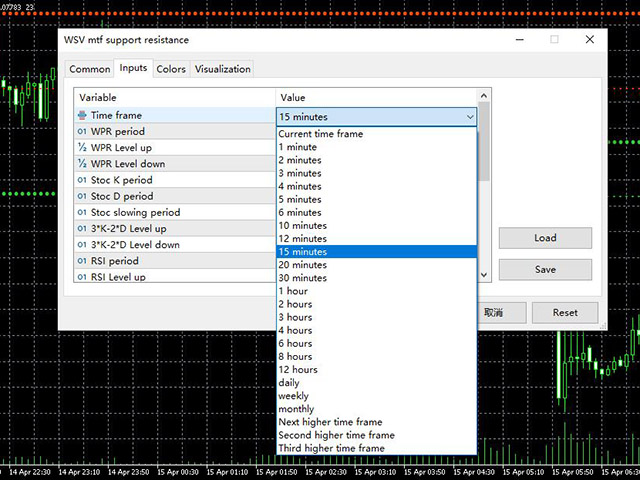
> Multi timeframe's support resistance can be show on one chart
> WRP is considered
> Stoch is considered
> RSI is considered
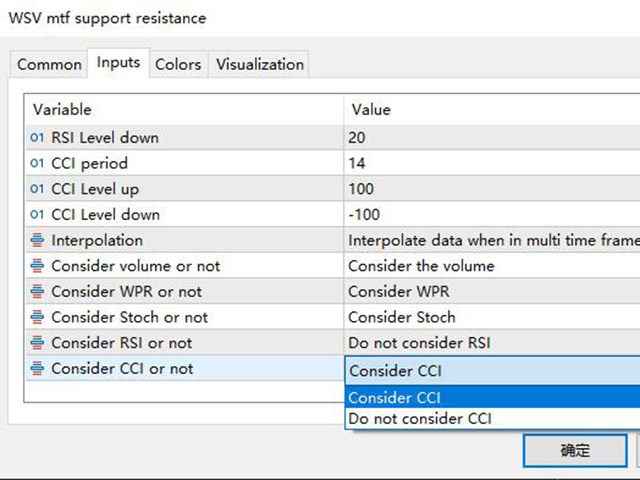
> CCI is considered
> Volume is considered
> Alert when price achieve (crossed) support or resistance
> Alert when support or resistance changed
> You can select whether a indicator to be considered
> You can change the parameters of any indicator to be considered
How to use
> Attach the first timeframe's support resistance, eg. current time frame
> Attach the second timeframe's support resistance, eg. 15 minutes
> ...
> Change the parameters according to your own experience or use default
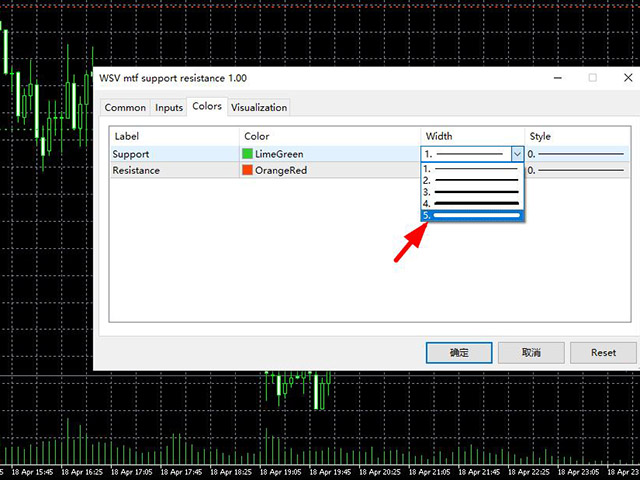
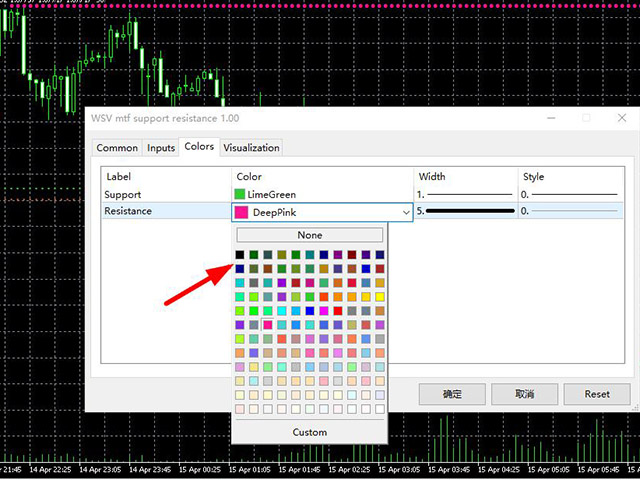
> Change the color and width of the different timeframe's support and resistance or use default
사용자가 평가에 대한 코멘트를 남기지 않았습니다