Daily CPR Custom

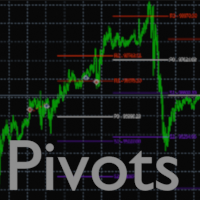
Daily CPR is a lightweight MetaTrader 5 indicator that plots the daily Central Pivot Range and classic daily pivot support/resistance levels directly on the chart.

The indicator is designed for traders who use daily pivot structure as part of intraday planning, session preparation, support and resistance mapping, or top-down market context. It draws the current and historical daily CPR levels from the previous daily candle and keeps chart performance responsive by limiting the number of drawn days and recalculating only when a new bar appears.

What It Draws

- TC: Top Central Pivot
- P: Main Pivot
- BC: Bottom Central Pivot
- R1, R2, R3: Daily resistance levels
- S1, S2, S3: Daily support levels

Core Calculation

The indicator uses the previous daily candle high, low, and close to calculate the next daily pivot levels:

Pivot = (High + Low + Close) / 3
BC = (High + Low) / 2
TC = (2 x Pivot) - BC

Classic pivot levels:

R1 = (2 x Pivot) - Low
S1 = (2 x Pivot) - High
R2 = Pivot + (High - Low)
S2 = Pivot - (High - Low)
R3 = (2 x Pivot) + (High - 2 x Low)
S3 = (2 x Pivot) - (2 x High - Low)

Main Features

- Daily CPR: TC, Pivot, and BC
- Daily classic pivot levels: R1, R2, R3, S1, S2, S3
- Optional labels for each level
- Customizable colors, line styles, widths, and label font size
- Optional custom session start time
- Optional current-day-only display
- Configurable number of historical days to draw
- New-bar recalculation instead of tick-by-tick redraw
- Object updates instead of repeated object recreation
- Built as an indicator only; it does not open, manage, or close trades

Why Use Daily CPR

Daily CPR and pivot levels can help traders identify important reference areas before and during the trading day. These levels are commonly used to observe where price may react, consolidate, reject, break out, or retest. The indicator does not generate buy or sell signals by itself. It is intended as a clean market-structure and planning tool.

Performance Design

Daily CPR is built to keep charts responsive:

- It does not recalculate on every tick.
- It recalculates on new bars.
- It limits historical drawing through the Days To Draw input.
- It updates existing chart objects instead of constantly deleting and recreating them.
- A current-day-only mode is available for users who want the lightest possible chart setup.

Suggested Use

Use the indicator on intraday charts such as M5, M15, M30, or H1 to see the daily pivot structure while monitoring lower-timeframe price action. Daily CPR can also be used on higher timeframes for broader market context, but its main purpose is daily reference mapping.

Important Notes

This indicator is a charting and analysis tool. It is not an Expert Advisor, does not trade automatically, and does not guarantee profitable results. Trading decisions, risk management, and strategy rules remain the responsibility of the trader.


Copyright (c) Uniprojects.

제작자의 제품 더 보기
MTF MA Color Candles Alert helps traders read moving-average context faster by replacing regular candles with four customizable candle colors. The indicator can use the current timeframe or a selected higher timeframe moving average. For example, a trader can view M5 price action while coloring the candles from an H1 or H4 moving average condition. Main features: - Multi-timeframe MA source: current, M5, M15, M30, H1, H4, D1, and W1 - Moving average period, method, and applied price are adjus
Trading Session Zones Alert is a free visual session indicator for MetaTrader 5. It highlights the major trading sessions directly on the chart so traders can quickly see how price moved during each session and where session ranges overlap. The indicator draws clear session zones and time labels for: - Sydney - Tokyo - Frankfurt - London - New York Each session can display its own colored zone, label, and optional high/low lines. The session labels show the active time window on the chart, ma
FREE
Expectancy Finder is a manual execution panel for traders who want a more disciplined way to test their own strategy with consistent risk, stop distance, target R, and sample tracking. This Expert Advisor does not predict direction and does not open trades automatically. The trader chooses BUY or SELL. The EA handles the execution framework. The tool is designed to reduce common execution errors such as multiple overlapping entries, inconsistent risk-to-reward planning, changing position size
Multitimeframe Ma Atr is a MetaTrader 5 indicator that displays ATR and a moving average of ATR in a separate indicator window. The indicator can calculate ATR from the current chart timeframe or from a selected higher or lower timeframe. This allows traders to monitor ATR context from one chart. For example, a trader can view an M5 chart while displaying H1 ATR and H1 ATR moving average. Main features: - Multitimeframe ATR source - Adjustable ATR timeframe - Adjustable ATR period - Adjustabl
FREE
Mtf Market Structure Color Candles Alert is a MetaTrader 5 indicator for traders who use multi-timeframe market structure in their chart reading. The indicator draws selected-timeframe structure references on the execution chart and colors the current-chart candles only when price confirms a structure condition. It is designed to help traders separate trend continuation, possible trend change, and neutral range conditions. Version 1.30 includes: Confirmation mode: execution-chart close or fully
Mtf Kijun Sen Color Candles Alert colors candles using Kijun-sen as the reference line while keeping bullish and bearish candles visually distinct above and below Kijun. The indicator can use the current chart timeframe or a selected higher timeframe Kijun reference, allowing traders to view broader Kijun context directly on the execution chart. Main features: - Multi-timeframe Kijun reference - Four selectable candle colors - Separate colors for bullish and bearish candles above Kijun - Sepa
MTF MA Slope Color Candles Alert is a multi-timeframe moving-average slope indicator that colors candles according to the direction of the selected moving average. Instead of using only price position above or below the moving average, the indicator separates market behavior into three slope states: - rising moving average - falling moving average - flat or non-trending moving average Each slope state keeps bullish and bearish candles visually distinct, giving six candle colors in total: - fl
MTF Supply Demand Strongest Lines Alert is a MetaTrader 5 indicator that draws supply and demand zones from a selected higher timeframe while you trade from the execution chart timeframe. The indicator scans the selected timeframe, detects support and resistance zones, and draws the strongest line inside each zone based on the price area with the most wick touches from the selected timeframe candles. For example, you can trade on M5 while using H4 zones and H4 strongest-line calculations, or t
MTF Currency Strength Lines Alert MTF Currency Strength Lines Alert is a multi-timeframe currency strength indicator for MetaTrader 5. It plots currency strength lines for the eight major currencies: EUR, USD, GBP, JPY, AUD, NZD, CAD, and CHF. The indicator uses averaged percentage movement from the 28 major FX crosses to create a clean strength view in a separate indicator window. It is designed to help traders compare currency strength, monitor base-versus-quote movement, and receive alerts
필터:
리뷰 없음
리뷰 답변