Extreme Value Sniper MT5
- 지표
-
Elmira Memish
 Eliminate guesswork and build a sustainable, rule-based edge in global financial markets through mathematical, systemic, and algorithmic approaches.
What We Cover:
📊 Daily Market Prep: Pre-market analysis before London/NY sessions (S&P 500, Nasdaq, Gold, Forex). - 버전: 1.0
- 활성화: 7
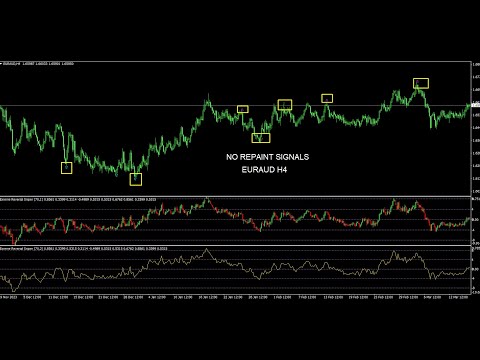
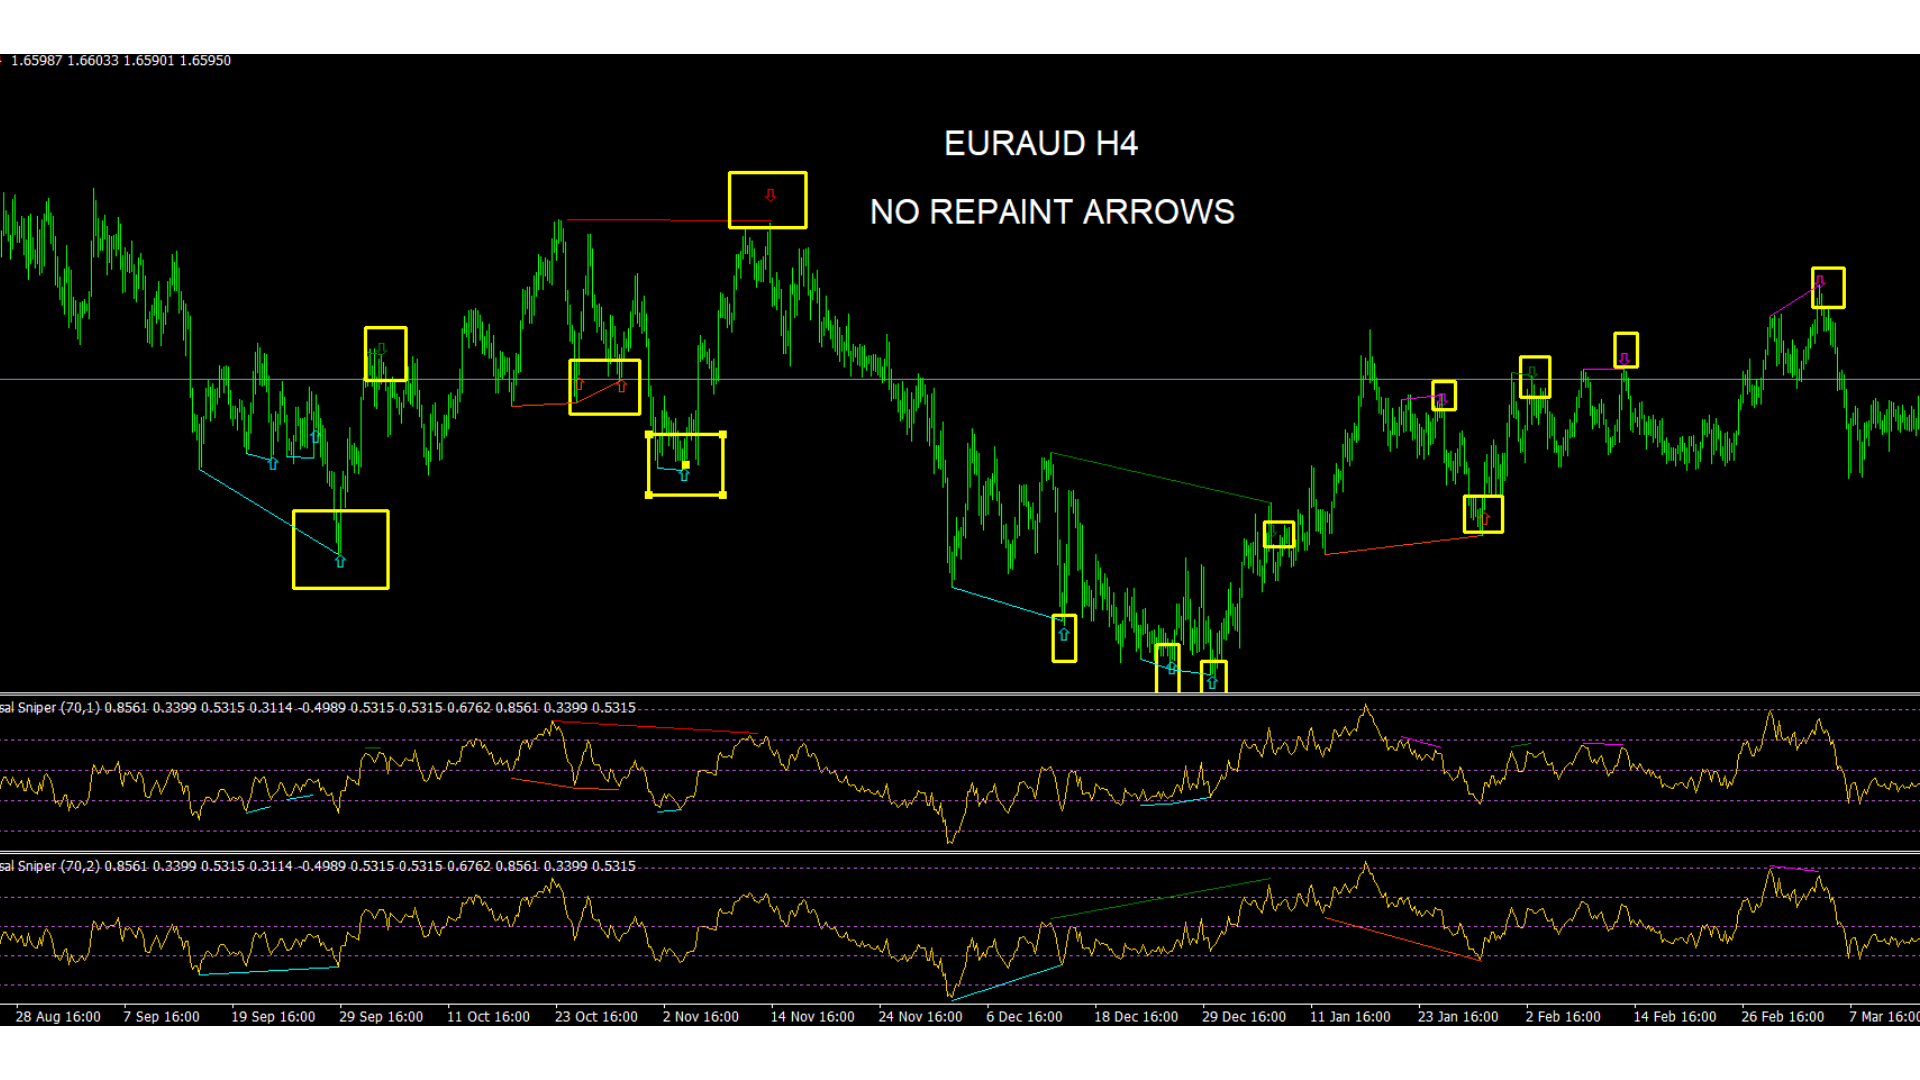
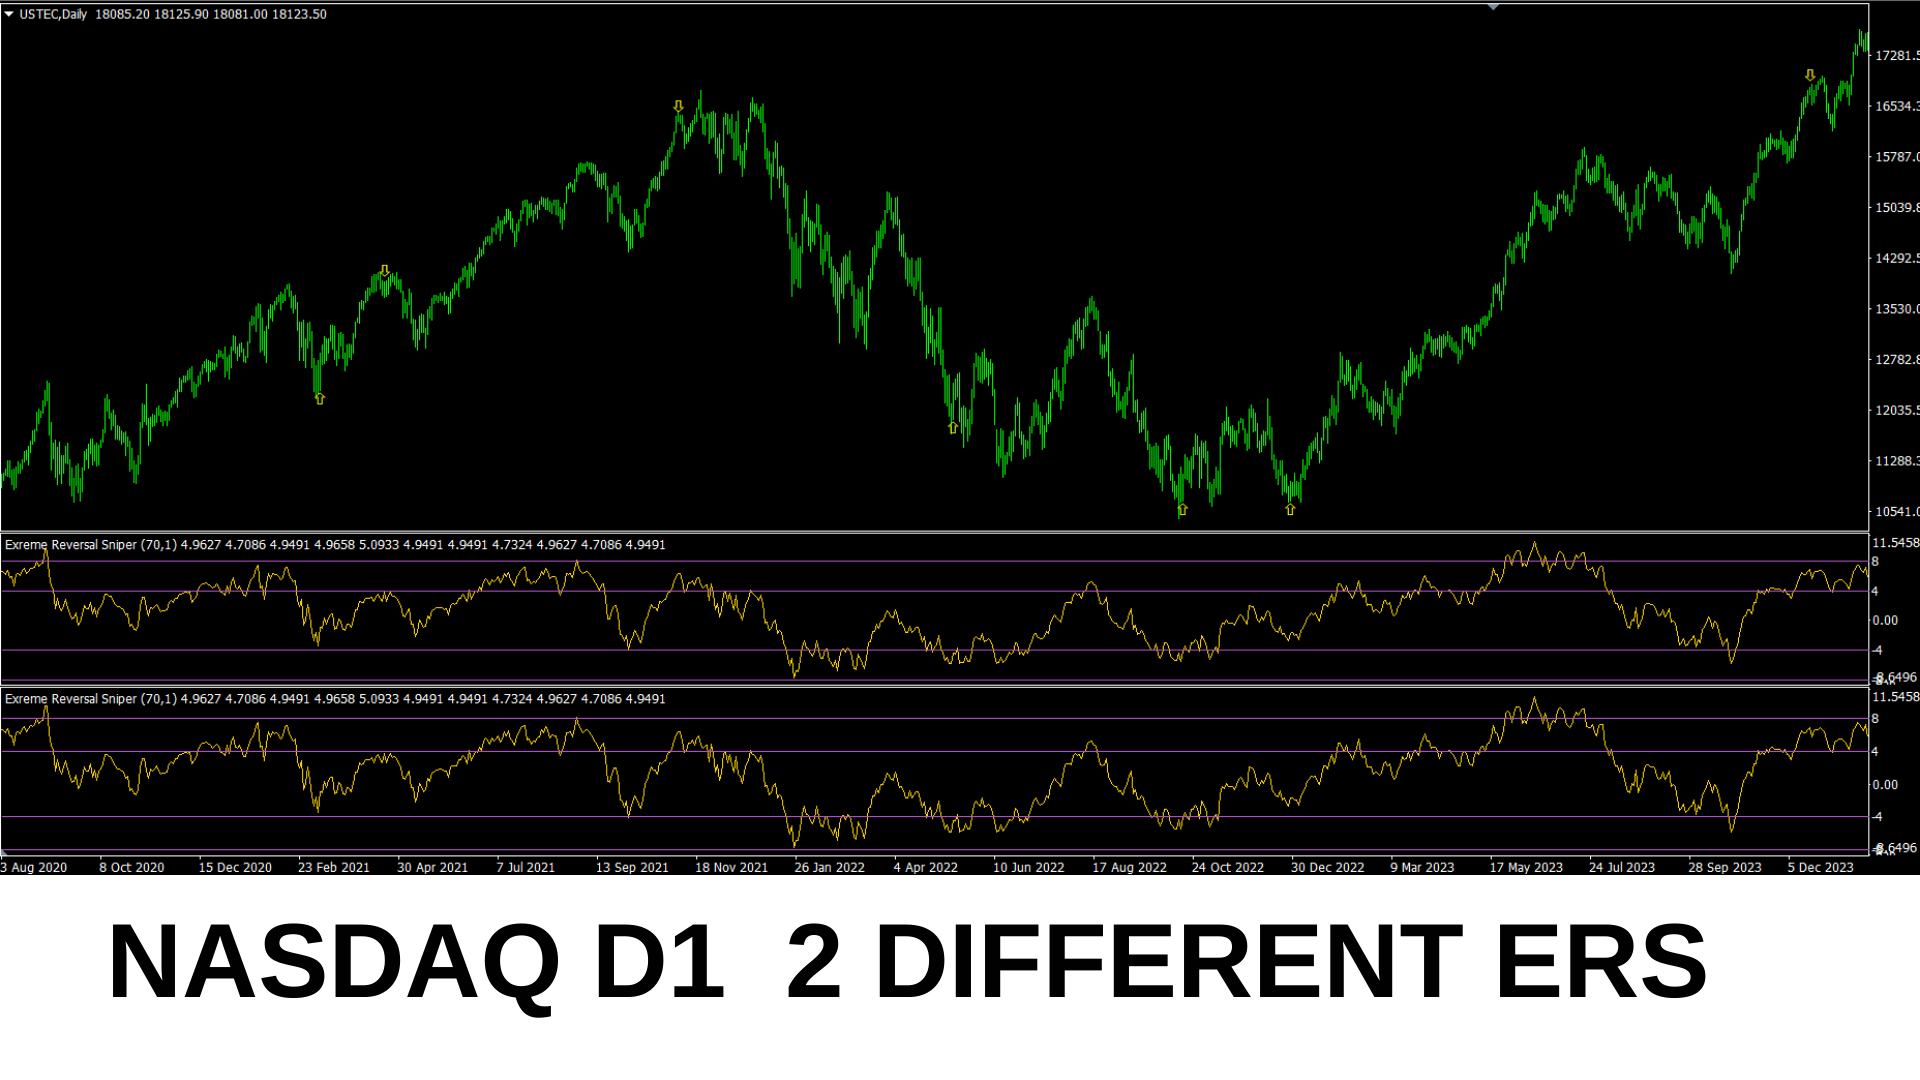
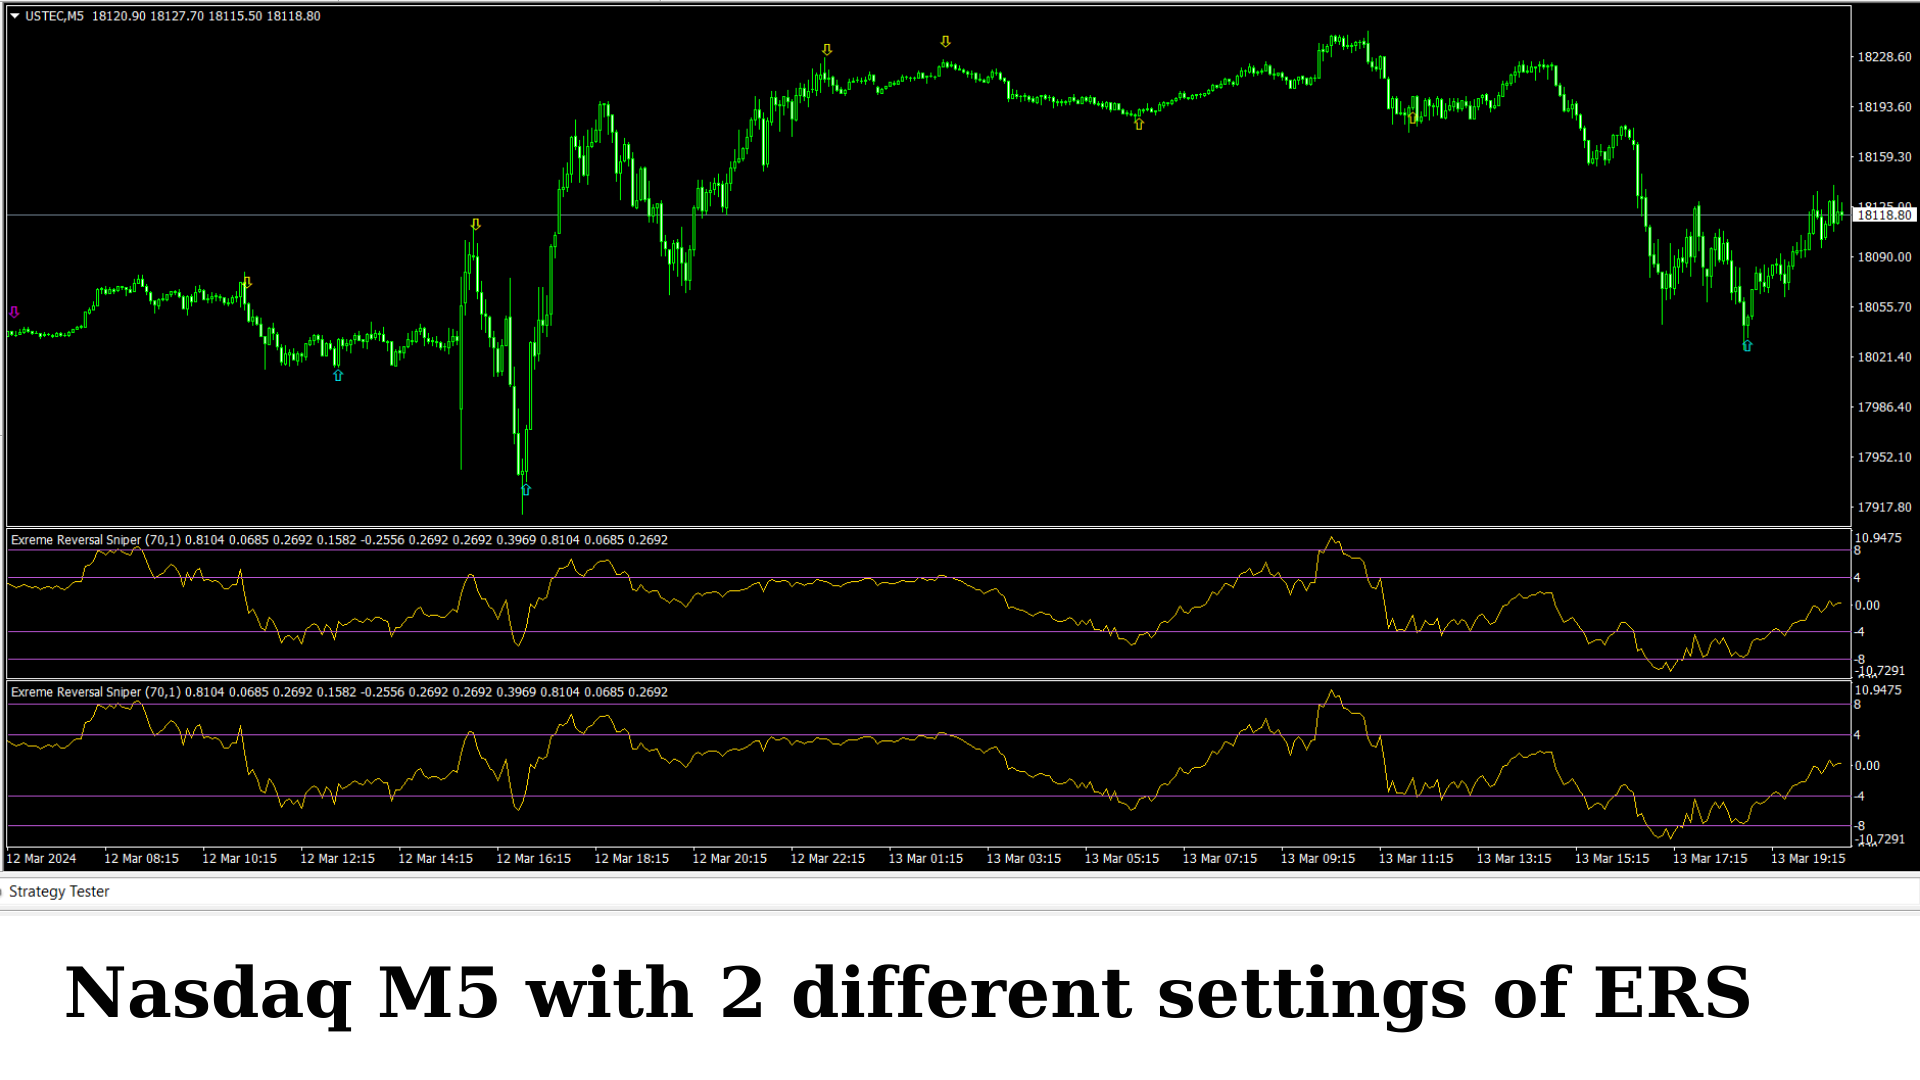
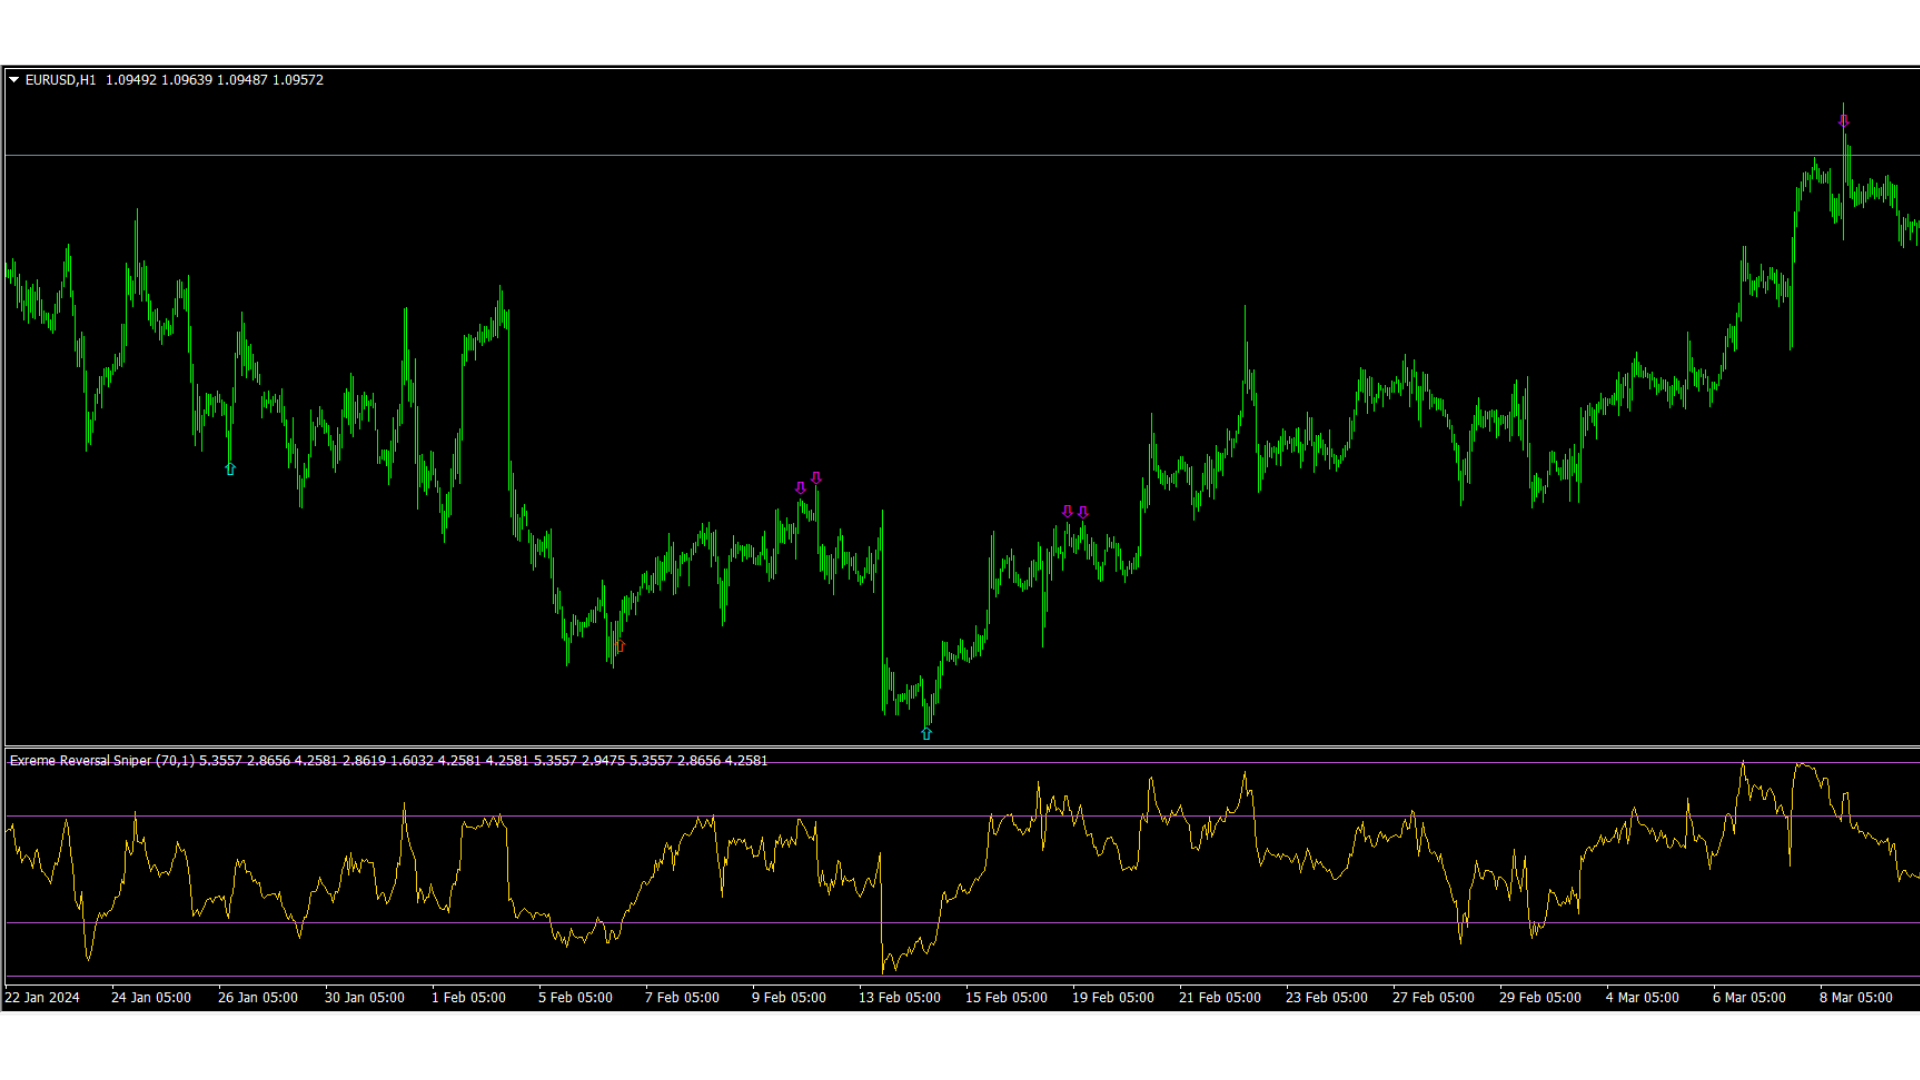
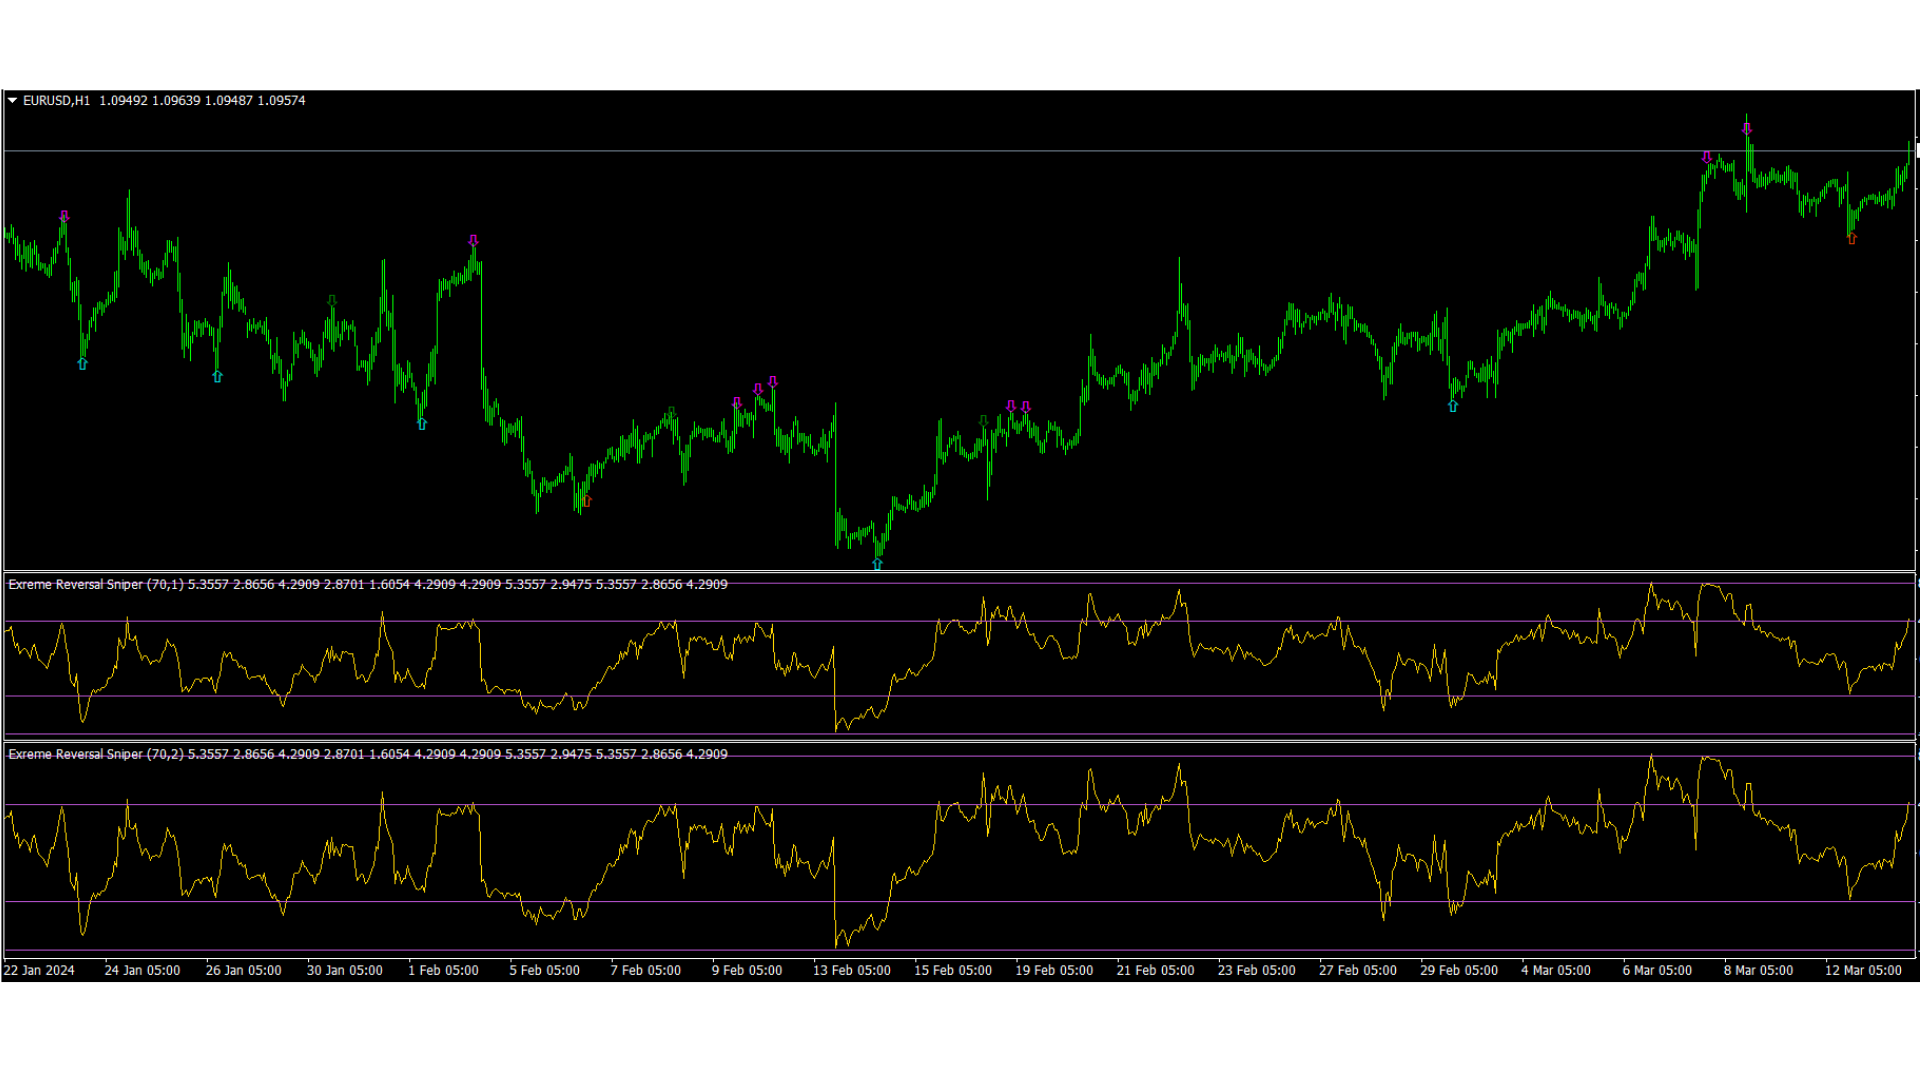
This is the MT5 version of Extreme Reversal Sniper MT4 Indicator
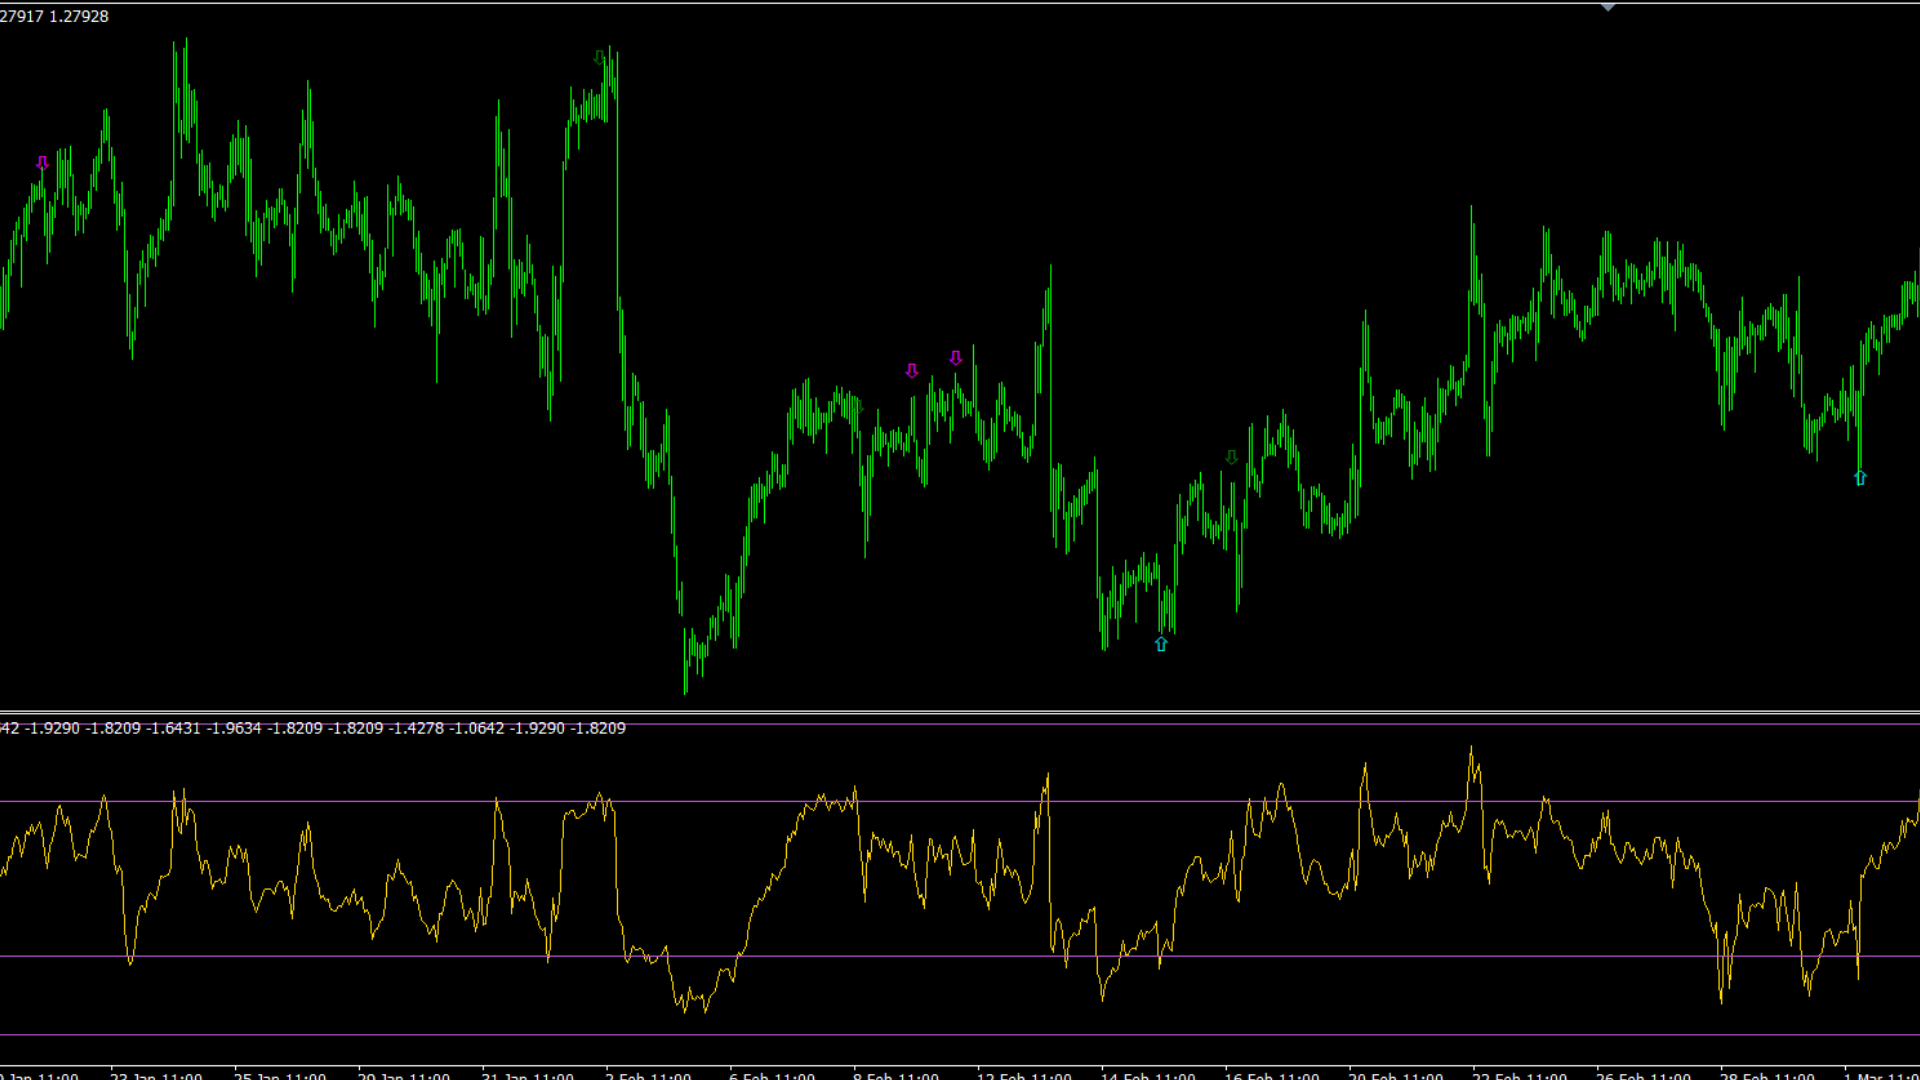
Extreme Value Sniper is a detrended price indicator Indicator finds the potential reversal levels by checking value ranges and price cycles.
***Indicator does NOT repaint so it provides accurate NO REPAINT REVERSAL SIGNALS***
MT4 Version of the Indicator: https://www.mql5.com/en/market/product/114426
It shows the overbought and oversold levels using the average range.
Overbought Levels are between 4 and 10
Oversold levels are bewtween -4 and -10
Those levels can be used as a reversal levels.
Extreme Value Sniper look for some special divergence and convergence patterns to confirm the reversal.
Other AI and informative math applications of the indicator are Murrey Math, Fibonacci Gann, Volumes and Harmonic Patterns.
***Unlike other indicators, Extreme Value Sniper DOES NOT REPAINT.
***Extreme Value Sniper can be used with our Cycle Sniper indicator or it can be used as a stand alone indicator.
***It works for any financial instrument including Gold, Crude Oil,Currencies,Cryptocurrencies,Indices and Stocks.
***It can be used for any timeframe.
***User friendly settings
Please follow this blogpost for the details and tricks for different strategies:
https://www.mql5.com/en/blogs/post/756721
Inputs to pay attention:
- Magic Number: To look for different periods for the signals, you can apply indicator several times onto the chart. In this case you need to change the magic number.
You can watch the video for details in the blog post.
- Range Period Bars: Range period ( number of bars ) to check to identify extreme ( Ovebought/Oversold ) Levels
- Signal Settings
Sell Extreme Level: Indicator will look for sell signal when the value is above /equal to input level
Buy Extreme Level: Indicator will look for buy signal when the value is below /equal to input level
Close Price or Hi-Low: Price levels on the current bar to check signal
Show Chart Lines: If enable you can see the divergence lines on the chart
Show Indicator Lines: If enable you can see the divergence lines on the indicator's sub window
No of bars for signal: X bars to look for potential reversal pattern. If you make it bigger , indicator will look for a bigger number of bars to find reversal patterns.
Candle for confirmation arrow: Default is 1. If you make it bigger, you can reduce the false signals but you receive late confirmation.
Important Note for Strategy Tester: To get better backtest results, use it on "every tick" mode
Please contact us after your purchase to get full video tuttorial where we show different strategies.
We will send the bonus indicators to complete the system.
If you contact us after your purchase, I will send you two set files that are seen in the videos.