BeST Hull Single MA Strategy MT5
- 지표
- 버전: 1.10
- 업데이트됨: 11 1월 2022
- 활성화: 10

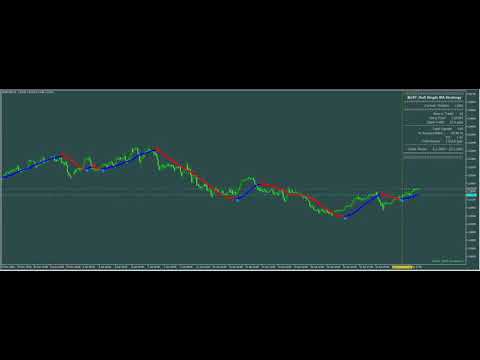
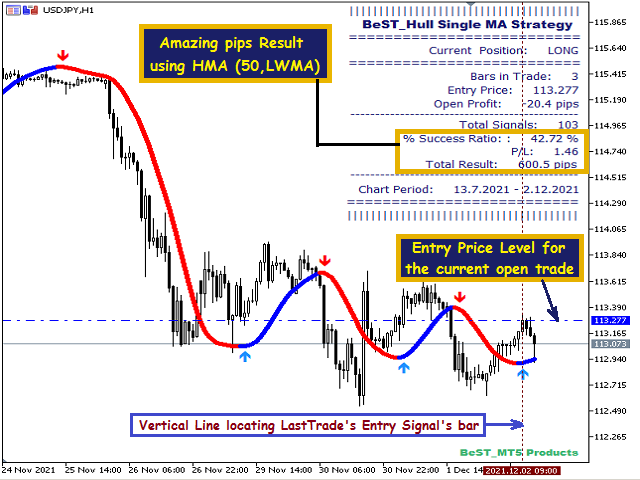
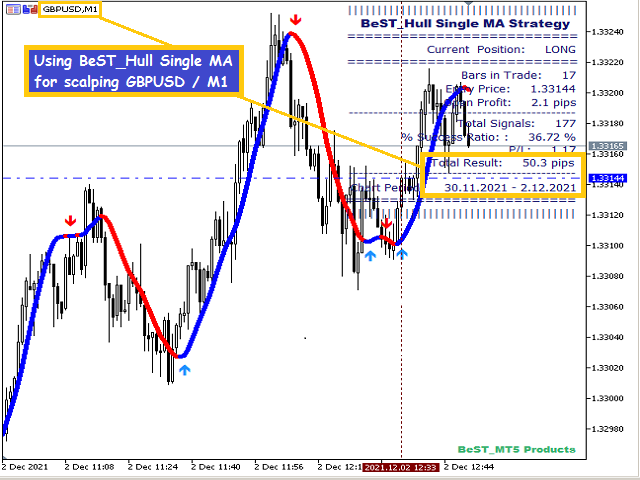
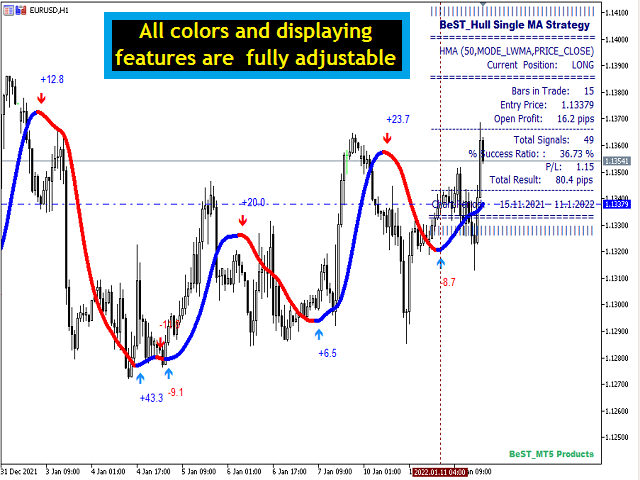
BeST_Hull Single MA Strategy is an Metatrader Indicator based on the famous indicator Hull Mov.Average. This indicator can display the Single HMA Strategy of just 1 Hull MAvg. It uses added internal filters locating the most likely Entries while it can be used as a standalone system or as an add-on to other ones.
Basic Settings
Generally the Hull Moving Average (HMA - developed by Alan Hull) is a directional trend indicator. It captures the current state of the market and uses recent price action to determine if conditions are bullish or bearish relative to historical data. According to Alan Hull the HMA almost eliminates lag altogether and manages to improve smoothing at the same time.
Alan Hull recommends using his moving average for directional signals and not for crossovers which could be distorted by the lag.
But also always when it comes to any type of Moving Averages the DSM (i.e. Directional Slope Method) used by this indicator often is a much better choise than the basic crossover methods (see about at “Trading Systems That Work” by Thomas Stridsman). Based on this logic added to the Hull MAs logic this indicator signals Long and Short reversed trades according to the Directional method and so resulting to the Hull Single MA Strategy.
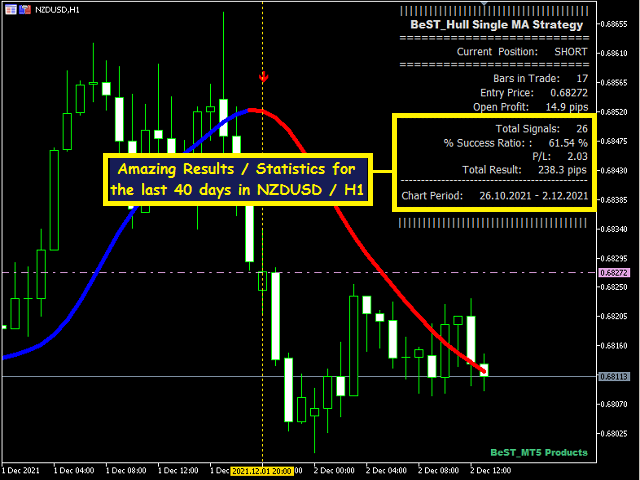
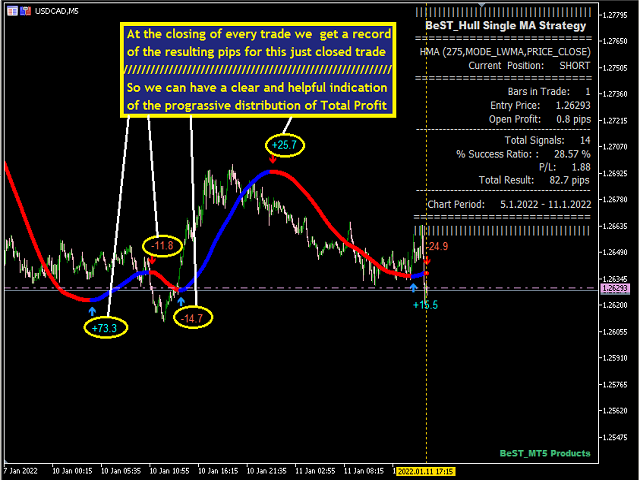
Also at the closing of every trade there is a record of the resulting pips.It is a clear and helpful indication of the prograssive distribution of Total Profit which refers to all so far closed trades.
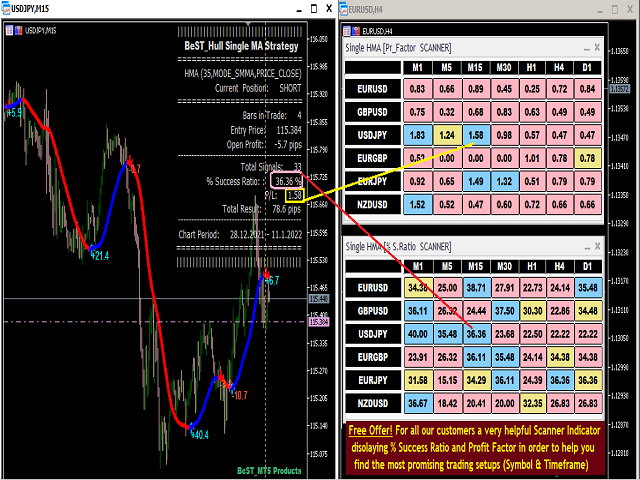
You can Maximize its potentiality by using our free offer for everyone who purchased the product that is a very useful Multi-Scanner Indicator displaying % Success Ratio and Profit Factor (P/L) in order to find the most promising trading setups (Symbols and Timeframes).
Input Parameters
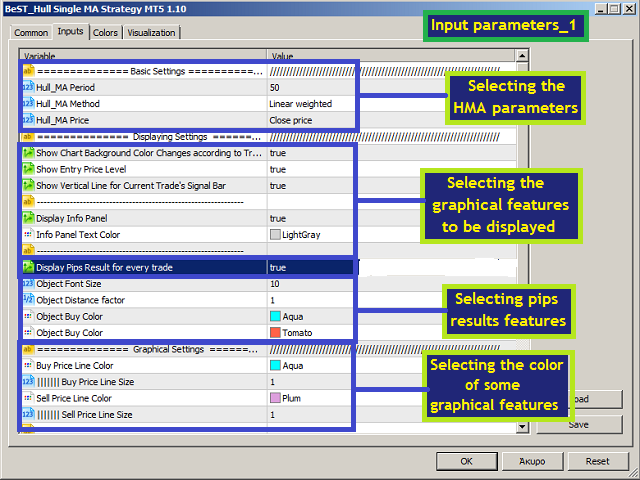
Basic Settings- Hull_MA Period
- Hull_MA Method
- Hull_MA Price
Displaying Settings
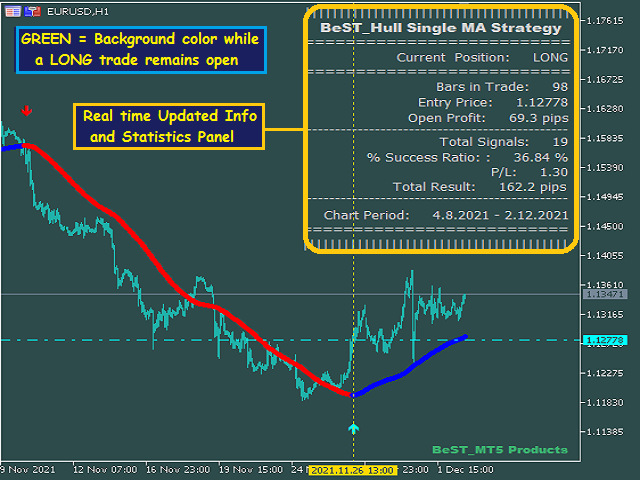
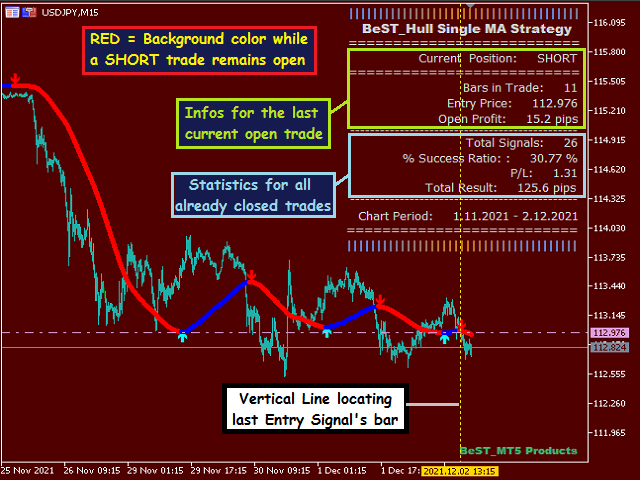
- Show Chart Background Color Changes according to Trade Type
- Show Entry Price Level
- Show Vertical Line for Current Trade's Signal Bar
- Display Info Panel
- Info Panel Text Color
Graphical Settings
- Buy Price Line Color
- Buy Price Line Size
- Sell Price Line Color
- Sell Price Line Size
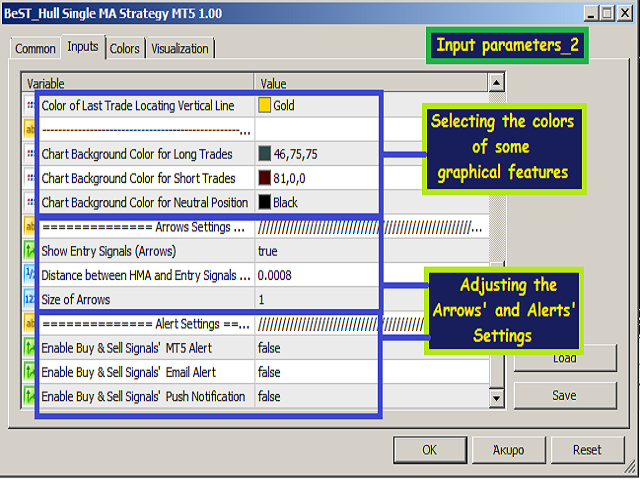
- Color of Vertical Line locating Last Trade's Entry Signal
- Chart Background Color for Long Trades
- Chart Background Color for Short Trades
- Chart Background Color for Neutral Position
Arrows Settings
- Show Entry Signals (Arrows)
- Distance between HMA and Entry Signals (Arrows)
- Size of Arrows
Alert Settings
- Enable Buy & Sell Signals' MT5 Alert
- Enable Buy & Sell Signals' Email Alert
- Enable Buy & Sell Signals' Push Notification
For EA Developers
- Buy Arrow: Buffer 0
- Sell Arrow: Buffer 1
添加指标后不能添加文本标注,趋势线标注等,希望更新最新版本,感谢!