UturnAnalysis
- 지표
-
Vasilii Luchnikov
 Instagram for feedback and monitoring of semi-automated trading
Experience in processing strategy creation can be found here - 버전: 5.0
- 업데이트됨: 21 7월 2021
- 활성화: 5
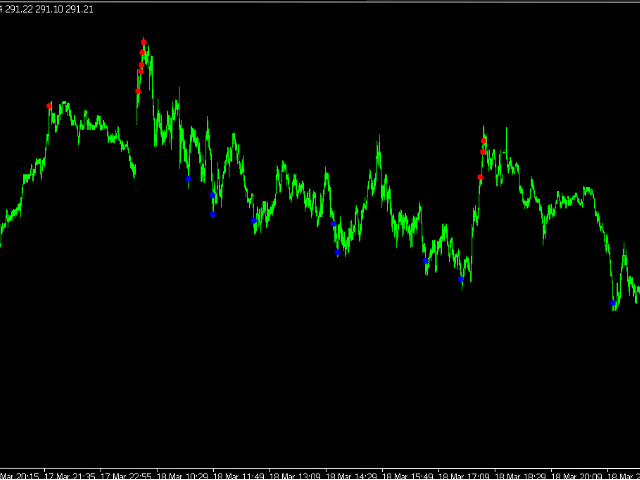
Good afternoon. UturnAnalysis- to check the quality of the indicator
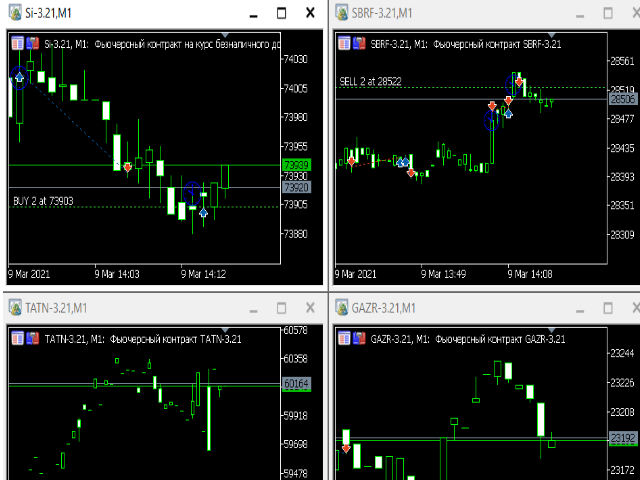
WE HAVE LAUNCHED A TRIAL VERSION free distribution of signals about reversals based on this indicator for the futures and stock markets of the MICEX
write to tech support, me 777basil@mail.ru , or in the comments your email address and we will send you the account details where the alerts are sent, for free.
we put it on several tools at once
will save you time at the monitor, between signals you can do something useful,
The reversal zone indicator is designed as a complex ANALYZER of the Symbol state at a fixed time.
Today we present the BETTA Version, which is well suited for flat and overclocking deposit strategies, if you know the reversal level in advance,
then you can take action and fix the profit, move the STOP LOSS to the breakeven zone, or expand your trade, adding additional volumes if necessary.
For the full operation of the Analyzer, you need to download our free, previously published indicators https://www.mql5.com/ru/users/777basil/seller. Thanks.
The indicator does not appear on the screen after installation, but requires additional settings for email notifications.
(the details of configuring the terminal to send notifications to your email can be found here):https://www.mql5.com/ru/forum/137114
Contacts for communication 777basil@mail.ru , we will prepare an expert, an indicator for your task.