MetaTrend M5
- 지표
-
Vahidreza Heidar Gholami
 I'm a software engineer with over 15 years of experience in programming and software development. As an active member of the MQL5 community, I strive to deliver high-quality products. My goal is to create efficient and productive tools for traders, and I have a wealth of innovative ideas to achieve
 - 버전: 1.5
- 업데이트됨: 17 4월 2023
- 활성화: 10
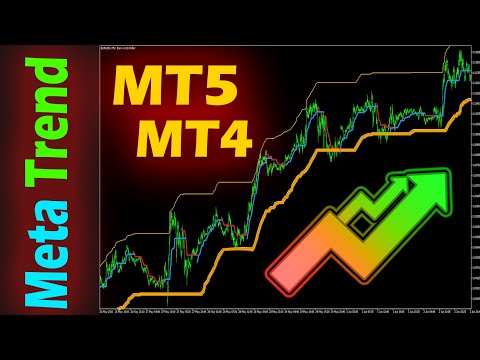
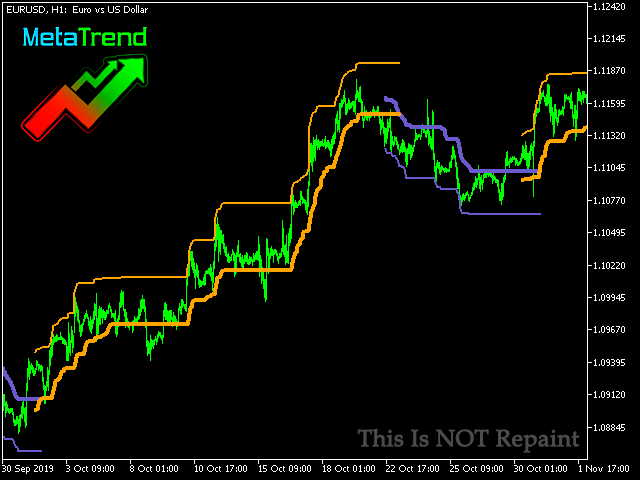
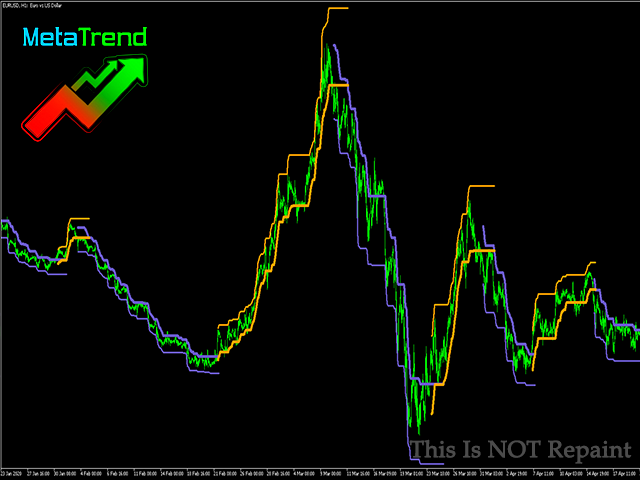
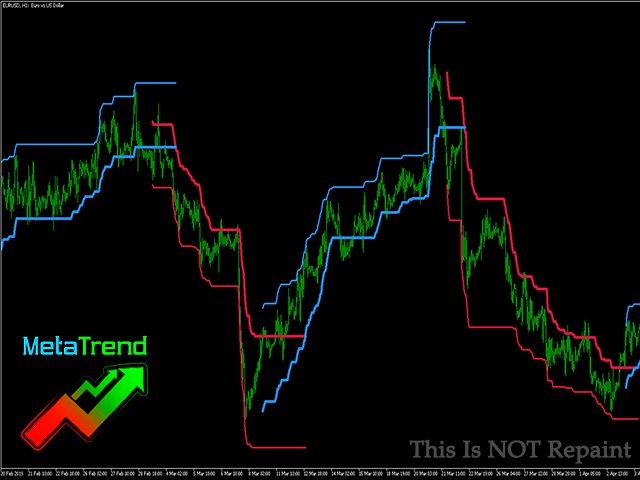
Meta Trend Indicator is an efficient way to forecast and detect the trend in any market. It reveals the trend, support and resistance levels, volatility and the maximum potential target, all in one indicator. To adapt to the price and to decrease consecutive trend failures, the internal trend detector algorithm studies the market and dynamically chooses the right values for the internal parameters. This indicator is a perfect trend filter for any strategy or expert advisor.
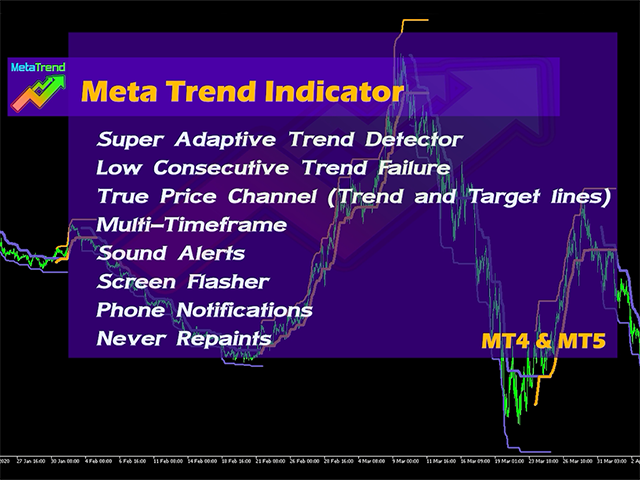
Features
- Super Adaptive Trend Detector Algorithm
- Low Consecutive Trend Failure (Very important for money management)
- True Price Channel (Trend and Target lines)
- Sound Alerts, Push Notifications, Screen Flasher, …
- Multi-Timeframe
- Never Repaints
Input Parameters
| Input Name | Description |
|---|---|
| Period | The maximum size of the window which is used to calculate the trend. The default is 100 bars, try other values like 150 and 200 to find the best period. |
| Sensitivity | A percentage value (0 to 100) which defines how fast the indicator detects reversal points. |
| STD Period | This input is zero by default and will be set automatically based on the first input. STD Period and Period inputs are the key inputs that can be optimized for Expert Advisors. |
| Trend Reversal Response | A percentage value (-100 to 100) which tell the indicator how dynamic it can response to the market volatility. |
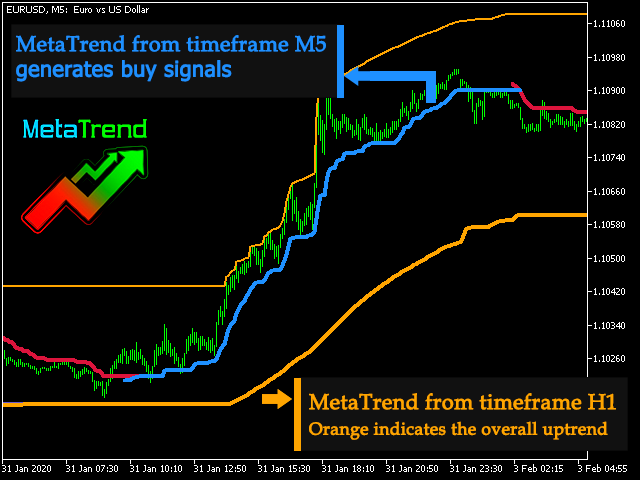
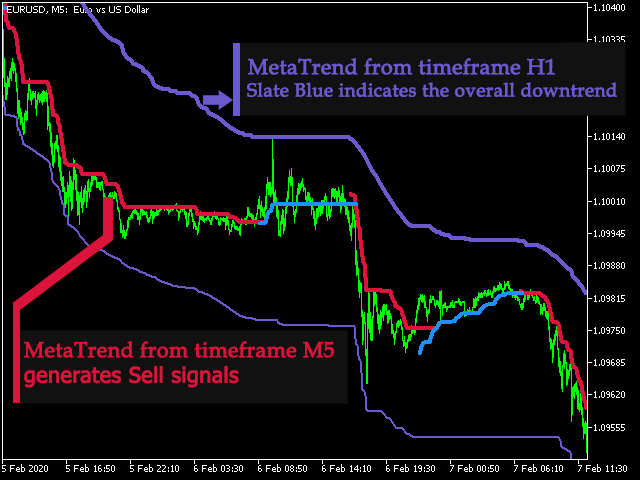
| Lock inputs on timeframe | Lower timeframes have more details but they are noisier. To get the advantage of details and avoid noises, use the indicator on low timeframes but lock the inputs on a higher timeframe. Locking on a higher timeframe makes MetaTrend recalculates the inputs in such a way to generate almost the same trend shape like the one from the higher timeframe. This way trend reversals can be detected with lower lags. |
| Show Targets | Shows the target lines and creates a channel around the price. A target line is a forecast for the next potential price that the market will hit in its next move. |
| Calculate once per bar | For quick testing and optimizing of expert advisors, enable this input. |
| Alert Trend | Enable this to get alerted when the trend changes. |
| Signals per Trend | Controls the frequency or occurrence of signals generated within each individual trend. |
| Signals at Same Level | The number of alerts or signals generated at the same price level. |
| Signal Zone Alert | Limits the generation of alerts or signals within a zone, which starts at the beginning of trends and continues for a specified multiple of the channel width, providing customization of sensitivity and responsiveness to trend changes. |
| Sound Alert | Generates a sound on trend change or price crossover. |
| Flasher | For traders who use multiple charts on multiple screens, enable this input to get visual alerts. |
| Push Notification | To get notification on your smart phone enable this input. |
| Email Alert | Get alerted using your email. |
| Popup Alert | Get alerted using the MetaTrader popup alert window. |
| Alert Message Title | You can use multiple MetaTrend on the same chart for different purposes. For example, use one MetaTrend for getting overall trend and another one for Buy/Sell signals. To distinguish them use this input to add a title to the messages. |


사용자가 평가에 대한 코멘트를 남기지 않았습니다