Ind2tompson

NewTest

https://backoffice.aurum.foundation/u/DHXP1U


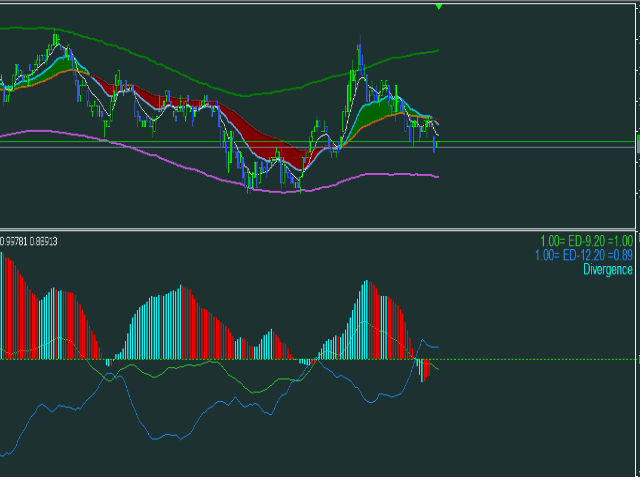
The 2indtompson indicator is an indicator for comparing two instruments for determining volumes, for balancing in pair trading or arbitrage trading, prepared from an analog version for the MT4 terminal. So if you need to compare how much two instruments will weigh and you don't know how to do it, then put an indicator on the chart and it will automatically calculate the volumes needed for balancing. Additionally, the indicator shows the state of the instruments relative to each other - Divergence/Convergence.

It is recommended to use it on M5/M15/H1 timeframes.


https://youtu.be/kgbIgnujuAM


  Contacts for communication 777basil@mail.ru according to your technical task, we will write, manufacture, rework, and correct the expert Advisor / indicator / script. Thanks.


추천 제품
Crystal Quantum Flow
Muhammad Jawad Shabir
Crystal Quantum Flow 고급 시장 인텔리전스 인디케이터 Crystal Quantum Flow는 명확성, 정밀성, 그리고 기관급 시장 인사이트를 요구하는 트레이더를 위해 설계된 차세대 전문 트레이딩 인디케이터입니다. 이 인디케이터는 다차원 시장 흐름 분석, 다중 타임프레임 동기화 인텔리전스, 그리고 고급 시각적 해석을 하나의 강력한 차트 환경에 통합한 완전한 의사결정 지원 시스템으로 구축되었습니다. Crystal Quantum Flow의 내부 아키텍처는 완전히 독점적이며 보호되어 있습니다. 모든 분석 모델은 폐쇄형 시스템으로 작동하며, 일반적인 리테일 인디케이터나 공개된 공식에 기반하지 않습니다. 핵심 개념 Crystal Quantum Flow는 시장의 움직임을 개별적인 가격 변동이 아닌, 압력·모멘텀·방향 지배력이 연속적으로 흐르는 과정으로 해석하도록 설계되었습니다. 시장 노이즈에 반응하는 대신, 확정된 시장 상태와 전환에 집중하여 트레이더가 지배적인 힘과 일관되게
FREE
Fixed Volume Profile
Carlos Pascual Perez Maturano
This indicator, titled "Fixed Volume Profile.mq5", is a custom tool for MetaTrader 5 (MQL5) designed to calculate and display a Volume Profile over a user-defined fixed time range. The Volume Profile shows the distribution of trading volume at different price levels during a specific period, helping to identify areas of high activity (such as Points of Control or POCs) and volume-based support/resistance areas. Main Functionality: Interactive Range: The indicator creates two vertical lines on
Klinger Volume Oscillator  Short Description A volume-based flow analysis tool designed to visualize buying and selling pressure through a dual-colored histogram. Detailed Description The Klinger Volume Oscillator Histo is a technical analysis indicator that explores the relationship between price movement and transactional volume. By converting the traditional Klinger Oscillator into a dynamic histogram, this tool allows traders to observe the internal strength of market movements. The indicat
Clarity Pulse Detector
Camila Bernardez Camero
Clarity Pulse Detector Clarity Pulse Detector 닫힌 봉과 해당 거래량 막대를 분석하여 향후 데이터에 의존하지 않고 실제 추세 전환을 식별합니다. 이 지표는 구성 가능한 SSP(신호 강도 매개변수) 설정을 기반으로 펄스 강도를 계산하고 최근 최고점과 최저점을 비교하여 돌파 지점을 감지합니다. 필요한 조건이 닫힌 봉에서 충족되면 도구는 해당 봉 위에 명확한 매수 또는 매도 표시를 그립니다. 모든 계산은 확인된 봉에서 수행되므로 과거 신호에 잘못된 조정이 발생하지 않습니다. Signal 유효한 전환이 감지되면 지표는 매수 신호를 나타내기 위해 강세 봉 아래에 녹색 원을 표시하거나 매도 신호를 나타내기 위해 약세 봉 위에 빨간색 원을 표시합니다. 이 표시들은 봉이 마감될 때 정확히 나타나므로 다음 오픈 시 즉시 진입할 수 있습니다. 모든 화살표와 원은 닫힌 봉에 표시되므로 신호가 표시되면 이동하거나 사라지지 않습니다. HOW TO USE IT
Volume Data on Candles Indicator for MetaTrader 5 Maximize your trading insights with the Volume Data on Candles indicator for MetaTrader 5. This powerful tool provides real-time volume data directly on each candle, allowing you to identify significant shifts in market activity. When the volume of a candle exceeds the average of the last 50 candles, it will be clearly highlighted , ensuring you don't miss out on potential high-volume movements. Key Features: Real-Time Volume Data : Displays volu
FREE
- This is an indicator of directional movement that allows you to determine the trend at the time of its inception and set the levels of a protective stop. Trailing can be carried out both from below, when the stop level is below the current price and is pulled up behind the price if it increases, and above, when stop levels are above the current price. Unlike trailing with a constant distance, the stop level is set at the lower boundary of the quadratic regression channel (in the case of tra
Basic Volume Profile MT5
Mehran Sepah Mansoor
메타트레이더용 거래량 프로필 인디케이터로 거래량 분석의 힘을 발견하세요!   /   MT4 버전 기본 거래량 프로필은 거래를 최적화하려는 수동 트레이더를 위해 특별히 설계된 지표입니다. 거래량 프로필 인디케이터는 시장 움직임을 더 잘 이해하고자 하는 진지한 트레이더에게 필수적인 도구입니다. 혁신적인 솔루션을 사용하면 거래량이 가격별로 어떻게 분포되어 있는지 명확하고 간결하게 시각화할 수 있습니다. 이를 통해 지지 및 저항 수준, 누적 및 분포 영역, 주요 제어 지점과 같은 주요 관심 영역을 식별할 수 있습니다. 특정 날짜의 거래량을 나타내는 일반 거래량 표시기와 달리 기본 거래량 프로필은 특정 가격의 거래량을 보여줍니다.  이 인디케이터는 직관적이고 사용자 지정 가능한 인터페이스를 갖추고 있어 거래 선호도에 맞게 조정할 수 있습니다. 특징 가격 차트에 거래량 프로필을 명확하게 표시합니다. 거래량이 많은 영역과 적은 영역을 빠르게 식별합니다. 트레이딩 스타일에 맞게 색상과 스타
LL High Frequency HFT EA
Leopoldo Licari
4 (4)
LL High Frequency HFT EA is a High Frequency Trading Expert Advisor that uses a very fast and high-performance proprietary execution code capable of executing high-frequency and low-latency opening tasks. It also integrates within its code an instant closing system for all orders , unlike systems that close orders in a loop, losing precious milliseconds that are essential in HFT systems.  Please read the guide carefully before you start using EA, so you can know all the features and my suggesti
Quickview
Guilherme Emiliao Ferreira
Quickview The Quickview indicator instantly highlights asset variations, delivering crystal-clear market insights at a glance. Effortlessly track multiple assets with visual simplicity, enabling quicker, smarter, and more confident trading decisions daily. ️ Key Features Real-Time Asset Tracking: Instantly monitor multiple assets simultaneously, never missing a critical market move. Flexible and Intuitive Display: Personalize your view, displaying assets exactly as you want—clear, concise, c
FREE
거래의 세계에서는 모든 틱이 새로운 이야기의 시작이 될 수 있기 때문에 신뢰할 수 있는 동반자를 갖는 것이 중요합니다. TrendVarianceSpectrum은 단순한 트레이딩 로봇이 아닙니다. 변동성이 큰 시장에서 여러분의 가이드입니다. 수년간의 경험을 바탕으로 개발되었으며 25년 이상의 데이터로 학습된 이 시스템은 수학의 우아함과 현대 기술의 힘을 결합했습니다. TrendVarianceSpectrum의 주요 장점: 최소 드로다운:   TrendVarianceSpectrum은 매우 낮은 드로다운으로 운영되어 신뢰성을 중시하는 트레이더에게 가장 안정적인 솔루션 중 하나입니다. 변동성 적응력:   이 시스템은 EURUSD, XAUUSD, EURJPY와 같은 까다로운 상품에서 뛰어난 성능을 발휘하며, 시장의 높은 변동성 기간 동안에도 탄력성을 보여줍니다. 다양한 시간대 적용:   M30, H1, H2, H3 또는 H4와 같은 다양한 시간대에 걸쳐 TrendVarianceSpectrum은
Trailing Uses Standard Deviation.   A daptive_Trailing_uses_StdDev_Indicator is an indicator of directional movement that allows you to identify a trend at the time of its inception and set the levels of a protective stop. Unlike trailing with a constant distance, the indicator uses the distance to the price proportional to the current standard deviation of StdDev. The distance is equal to the product of the standard deviation and the constant coefficient set by the user. Thus, the trailing
Gm Aggressive Volume
Antonio Augusto Barreto De Melo
5 (1)
Volume is a resource used by analysts of various methodologies, precisely because it shows the confirmation of movements and the market's progress. It is an indicator that analyzes the financial quantity that was traded during a certain period. This indicator analyzes the amount of volume for each candle, when there is an excessive increase in this, it differs from the others by a colored bar. In addition to informing in the form of colored bars, this indicator allows you to emit an audible w
TakVWAP
Oscar Alejandro Palacios Aranguiz
5 (1)
tak.VWAP – Volume Weighted Average Price A reliable and lightweight VWAP indicator designed for traders who require flexibility and visual clarity. Key Features: Two calculation modes: Rolling VWAP: Based on a configurable number of candles. Daily VWAP: Automatically resets at the start of each trading day. Fully customizable line style : color, width, visibility, and line type. Clean input structure with grouped sections for ease of use. EA-friendly : exposes buffer for use in Expert Advisors
SyntheticIndices
Stanislav Korotky
The indicator compares quotes of a given symbol and a synthetic quote calculated from two specified referential symbols. The indicator is useful for checking Forex symbol behavior via corresponding stock indices and detecting their convergence/divergence which can forecast future price movements. The main idea is that all stock indices are quoted in particular currencies and therefore demonstrate correlation with Forex pairs where these currencies are used. When market makers decide to "buy" one
Server Timer
Ariesnyne Sanday
Server Timer  Version: 1.2 The Server Time Clock Indicator is a lightweight and visually appealing tool for displaying the server's current date and time directly on the chart. This indicator updates dynamically every second and provides the following features: Customizable Appearance : Adjust font color, background color, and font size to match your chart's theme. Day and Time Display : Shows the current day, date, and time in an easy-to-read format ( Day{MM/DD} HH:MM:SS ). No Performance Over
FREE
BigMindset Liquidity & Volatility Indicator – $120 Price: $120 USD Overview: The BigMindset Liquidity & Volatility Indicator is a powerful stand-alone tool for MetaTrader 5 that visually identifies low liquidity, high liquidity, and consolidation zones in the market. It provides traders with actionable insights to help avoid whipsaws, recognize strong momentum, and make smarter trading decisions—all without cluttering the chart. Why You Need This Indicator: Instant Market Clarity Quickly see th
Horizontal volume bars, Cluster analysis, Volume profile Volume in Range gets information about the accumulated volume in a specified vertical range and period in bars. The received data is then plotted on the chart as rectangular boxes with the volume quantity inside. Usage:- The tool acts as a support resistance levels but most importantly it should be used to check in which direction the price breaks out of the significant levels formed by this indicator and then actions to be taken on correc
DLMACD
Roman Sukhorukov
DLMACD - Divergence Local (Wave) MACD . The indicator displays divergences by changing the color of the MACD histogram. The indicator is easy to use and configure. It was created as an addition to the previously published DWMACD . For the calculation, a signal line or the values ​​of the standard MACD histogram can be used. You can change the calculation using the UsedLine parameter. It is advisable to use a signal line for calculation if the histogram often changes directions and has small val
FREE
Volume Profile Advance
Israr Hussain Shah
Daily & Composite Volume Profile   This is a professional-grade market profile tool designed for MetaTrader 5. It utilizes a   Dual-Profile System   to visualize supply, demand, and liquidity concentrations. Key Features Left Side: Daily Session Profiles Automatically identifies the start and end of every trading day. Generates a unique Volume Profile for each individual day. Allows you to see how value migrated from yesterday to today (e.g., Is today's volume higher or lower than yesterday?).
Trend Teller
Ian Nganga Comba
Trend Teller는 모든 주요 통화쌍과 모든 시간대(M1부터 MN1까지)의 시장 트렌드를 한눈에 파악할 수 있는 강력하고 직관적인 대시보드 도구입니다. 트레이더가 직접 만든 이 도구는 시장 트렌드 분석에서 추측을 제거하고, 더 큰 흐름에 맞춰 거래할 수 있도록 도와줍니다. 대부분의 초보 트레이더는 시장 방향을 파악하는 데 어려움을 겪으며, 심지어 숙련된 전문가들조차도 방향을 잘못 판단할 때가 있습니다. 그래서 Trend Teller는 초보자부터 전문가까지 모든 트레이더에게 이상적인 도구입니다. 주요 기능: 다중 시간대 분석 모든 주요 통화쌍의 강도와 방향을 즉시 스캔합니다. 스캘핑이든 스윙 트레이딩이든, Trend Teller는 모두를 지원합니다. 사용자 맞춤형 표시 데이터가 너무 많다고 느껴진다면? 걱정 마세요. 숫자만 표시하거나 색상 신호만 표시하거나, 원한다면 특정 시간대를 숨길 수도 있습니다. 내장 알림 기능 하루 종일 화면을 바라볼 필요 없습니다! 강한 추세나 거래 아
FREE
VMS Oscillator
Vincent Jose Proenca
Volume & Move Strength (VMS) Indicator for MT5 The VMS Indicator displays the relationship between trading volume and price movement strength, helping traders assess how well market activity supports price action. How It Works: Measures tick volume as trading activity. Calculates move strength using a normalized True Range (%). Both values can be smoothed (default: 5) and optionally normalized (0–100) for consistency across markets. Plots two lines in a separate window: Blue (Volume) – trading a
FREE
Strength Radar2
Erick Guimaraes Dos Santos
Strength Radar 02 – Take Your Trading to the Next Level! Hello, trader! If you're looking for a tool to level up your game in forex, Strength Radar 02 is exactly what you need! Developed with passion and expertise, this indicator turns currency strength analysis into something simple and powerful. With it, you'll have a clear view of the real-time performance of AUD, CAD, CHF, EUR, GBP, NZD, JPY, and USD , using indicators like MA, MACD, RSI , and more — all fully customizable your way! Ima
거래량 가중 MACD 볼륨 가중 MACD(VW-MACD)는 Buff Dormeier가 작성했으며 그의 책 Investing With Volume Analysis에 설명되어 있습니다. 볼륨 가중 가격 추세의 수렴과 발산을 나타냅니다. 볼륨을 포함하면 VW-MACD가 일반적으로 기존 MACD보다 응답성과 신뢰성이 높아집니다.   MACD(이동 평균 수렴 발산)란 무엇입니까? 이동 평균 수렴 발산은 1979년 Gerald Appel에 의해 만들어졌습니다. 표준 MACD는 단기 지수 평균과 장기 지수 평균 간의 차이를 표시합니다. 차이(MACD 라인)가 양수이고 상승하면 가격 추세가 상승하고 있음을 나타냅니다. MACD 라인이 음수이면 가격 추세가 하락하고 있음을 나타냅니다. 이 차이의 부드러운 지수 평균이 계산되어 MACD 신호 라인을 형성합니다. MACD선이 MACD 신호선 위에 있으면 MACD의 모멘텀이 상승하고 있음을 나타냅니다. 마찬가지로 MACD가 MACD 신호선 아래
When looking at the volume information that moves the market, a question arises: is it a strong or weak movement? Should it be compared with previous days? These data should be normalized to always have a reference. This indicator reports the market volume normalized between 0-100 values. It has a line that smoothes the main signal (EMA). The normalization of values occurs within an interval defined by user (21 bars on default). User can also define any relative maximum, timeframe and number of
Historical Memory
Marat Sultanov
3.33 (3)
Indicator-forecaster. Very useful as an assistant, acts as a key point to forecast the future price movement. The forecast is made using the method of searching the most similar part in the history (pattern). The indicator is drawn as a line that shows the result of change of the close price of bars. The depth of history, the number of bars in the forecast, the patter size and the quality of search can be adjusted via the indicator settings. Settings: PATTERN_Accuracy_ - quality of the search.
FREE
TMA Centered Bands Indicator
Irina Cherkashina
5 (1)
The TMA Centered Bands Indicator for MT5 draws bands on the chart and shows the overall price trend. It displays three bands - the lower and upper boundaries of the channel and the median.   The bands are made up of moving averages, and each of them has an MA period. The name TMA comes from triangular moving averages, as the indicator draws triangular bands.   The price will fluctuate between these ranges whenever the trend changes direction, thus creating entry and exit points.   How to trade
FREE
RSIScalperPro
PATRICK WENNING
RSIScalperPro를 소개합니다 - 메타트레이더 5용 RSI 기반의 혁신적인 인디케이터로, 1분 차트에서의 스캘핑에 최적화되어 있습니다! RSIScalperPro를 사용하면 정확한 진입 및 청산 신호를 제공하는 강력한 도구를 손에 넣을 수 있습니다. RSIScalperPro는 서로 다른 두 가지 RSI 지표를 사용하여 과매수 및 과매도 레벨에 대한 명확한 신호를 제공합니다. 2개의 RSI의 시간 프레임 및 제한 값을 원하는 대로 조정하여 트레이딩 전략에 최적화된 결과를 얻을 수 있습니다. 차트 상의 개별 화살표는 거래 진입 및 청산 타이밍을 쉽게 파악하는 데 도움이 됩니다. 또한 RSIScalperPro의 특징 중 하나는 사용자 정의 가능한 3개의 이동 평균선입니다. 이를 통해 트렌드의 방향을 판단하고 강력한 거래 신호를 확인하는 데 도움이 됩니다. 이를 통해 조기에 트렌드를 감지하고 수익성 높은 거래에 참여할 수 있습니다. 뿐만 아니라 RSIScalperPro는 새로운 거래
수요 공급 볼륨 존 — 기관급 지지/저항 및 매수·매도 압력 표시 Supply Demand Volume 는 가격 구조, 거래량 분석 및 실시간 변동성을 기반으로 주요 수요 및 공급 구역을 자동으로 탐지하는 정밀한 도구입니다. 정확한 지지/저항 레벨, 수급 흐름, Wyckoff 이론 또는 스마트 머니 개념을 사용하는 트레이더를 위해 설계되었으며, 매수/매도 세력 비교 및 잠재적 반전 신호를 시각적으로 제공합니다. 주요 기능: 자동 존 탐지 – 과거 고점/저점 및 ATR(평균 진폭)을 기반으로 주요 기관 거래 구역을 감지합니다.   매수/매도 볼륨 분석 – 실시간으로 매수/매도 세력의 강도를 시각화하여 방향성을 확인합니다.   중간선 및 가격 라벨 – 컬러와 가격 마커가 포함된 중간선 제공.   시간 기반 확장 – 구역이 자동으로 미래까지 확장되어 지속적으로 유효하게 유지됩니다. 추천 대상: 반전 트레이더 돌파 트레이더 볼륨 및 프라이스 액션 기반 트레이더 스캘핑 및 인트라데
Stats Summary
Elidio Xavier Guimaraes
Enhance Your Technical Analysis with Stats Summary . The Stats Summary is a robust analytical tool developed for MetaTrader 5 (MT5), providing a detailed statistical overview of price behavior. Unlike traditional indicators, it uses descriptive statistics to map the distribution of prices over a customizable sample period. By defining the sample size, the indicator calculates and displays the following values on the chart: Minimum and Maximum (Min/Max): The complete price range of the selected i
Trend Pulse X
Murtadha Majid Jeyad Al-Khuzaie
The Trend Pulse X – Continuous Colored Line is a next-generation trend-following indicator designed to give traders a crystal-clear view of market direction, strength, and momentum. Unlike standard indicators that often leave gaps or inconsistent readings, Trend Pulse X delivers a smooth, continuous line that adapts dynamically to price action, ensuring you always have a reliable guide on your chart. With its innovative color-coded system, Trend Pulse X helps traders instantly identify bullish
이 제품의 구매자들이 또한 구매함
이 지표를 구매하면 제 프로페셔널 트레이드 매니저를 무료로 드립니다. 우선 이 거래 시스템이 리페인팅, 리드로잉 및 레이그 인디케이터가 아니라는 점을 강조하는 것이 중요합니다. 이는 수동 및 로봇 거래 모두에 이상적인 것으로 만듭니다. 온라인 강좌, 설명서 및 프리셋 다운로드. "스마트 트렌드 트레이딩 시스템 MT5"은 새로운 및 경험이 풍부한 트레이더를 위해 맞춤형으로 제작된 종합적인 거래 솔루션입니다. 10개 이상의 프리미엄 인디케이터를 결합하고 7개 이상의 견고한 거래 전략을 특징으로 하여 다양한 시장 조건에 대한 다목적 선택이 가능합니다. 트렌드 추종 전략: 효과적인 트렌드 추이를 타기 위한 정확한 진입 및 손절 관리를 제공합니다. 반전 전략: 잠재적인 트렌드 반전을 식별하여 트레이더가 범위 시장을 활용할 수 있게 합니다. 스캘핑 전략: 빠르고 정확한 데이 트레이딩 및 단기 거래를 위해 설계되었습니다. 안정성: 모든 인디케이터가 리페인팅, 리드로잉 및 레이그가 아니므로 신뢰
Power Candles MT5
Daniel Stein
5 (3)
Power Candles – 모든 시장을 위한 강도 기반 진입 신호 Power Candles 는 Stein Investments의 검증된 강도 분석을 가격 차트에 직접 제공합니다. 가격 움직임에만 반응하는 대신, 각 캔들은 실제 시장 강도를 기준으로 색상화되어 모멘텀 형성, 강도 가속, 명확한 추세 전환을 즉시 파악할 수 있습니다. 모든 시장을 위한 단일 로직 Power Candles는 모든 거래 심볼 에서 자동으로 작동합니다. 현재 심볼이 Forex인지 비-Forex 시장인지 자동으로 감지하여 내부적으로 적절한 강도 모델을 적용합니다. Forex 및 Gold 는 FX Power Delta 값을 사용합니다 (절대값 범위 최대 100) 지수, 크립토 및 CFD 는 IX Power Strength 값을 사용합니다 (절대값 범위 최대 50) 필요한 강도 계산은 Power Candles에 완전히 내장되어 있습니다. 캔들 색상이나 신호 로직을 위해 추가 인디케이터는 필요하지 않습니다. 가격
Divergence Bomber
Ihor Otkydach
4.9 (80)
이 지표를 구매하신 분께는 다음과 같은 혜택이 무료로 제공됩니다: 각 거래를 자동으로 관리하고, 손절/익절 수준을 설정하며, 전략 규칙에 따라 거래를 종료하는 전용 도우미 툴 "Bomber Utility" 다양한 자산에 맞게 지표를 설정할 수 있는 셋업 파일(Set Files) "최소 위험", "균형 잡힌 위험", "관망 전략" 모드로 설정 가능한 Bomber Utility의 셋업 파일 이 전략을 빠르게 설치, 설정, 시작할 수 있도록 돕는 단계별 영상 매뉴얼 주의: 위의 모든 보너스를 받기 위해서는 MQL5 개인 메시지 시스템을 통해 판매자에게 연락해 주세요. 독창적인 커스텀 지표인 “Divergence Bomber(다이버전스 봄버)”를 소개합니다. 이 지표는 MACD 다이버전스(괴리) 전략을 기반으로 한 올인원(All-in-One) 거래 시스템입니다. 이 기술 지표의 주요 목적은 가격과 MACD 지표 간의 다이버전스를 감지하고, **향후 가격이 어느 방향으로 움직일지를 알려주는
Entry In The Zone and SMC Multi Timeframe 은 Smart Money Concepts(SMC)를 기반으로 개발된 실시간 시장 분석 도구입니다. 이 시스템은 트레이더가 시장 구조를 체계적으로 분석하고 전체적인 시장 방향을 더욱 명확하게 파악할 수 있도록 설계되었습니다. 시스템은 여러 시간대에서 반전 포인트(Reversal Points), 핵심 구역(Key Zones), 그리고 시장 구조(Market Structure)를 자동으로 분석하며, POI(Point of Interest), 노 리페인트(No Repaint) 신호, 자동 피보나치 레벨(Auto Fibonacci Levels)을 표시하여 되돌림(Pullback)과 반전 포인트를 정확하게 탐지할 수 있도록 돕습니다. 또한 실시간 신호와 알림을 통해 가격이 핵심 구역에 진입하거나 해당 구역에서 반전 신호가 발생하는 순간을 놓치지 않도록 보조합니다. 더불어 이 시스템은 인디케이터와 신호 시스템을 하나로
Game Changer Indicator mt5
Vasiliy Strukov
4.64 (11)
Game Changer는 모든 금융 상품에 사용하도록 설계된 혁신적인 추세 지표로, 메타트레이더를 강력한 추세 분석기로 탈바꿈시켜 줍니다. 이 지표는 재작성이나 지연 현상이 발생하지 않습니다. 모든 시간대에서 작동하며 추세 파악을 지원하고, 잠재적 반전 신호를 제공하며, 트레일링 스톱 메커니즘으로 활용되고, 신속한 시장 반응을 위한 실시간 알림을 제공합니다. 숙련된 투자자, 전문가, 또는 우위를 점하려는 초보자 등 누구나 이 도구를 통해 자신감과 원칙을 바탕으로, 그리고 근본적인 추세 역학에 대한 명확한 이해를 바탕으로 거래할 수 있습니다. 구매 후 바로 연락 주시면 개인 보너스를 드립니다! 강력한 지지선과 추세 스캐너 지표를 무료로 받으실 수 있습니다. 개인 메시지로 알려주세요 저는 텔레그램에서 EA나 특별 세트를 판매하지 않습니다. Mql5에서만 사용 가능하며, 세트 파일은 제 블로그에서만 볼 수 있습니다 . 사기꾼을 조심하시고 다른 사람에게서 세트를 구매하지 마세요 설정 추세
Atomic Analyst MT5
Issam Kassas
4.19 (27)
우선적으로 언급할 점은이 거래 지표가 다시 그리지 않고 지연되지 않으며 이를 통해 수동 및 로봇 거래 모두에 이상적이라는 점입니다. 사용자 매뉴얼: 설정, 입력 및 전략. Atomic Analyst는 가격의 강도와 모멘텀을 활용하여 시장에서 더 나은 이점을 찾는 PA Price Action Indicator입니다. 고급 필터를 장착하여 잡음과 거짓 신호를 제거하고 거래 잠재력을 높이는 데 도움이 됩니다. 복잡한 지표의 다중 레이어를 사용하여 Atomic Analyst는 차트를 스캔하고 복잡한 수학적 계산을 간단한 신호와 색상으로 변환하여 초보 트레이더가 이해하고 일관된 거래 결정을 내릴 수 있도록합니다. "Atomic Analyst"는 새로운 및 경험이 풍부한 트레이더를위한 종합적인 거래 솔루션입니다. 프리미엄 지표와 최고 수준의 기능을 하나의 거래 전략에 결합하여 모든 종류의 트레이더에 대한 다재다능한 선택지가되었습니다. 인트라데이 거래 및 스캘핑 전략 : 빠르고 정확한 일일
SuperScalp Pro
Van Minh Nguyen
5 (1)
SuperScalp Pro – 고급 다중 필터 스캘핑 인디케이터 시스템 SuperScalp Pro는 클래식 Supertrend와 여러 지능형 확인 필터를 결합한 고급 스캘핑 인디케이터 시스템입니다. 해당 인디케이터는 M1부터 H4까지 모든 타임프레임에서 효율적으로 작동하며, 특히 XAUUSD, BTCUSD 및 주요 외환 통화쌍에 적합합니다. 독립형 시스템으로 사용하거나 기존 거래 전략에 유연하게 통합할 수 있습니다. 이 인디케이터는 11개 이상의 필터를 통합하며, 빠른/느린 EMA, 추세 판별용 3개의 EMA, EMA 기울기(EMA slope), RSI, ADX, 거래량(Volume), VWAP, 볼린저 밴드 돌파(Bollinger Bands Breakout) 및 MACD 다이버전스 필터 등을 포함합니다. 스마트 캔들 필터는 캔들 종가를 확인하여 약한 신호를 제거하고, 3 EMA와 MACD 다이버전스 필터를 결합한 추세 인식 메커니즘은 더 높은 승률의 신호를 선별하는 데 도움을 줍니
Trend Screener Pro MT5
STE S.S.COMPANY
4.84 (100)
트렌드 표시기, 트렌드 트레이딩 및 필터링을 위한 획기적인 고유 솔루션, 하나의 도구 안에 내장된 모든 중요한 트렌드 기능! Forex, 상품, 암호 화폐, 지수 및 주식과 같은 모든 기호/도구에 사용할 수 있는 100% 다시 칠하지 않는 다중 시간 프레임 및 다중 통화 표시기입니다. Trend Screener는 차트에 점이 있는 화살표 추세 신호를 제공하는 효율적인 지표 추세 추종 지표입니다. 추세 분석기 표시기에서 사용할 수 있는 기능: 1. 트렌드 스캐너. 2. 최대 이익 분석이 있는 추세선. 3. 추세 통화 강도 측정기. 4. 경고가 있는 추세 반전 점. 5. 경고가 있는 강력한 추세 점. 6. 추세 화살표 Trend Screener Indicator가 있는 일일 분석 예, 일일 신호 성능...등은 여기에서 찾을 수 있습니다. 여기를 클릭하십시오. LIMITED TIME OFFER : Trend Screener Indicator는 50$ 및 평생 동안만 사용할 수 있습니다.
FX Power MT5 NG
Daniel Stein
5 (29)
FX Power: 통화 강세 분석으로 더 스마트한 거래 결정을 개요 FX Power 는 어떤 시장 상황에서도 주요 통화와 금의 실제 강세를 이해하기 위한 필수 도구입니다. 강한 통화를 매수하고 약한 통화를 매도함으로써 FX Power 는 거래 결정을 단순화하고 높은 확률의 기회를 발견합니다. 트렌드를 따르거나 극단적인 델타 값을 사용해 반전을 예측하고자 한다면, 이 도구는 귀하의 거래 스타일에 완벽히 적응합니다. 단순히 거래하지 말고, FX Power 로 더 스마트하게 거래하세요. 1. FX Power가 거래자에게 매우 유용한 이유 통화와 금의 실시간 강세 분석 • FX Power 는 주요 통화와 금의 상대적 강세를 계산하고 표시하여 시장 역학에 대한 명확한 통찰력을 제공합니다. • 어떤 자산이 앞서고 있고 어떤 자산이 뒤처지는지 모니터링하여 보다 현명한 거래 결정을 내릴 수 있습니다. 포괄적인 멀티 타임프레임 뷰 • 단기, 중기 및 장기 타임프레임에서 통화와 금의 강세를
Azimuth Pro
Ottaviano De Cicco
5 (1)
LAUNCH PROMO Azimuth Pro price is initially set at 299$ for the first 100 buyers. Final price will be 499$ . THE DIFFERENCE BETWEEN RETAIL AND INSTITUTIONAL ENTRIES ISN'T THE INDICATOR — IT'S THE LOCATION. Most traders enter at arbitrary price levels, chasing momentum or reacting to lagging signals. Institutions wait for price to reach structured levels where supply and demand actually shift. Azimuth Pro maps these levels automatically: swing-anchored VWAP, multi-timeframe structure lines, an
Quantum Trend Sniper
Bogdan Ion Puscasu
4.74 (53)
소개       Quantum Trend Sniper Indicator는   추세 반전을 식별하고 거래하는 방식을 변화시키는 획기적인 MQL5 지표입니다! 13년 이상의 거래 경험을 가진 숙련된 트레이더 팀이 개발한       Quantum Trend Sniper 표시기       매우 높은 정확도로 추세 반전을 식별하는 혁신적인 방법으로 거래 여정을 새로운 차원으로 끌어올리도록 설계되었습니다. ***Quantum Trend Sniper Indicator를 구입하면 Quantum Breakout Indicator를 무료로 받을 수 있습니다!*** Quantum Trend Sniper Indicator는 추세 반전을 식별하고 세 가지 이익실현 수준을 제안할 때 경고, 신호 화살표를 제공합니다. 초보자 거래자와 전문 거래자 모두에게 적합합니다. Quantum EA 채널:       여기를 클릭하세요 MT4 버전:       여기를 클릭하세요 추천: 기간:모든 기간.
Super Signal – Skyblade Edition 전문가용 노리페인트 / 노래그 트렌드 신호 시스템, 뛰어난 승률 제공 | MT4 / MT5용 1분, 5분, 15분과 같은 낮은 타임프레임에서 가장 좋은 성능을 보입니다. 핵심 기능: Super Signal – Skyblade Edition은 추세 매매를 위해 설계된 스마트 신호 시스템입니다. 이 시스템은 다중 필터 로직을 활용하여, 명확한 방향성과 실질적인 모멘텀이 수반된 고품질 추세만을 감지합니다. 이 시스템은   고점 또는 저점을 예측하지 않으며 , 다음 세 가지 조건이 모두 충족될 때만 신호를 발생시킵니다: 명확한 추세 방향 강화되는 모멘텀 건전한 변동성 구조 또한, 시장 세션 기반의 유동성 분석을 통해 신호의 신뢰성과 타이밍을 더욱 향상시킵니다. 신호 특성: 모든 화살표 신호는 100% 리페인트 없음 / 지연 없음 신호가 한 번 발생하면 고정되며, 깜빡이거나 사라지지 않음 차트 상의 시각적 화살표, 정보 패널, 팝업
PZ Swing Trading MT5
PZ TRADING SLU
5 (5)
Protect against whipsaws: revolutionize your swing trading approach Swing Trading is the first indicator designed to detect swings in the direction of the trend and possible reversal swings. It uses the baseline swing trading approach, widely described in trading literature. The indicator studies several price and time vectors to track the aggregate trend direction and detects situations in which the market is oversold or overbought and ready to correct. [ Installation Guide | Update Guide | Tro
무료 AUX 인디케이터와 EA 지원을 받으세요 직접 다운로드 — 여기를 클릭 [ D.I.C.E ] The DICE Indicator  Divergence in Chaos Environment는 엘리엇 파동 이론과 트레이딩 카오스 기법을 함께 사용하는 트레이더를 위해 설계된 MT5 전문 도구입니다. 가격 움직임의 숨겨진 및 일반 다이버전스를 감지하며, 빌 윌리엄스가 설명한 혼돈 시장 환경과 동기화됩니다. 주요 특징 엘리엇 파동 정렬 다이버전스: 파동 구조에 조화된 강세 및 약세 다이버전스를 탐지하여 파동 카운팅 정확도를 높입니다. 카오스 기법 통합: AO(오썸 오실레이터) 및 시장 구조 원칙과 일치하도록 설계되었습니다. 다중 타임프레임 스캐닝: 다양한 시간 프레임에서 다이버전스를 분석하여 모멘텀 변화와 추세 소진을 확인합니다. 시각적 알림 및 객체: 명확한 화살표, 선, 표시로 빠른 인식 가능. 적응형 시장 판독: 혼돈 시장 조건에 자동으로 조정되어 노이즈를 필터링하고 유효한 셋업만
ARICoins
Temirlan Kdyrkhan
ARICoin is a powerful trading companion designed to generate high-probability entry signals with dynamic TP/SL/DP levels based on volatility. Built-in performance tracking shows win/loss stats, PP1/PP2 hits, and success rates all updated live. Key Features: Buy/Sell signals with adaptive volatility bands Real-time TP/SL/DP levels based on ATR Built-in MA Filter with optional ATR/StdDev volatility Performance stats panel (Success, Profit/Loss, PP1/PP2) Alerts via popup, sound, push, or email Cust
Trend Forecaster
Alexey Minkov
5 (7)
The Trend Forecaster indicator utilizes a unique proprietary algorithm to determine entry points for a breakout trading strategy. The indicator identifies price clusters, analyzes price movement near levels, and provides a signal when the price breaks through a level. The Trend Forecaster indicator is suitable for all financial assets, including currencies (Forex), metals, stocks, indices, and cryptocurrencies. You can also adjust the indicator to work on any time frames, although it is recommen
ARIScalping
Temirlan Kdyrkhan
ARIScalp is a powerful trading companion designed to generate high-probability entry signals with dynamic TP/SL/DP levels based on volatility. Built-in performance tracking shows win/loss stats, PP1/PP2 hits, and success rates all updated live. Key Features: Buy/Sell signals with adaptive volatility bands Real-time TP/SL/DP levels based on ATR Built-in MA Filter with optional ATR/StdDev volatility Performance stats panel (Success, Profit/Loss, PP1/PP2) Alerts via popup, sound, push, or email Cus
Smart Stop Indicator – 차트 위에서 직접 작동하는 지능형 스톱로스 시스템 개요 Smart Stop Indicator는 감이나 추측이 아닌 명확하고 체계적인 방식으로 스톱로스를 설정하고 싶은 트레이더를 위한 맞춤형 솔루션입니다. 이 도구는 클래식 프라이스 액션 논리(고점, 저점 구조)와 현대적인 브레이크아웃 인식을 결합하여 실제로 가장 논리적인 다음 스톱 레벨을 정확히 식별합니다. 추세, 박스권, 빠른 브레이크아웃 상황 등 어떤 시장에서도 인디케이터는 최적의 SL 구역과 상태(“new”, “broken”, “valid”)를 차트에 직접 표시합니다. 새로운 기능으로 SL 거리의 %ADR 표시가 추가되었습니다. 핵심 기능 자동 시장구조 기반 스톱 설정 • 시장 구조와 실시간 가격 움직임을 기반으로 의미 있는 스톱로스 레벨을 자동으로 탐지합니다. 스마트 브레이크아웃 감지 • 빠른 방향 변화나 돌파 상황에서도 불필요한 조기 스톱 조정을 강요하지 않으며 유연하게 반응합
Trend indicator AI mt5
Ramil Minniakhmetov
5 (13)
트렌드 인공 지능 지표는 실행 가능한 진입 점 및 반전 경고와 추세 식별을 결합하여 상인의 시장 분석을 향상시킬 훌륭한 도구입니다. 이 표시기는 사용자가 자신감과 정밀도로 외환 시장의 복잡성을 탐색 할 수 있도록 지원합니다 기본 신호 외에도 트렌드 인공 지능 지표는 풀백 또는 되돌림 중에 발생하는 2 차 진입 점을 식별하여 거래자가 기존 트렌드 내에서 가격 수정을 활용할 수 있도록합니다. 중요한 장점: ·작동 4 및 5 *명확한 구매 또는 판매 신호 *다시 칠하지 않습니다 *모든 자산에서 작동 나는 전보 사기에 개 또는 세트를 판매하지 않도록주의. 모든 설정은 블로그에 여기에 무료.  중요! 지침 및 보너스를 얻기 위해 구입 후 즉시 저에게 연락! 진짜 가동 감시는 뿐 아니라 나의 다른 제품 여기에서 찾아낼 수 있습니다: https://www.mql5.com/en/users/mechanic/seller&nbsp ; 설정 및 입력: 모든 자산에 대해 기본 설정을 권
AriX
Temirlan Kdyrkhan
1 (4)
AriX Indicator for MT5 A powerful trend-following and signal-evaluation tool AriX is a custom MT5 indicator that combines Moving Averages and ATR-based risk/reward logic to generate clear buy/sell signals. It visualizes dynamic SL/TP levels, evaluates past trade outcomes, and displays win/loss statistics in a clean on-chart panel. Key features include: Buy/Sell signals based on MA crossovers ATR-based SL/TP1/TP2/TP3 levels with visual lines and labels Signal outcome tracking with real-time stat
Quantum TrendPulse
Bogdan Ion Puscasu
5 (20)
SuperTrend   ,   RSI   ,   Stochastic   의 힘을 하나의 포괄적인 지표로 결합하여 트레이딩 잠재력을 극대화하는 궁극의 트레이딩 도구   인 Quantum TrendPulse를   소개합니다. 정밀성과 효율성을 추구하는 트레이더를 위해 설계된 이 지표는 시장 추세, 모멘텀 변화, 최적의 진입 및 종료 지점을 자신 있게 식별하는 데 도움이 됩니다. 주요 특징: SuperTrend 통합:   주요 시장 추세를 쉽게 따라가고 수익성의 물결을 타세요. RSI 정밀도:   매수 과다 및 매도 과다 수준을 감지하여 시장 반전 시점을 파악하는 데 적합하며 SuperTrend 필터로 사용 가능 확률적 정확도:   변동성이 큰 시장에서 숨겨진 기회를 찾기 위해 확률적 진동   을 활용하고 SuperTrend의 필터로 사용 다중 시간대 분석:   M5부터 H1 또는 H4까지 다양한 시간대에 걸쳐 시장을 최신 상태로 유지하세요. 맞춤형 알림:   맞춤형 거래 조건이 충족되면
MetaForecast M5
Vahidreza Heidar Gholami
5 (3)
MetaForecast는 가격 데이터의 조화를 기반으로 모든 시장의 미래를 예측하고 시각화합니다. 시장이 항상 예측 가능한 것은 아니지만 가격에 패턴이 있다면 MetaForecast는 가능한 정확하게 미래를 예측할 수 있습니다. 다른 유사한 제품과 비교했을 때, MetaForecast는 시장 동향을 분석하여 더 정확한 결과를 생성할 수 있습니다. 입력 매개변수 Past size (과거 크기) MetaForecast가 미래 예측을 생성하기 위한 모델을 만드는 데 사용하는 막대의 수를 지정합니다. 모델은 선택한 막대 위에 그려진 노란색 선으로 표시됩니다. Future size (미래 크기) 예측해야 할 미래 막대의 수를 지정합니다. 예측된 미래는 핑크색 선으로 표시되며 그 위에 파란색 회귀선이 그려집니다. Degree (차수) 이 입력은 MetaForecast가 시장에서 수행할 분석 수준을 결정합니다. Degree 설명  0 차수 0의 경우, "Past size" 입력에 모든 봉우리와
물론입니다. 아래는 제공해주신 텍스트의 한국어 번역입니다: MT4용 천문학 지표 소개: 귀하의 최상급 하늘 트레이딩 동반자 트레이딩 경험을 천체의 높이로 끌어올리기 준비가 되셨나요? MT4용 천문학 지표를 소개합니다. 이 혁신적인 도구는 복잡한 알고리즘의 힘을 활용하여 탁월한 천문학적 통찰과 정밀한 계산을 제공합니다. 정보의 우주를 손에 담다:   천문학적 데이터의 보물함을 드러내는 포괄적인 패널을 살펴보세요. 행성의 지오/헬리오센트릭 좌표, 태양/지구 거리, 크기, 길이, 별자리, 황도 좌표 및 적도 좌표, 심지어 수평 좌표 등 각각이 정밀하게 계산되고 아름답게 제시됩니다. 지표에 의해 생성된 수직선은 시간 값에 해당하여 트레이딩 여정에 우주적인 시각을 부여합니다. 행성 라인과 관계:   수정 가능한 스케일과 각도로 차트를 장식하는 행성 라인의 마법을 경험해보세요. 직관적인 컨트롤 패널을 통해 각 행성의 라인의 가시성을 손쉽게 전환할 수 있습니다. 쥰션이나 섹스타일, 사분각, 삼분
FX Levels MT5
Daniel Stein
5 (12)
FX Levels: 모든 시장을 위한 뛰어난 정확도의 지지와 저항 간단 요약 통화쌍, 지수, 주식, 원자재 등 어떤 시장이든 믿을 만한 지지·저항 레벨을 찾고 싶나요? FX Levels 는 전통적인 “Lighthouse” 기법과 첨단 동적 접근을 결합해, 거의 보편적인 정확성을 제공합니다. 실제 브로커 경험을 반영하고, 자동화된 일별 업데이트와 실시간 업데이트를 결합함으로써 FX Levels 는 가격 반전 포인트를 파악하고, 수익 목표를 설정하며, 자신 있게 트레이드를 관리할 수 있게 돕습니다. 지금 바로 시도해 보세요—정교한 지지/저항 분석이 어떻게 여러분의 트레이딩을 한 단계 끌어올릴 수 있는지 직접 확인하세요! 1. FX Levels가 트레이더에게 매우 유용한 이유 뛰어난 정확도의 지지·저항 존 • FX Levels 는 다양한 브로커 환경에서도 거의 동일한 존을 생성하도록 설계되어, 데이터 피드나 시간 설정 차이로 인한 불일치를 해소합니다. • 즉, 어떤 브로커를 사용하
Gold Sniper Scalper Pro
Ich Khiem Nguyen
3.5 (8)
Gold Sniper Scalper Pro는 MetaTrader 5용 전문 지표로, 트레이더가 진입 지점을 식별하고 리스크를 효과적으로 관리할 수 있도록 지원하기 위해 설계되었습니다. 이 지표는 시그널 감지 시스템, 자동 Entry/SL/TP 관리, 거래량 분석 및 실시간 성과 통계를 포함하는 포괄적인 분석 도구 세트를 제공합니다. 시스템 이해를 위한 사용자 가이드   |   기타 언어 사용자 가이드 주요 기능 시그널 감지 시스템 지표는 Price Action 분석 및 시장 구조를 기반으로 잠재적 진입 지점을 자동으로 감지합니다. 거래 기회 감지 시: - BUY 화살표(녹색) 또는 SELL 화살표(빨간색)가 차트에 표시됩니다 - 캔들이 색상으로 표시되어 시그널 영역을 식별합니다 - Entry/SL/TP 레벨이 자동으로 계산됩니다 시그널은 가격이 Entry 레벨에 도달할 때만 활성화되어, 시장에서 확인되지 않은 시그널을 필터링합니다. 지능형 Entry/SL/TP 관리 - Ent
TPSproTREND PrO MT5
Roman Podpora
4.74 (19)
TPSproTrend PRO는 시장이 실제로 방향을 바꾸는 순간을 포착하여 움직임의 시작점에서 진입점을 형성합니다. 가격이 움직이기 시작할 때 시장에 진입해야 하며, 이미 가격 변동이 일어난 후에 진입해서는 안 됩니다.   (지표)       신호를 다시 그리지 않고 진입점, 손절매, 이익실현을 자동으로 표시하여 거래를 명확하고 시각적이며 체계적으로 만들어줍니다. 설명서 (러시아어)   -   MT4 버전 주요 장점 신호 재표시 없이 신호가 표시됩니다.   모든 신호는 고정되어 있습니다. 화살표가 나타나면 -       그것은 더 이상 변하거나 사라지지 않을 것입니다. 잘못된 신호의 위험 없이 안정적인 데이터를 기반으로 거래 결정을 내릴 수 있습니다. 바로 사용 가능한 매수/매도 진입점 이 지표는 거래 진입에 가장 적합한 시점을 자동으로 판단하여 차트에 화살표로 표시합니다. 추측이나 주관적인 분석이 아닌, 명확한 신호만 있습니다. 자동 손절매 및 이익실현 영역 신호 직후에 다음
Advanced Supply Demand MT5
Bernhard Schweigert
4.5 (14)
현재 33% 할인! 초보자나 전문 트레이더를 위한 최고의 솔루션! 이 보조지표는 우리가 다수의 독창적 기능과 새로운 공식을 통합한 독특하고 고품질이며 저렴한 거래 도구입니다. 이 업데이트를 통해 이중 시간대를 표시할 수 있습니다. 더 높은 TF를 표시할 수 있을 뿐만 아니라 차트 TF와 더 높은 TF 모두를 표시할 수 있습니다: 중첩 영역 표시. 모든 Supply Demand 트레이더들이 좋아할 것입니다. :) 중요한 정보 공개 Advanced Supply Demand의 잠재력을 극대화하려면 다음을 방문하십시오. https://www.mql5.com/ko/blogs/post/720245   진입 또는 목표의 명확한 트리거 포인트를 정확히 찾아냄으로 해서 거래가 어떻게 개선될지 상상해 보십시오. 새로운 알고리즘을 기반으로 매수자와 매도자 간의 잠재적인 불균형을 훨씬 더 쉽게 분간할 수 있습니다. 왜냐하면 가장 강한 공급영역과 가장 강한 수요 영역과 과거에 어떻게 진행 되었는지를(이전
Trade smarter, not harder: Empower your trading with Harmonacci Patterns This is arguably the most complete harmonic price formation auto-recognition indicator you can find for the MetaTrader Platform. It detects 19 different patterns, takes fibonacci projections as seriously as you do, displays the Potential Reversal Zone (PRZ) and finds suitable stop-loss and take-profit levels. [ Installation Guide | Update Guide | Troubleshooting | FAQ | All Products ] It detects 19 different harmonic pri
Grabber System MT5
Ihor Otkydach
4.81 (21)
탁월한 기술적 지표인 Grabber를 소개합니다. 이 도구는 즉시 사용 가능한 “올인원(All-Inclusive)” 트레이딩 전략으로 작동합니다. 하나의 코드 안에 강력한 시장 기술 분석 도구, 매매 신호(화살표), 알림 기능, 푸시 알림이 통합되어 있습니다. 이 인디케이터를 구매하신 모든 분들께는 다음의 항목이 무료로 제공됩니다: Grabber 유틸리티: 오픈 포지션을 자동으로 관리하는 도구 단계별 영상 매뉴얼: 설치, 설정, 그리고 실제 거래 방법을 안내 맞춤형 세트 파일: 인디케이터를 빠르게 자동 설정하여 최고의 성과를 낼 수 있도록 도와줍니다 다른 전략은 이제 잊어버리세요! Grabber만이 여러분을 새로운 트레이딩의 정점으로 이끌어 줄 수 있습니다. Grabber 전략의 주요 특징: 거래 시간 프레임: M5부터 H4까지 거래 가능한 자산: 어떤 자산이든 사용 가능하지만, 제가 직접 테스트한 종목들을 추천드립니다 (GBPUSD, GBPCAD, GBPCHF, AUDCAD, AU
Golden Spike Premium
Kwaku Bondzie Ghartey
5 (1)
Golden Spikes Indicator Technical indicator for synthetic indices trading on M1 timeframe. Compatible with Boom/Crash indices on Deriv platform and Gain/Pain indices on Weltrade platform. send me A private  message to receive trade ASISTANT EA.. booklet guide:  https://drive.google.com/file/d/1knQJqGHZSP5eQN24ndRz2ayZVCst6XhN/view?usp=sharing Also check my premium spikes bot: https://www.mql5.com/en/market/product/142350 Features Uses Parabolic SAR, RSI, and Bollinger Bands analysis Three risk
제작자의 제품 더 보기
ExtremeTMALine
Vasilii Luchnikov
4.83 (6)
속도를 위해 약간 변경되었습니다. 테스터는 이메일로 나에게 쓰기,관심이 새로운 고문이 필요합니다 777basil@mail.ru https://backoffice.aurum.foundation/u/DHXP1U 표시기는 역사의 가격 변화를 기반으로 계산되며 수학적으로 계산되며 데이터가 다시 수신 될 때마다 다시 계산됩니다. 그것은 다른 시간대에 사용할 수 있습니다. 70%의 지표의 경계에서 가격 이동 또는 통합 방향의 변화가 있습니다. 이 방법으로,당신은 추세와 국경에서 채널의 중간에 보트를 거래 할 수 있습니다. 저항/지원 수준을 결정하기 위해 추세 거래에서 사용하는 것이 좋습니다. 비디오에서 표시기가 어떻게 작동하는지 확인할 수 있습니다: https://youtu.be/UG2ZZEH9B_U 통신 연락처 777basil@mail.ru 우리는 당신의 작업에 대한 지표 인 전문가를 준비 할 것입니다.
FREE
VolumeSpreadtompson
Vasilii Luchnikov
NewTest https://backoffice.aurum.foundation/u/DHXP1U hello. The indicator shows the levels of change in the spread per unit of time when its values are higher. Practice shows that the change in volumes is associated with the warning and advance of speculative activity, especially at key moments: Fed news, oil news, speeches by leaders of the IDR countries.   We are very happy to present new developments. Thanks. 
FREE
SynchroWindowTomson
Vasilii Luchnikov
Привет. Сегодня представляем индикатор корреляции -  SynchroWindowTomson. Индикатор в одном окне показывает движение нескольких инструментов, по отношению друг к другу, удобно определять направление и изменение, особенно когда вы работаете с целым портфелем разных инструментов и нужно определить какой из них тянет результат назад и движется в другую сторону. Так же видны точки разворота спреда.
FREE
Mtrx2tompson
Vasilii Luchnikov
NewTest https://backoffice.aurum.foundation/u/DHXP1U The indicator is based on indicators built-in standard indicators, the indicator take into account the current indicators 30 indicators and give a signal to buy or sell, the General trend of all trends of other indicators. In the input parameters, you can configure special parameters for each indicator. the indicator is executed in the form of an oscillator and shows the General trend and the preponderance of all indicators in one or the othe
FREE
DuettoFXTompson
Vasilii Luchnikov
NewTest https://backoffice.aurum.foundation/u/DHXP1U The DuettoFXTompson indicator is designed to work with two instruments that have a high level of correlation. the indicator can be used for pair trading on currencies, stocks, and other financial instruments. The indicator shows the moment when the instruments diverge and the sum of the two instruments (yellow line). additionally, the parameter of the Average MA value is calculated. Recommended timeframe for M5 operation. Contacts for commun
FREE
MaxlotTomson
Vasilii Luchnikov
5 (2)
NewTest https://backoffice.aurum.foundation/u/DHXP1U Good afternoon. Today we offer the maxlottomson indicator to determine the maximum volume that you can put up for purchase or sale, if you look at your deposit level. This indicator is convenient to use for News trading, when you need to determine the entry point on a high-speed movement and calculate the risk level as a percentage of the deposit, the maxlottomson indicator shows the maximum value of the LOT volume for your deposit that you
FREE
DveMashkiTompson
Vasilii Luchnikov
Добрый день. Сегодня добавили вспомогательный индикатор тренда DveMashkiTompson, идея взята из аналога МТ4 и перенесена на МТ5, используется совместно с индикаторами Тренда ТМА и МА, рисует красные и зеленые области в зависимости от направления рынка. Тренд вверх -зеленые области, тренд вниз -красные.Области основываются на пересечении индикатора МА, таким образом данный индикатор дает информацию графического содержания для более быстрой оценки ситуации и принятия решения.
FREE
NewTest https://backoffice.aurum.foundation/u/DHXP1U Hi. PortfolioHedgingStopOrderOneSymbol-trend EA for opening orders from mid-channel on the third wave Elliot, is working on the breakdown of the level from a custom indicator TMA channel width with fixed S / L and T / P. this EA is designed to determine the best entry point into the market after the correction. if you have confirmation of a strong trend movement, but if you are a novice and still doubt the correctness of your actions, it is
NewTest https://backoffice.aurum.foundation/u/DHXP1U Hello. CatchCandleLimitOrderOneSymbol-flat expert Advisor, for opening orders from the channel borders to the center, works on pullbacks from the support and resistance levels, from the custom channel width indicator TMA, with a fixed S/L and T / P. The EA is designed to trade off the levels when a particular trend movement, and is no doubt the continuation of the trend, the Levels are shifted automatically with the price based on the channe
VolumeTick
Vasilii Luchnikov
Indicator VolumeTick https://youtu.be/tmHZKdMCMGo made for rapid identification of possible reversal points, when the conditions of consolidation and bi-directional trading traders, the number of volumes in the market increases sharply, which shows the interest of the participants to change the direction of movement of the tool market and counts the number of ticks on each bar, made in the form of an oscillator. This way we can foresee stopping trading or trading in the other direction, or add
https://backoffice.aurum.foundation/u/DHXP1U NewTest https://youtu.be/Ze9zPpYtIrI GridCatchCandleLimitOrderOneSymbol is a Grid flat expert Advisor for opening orders from the channel borders to the center. it works on pullbacks from the support and resistance levels, from the custom TMA channel width indicator, with fixed S/L and T / P. The EA is designed to trade off the levels when a particular trend movement, and is no doubt the continuation of the trend, the Levels are shifted automatical
The CatchPositionByStopOrder trading expert is designed to work on a trending market when the direction of trading is known, you can trade both SELLSTOP and BUYSTOP orders, and you can trust the expert himself to choose the direction. Sets pending STOP orders and moves them behind the price to determine the most effective entry point. The recommended timeframe for trading is M5/M15/H1. In the expert Advisor, you can work with fixed S/l and T/p, as well as with the help of a trawl. if T / p=0, t
PointIntoChannel
Vasilii Luchnikov
Good afternoon. Today we present a new indicator PointIntoChannelTOMSON https://youtu.be/dmgtVwX3nvg https://youtu.be/Wr7N2WEY8lA -this indicator is calculated from the channel to the level of price deviation in the direction of buying and selling, the green and red window of indicators, respectively. The higher the deviation level, the greater the probability of a reversal. The indicator readings are recalculated with each new bar and it is recommended to use it only as an auxiliary one Con
UturnAnalysis
Vasilii Luchnikov
Good afternoon.   UturnAnalysis - to check the quality of the indicator WE HAVE LAUNCHED A TRIAL VERSION free distribution of signals about reversals based on this indicator for the futures and stock markets of the MICEX write to tech support, me 777basil@mail.ru , or in the comments your email address and we will send you the account details where the alerts are sent, for free. https://youtu.be/q228LvLec-Y we put it on several tools at once https://youtu.be/Wr7N2WEY8lA will save you time at
필터:
Slon77
14
Slon77 2022.07.01 18:01 
 

Спасибо большое! Не могу найти аналогичный для MT4 (вроде в описании упомянут). Не поможете?

Olayinka Olayemi
559
Olayinka Olayemi 2022.01.08 12:10 
 

The indicator works very great, but after some bars updated then it stops and doesn’t update bars until it is refresh, and could this be fix also is there a version for MT4

Aleksandr Tamonin
4109
Aleksandr Tamonin 2021.01.23 19:21 
 

사용자가 평가에 대한 코멘트를 남기지 않았습니다

Vasilii Luchnikov
7997
개발자의 답변 Vasilii Luchnikov 2021.06.27 15:06
Добавили Видео стратегии с данным индикатором, можно посмотреть здесь. https://youtu.be/kgbIgnujuAM
리뷰 답변