Advanced Order Block Breaker
- 지표
- 버전: 1.3
- 업데이트됨: 19 12월 2020
- 활성화: 10

Advanced Order Block Breaker
The price has been reduced from 65$ discount to 35$!!!
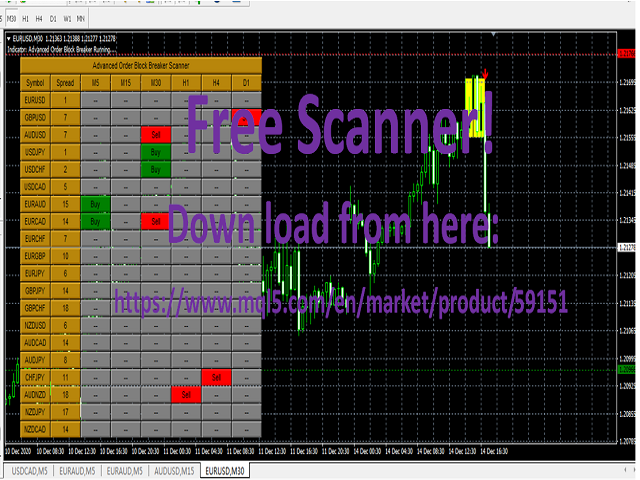
- Dashboard: Free scanner to monitor All pairs and timeframes here: https://www.mql5.com/en/market/product/59151
- MT5 version Indicator: https://www.mql5.com/en/market/product/62769
Market structure changes as price reverses And filter with all import features built inside one tool.
Breaker's smart algorithm detects the reverses, filters out market noise and gives entry signals with exit levels.
Test the demo version and explore its features, it would be useful tool added to your trading arsenal.
Advantages You Get
Easy, visual and effective reverses detection.
Gives you the ability to improve your trading strategies.
Give you the entry point, take profit and exit signal.
Never repaints, never backpaints, never recalculates.
Signals strictly on the "Close of the bar".
Works in all symbols and all timeframes.
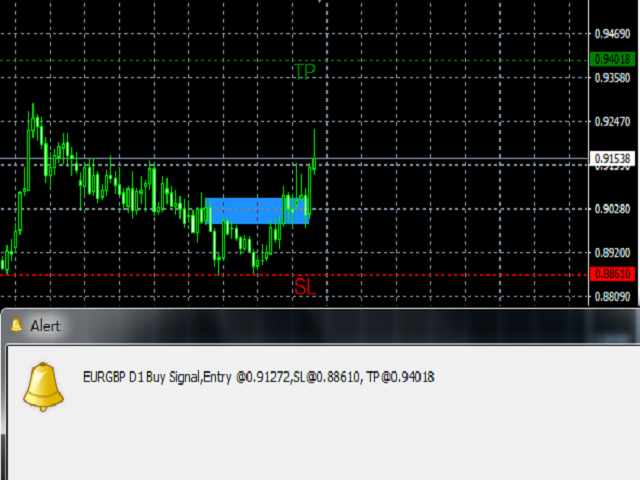
Integrated email, push notification and sound alerts.
Fully compatible with Expert Advisor (EA) development.
How To Trade
No complicated rules, Just follow below simple steps!
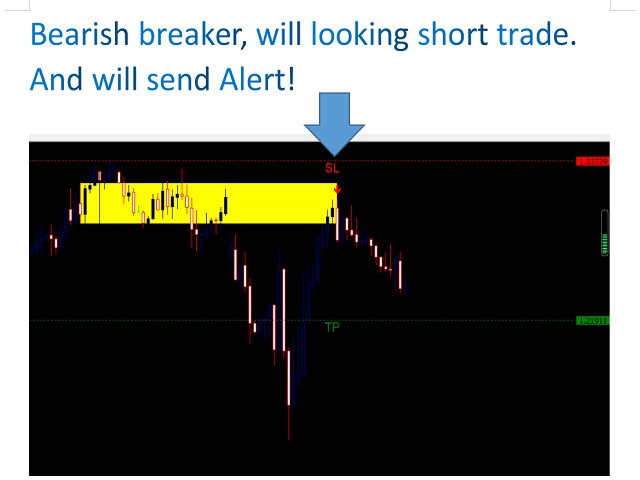
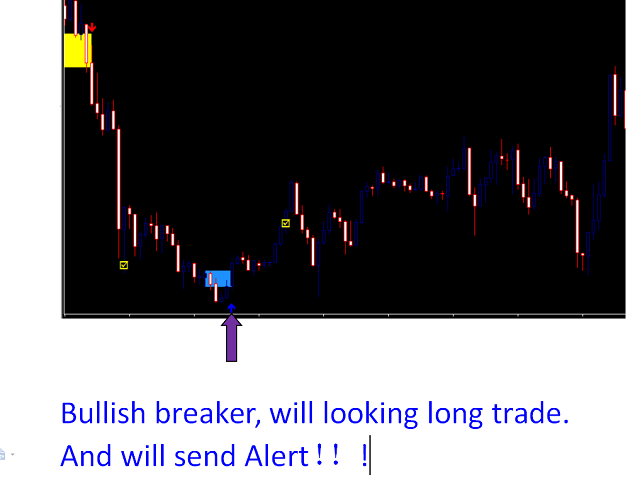
- Entry Trade: When Blue Arrow Appear, Buy Signal, when Red Arrow Appear, Sell Signal.
- Set Stop Loss: Just above the most recent high or below the most recent low.
- Set Take Profit: Is up to the individual but using a 1:1 or 2:1 risk to reward is easily achievable.
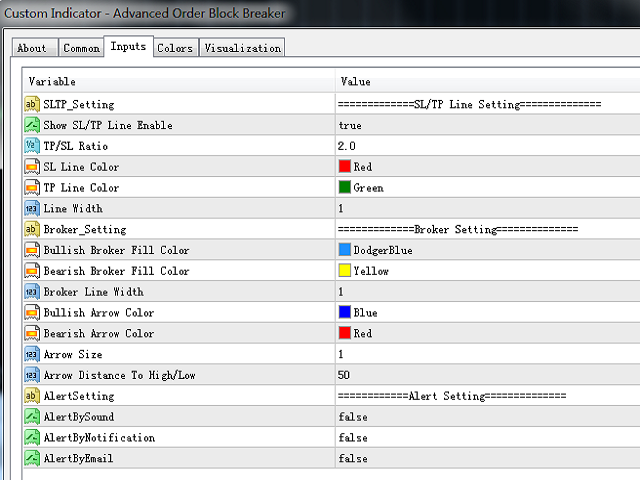
Parameters
- SLTP_Setting - Parameter description
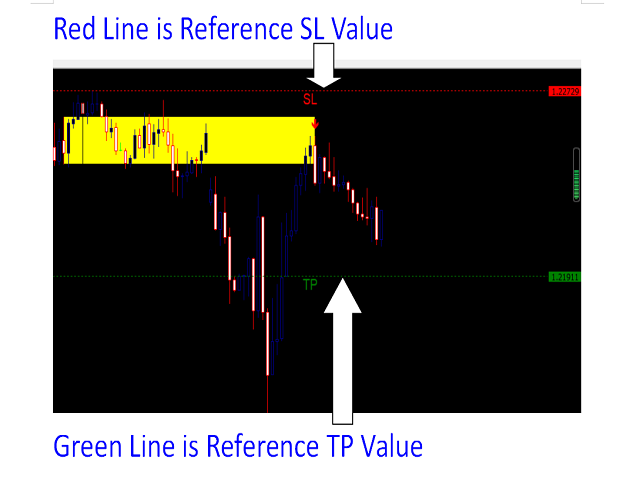
- Show SL/TP Line Enable - Show SL and TP line
- TP/SL Ratio - TP Risk
- SL Line Color - SL Line Color
- TP Line Color - TP Line Color
- Line Width - SL And TP Line Width
- Broker_Setting - Parameter description
- Bullish Broker Fill Color - Bullish Broker Fill Color
- Bearish Broker Fill Color - Bullish Broker Fill Color
- Broker Line Width - Broker Line Width
- Bullish Arrow Color - Bullish Arrow Color
- Bearish Arrow Color - Bearish Arrow Color
- Arrow Size - Arrow Size
- Arrow Distance To High/Low - Arrow Distance To High Or Low
- AlertSetting - Parameter description
- AlertBySound - Alert By Sound: true/false
- Alert By Notification - Alert By Sound: true/false
- Alert By Email - Alert By Sound: true/false
Tip: This is an indicator for real-time signal display. When the indicator is loaded and running on the chart, the past signal cannot be displayed


Very very good!!!!