Automatic fibonacci with alerts
- 지표
- 버전: 1.10
- 업데이트됨: 17 6월 2021

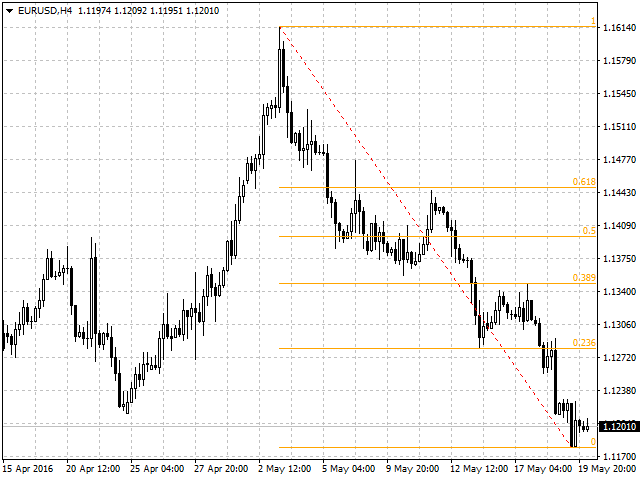
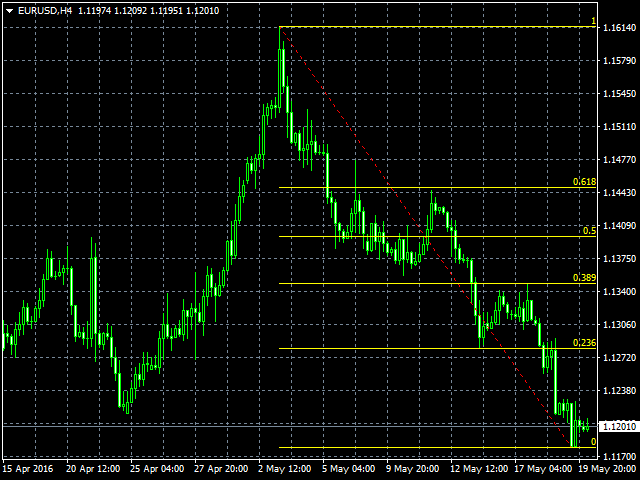
Automatic fibonacci with alerts is an indicator that automatically plots a fibonacci retracement based on the number of bars you select on the BarsToScan setting in the indicator. The fibonacci is automatically updated in real time as new highest and lowest values appear amongst the selected bars. You can select which level values to be displayed in the indicator settings. You can also select the color of the levels thus enabling the trader to be able to attach the indicator several times with different settings and colors. The settings are explained below:
- BarsToScan - Set number of bars for the indicator to check for values
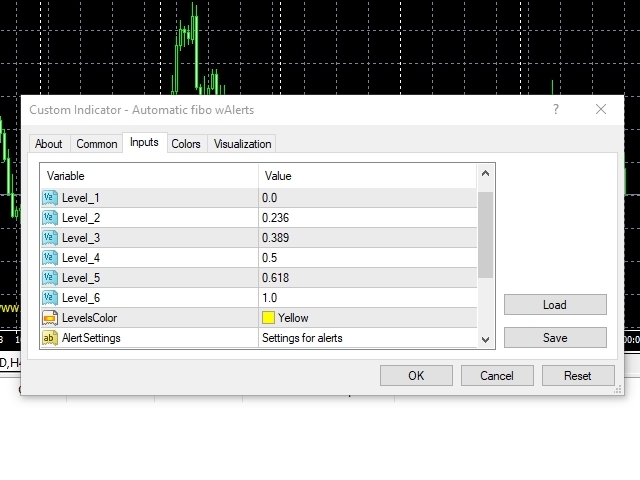
- Level_1 - First level of the fibonacci
- Level_2 - Second level of the fibonacci
- Level_3 - Third level of the fibonacci
- Level_4 - Fourth level of the fibonacci
- Level_5 - Fifth level of the fibonacci
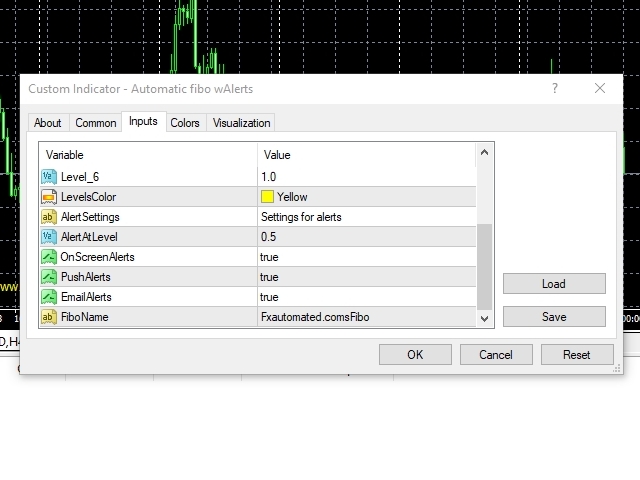
- Level_6 - Sixth level of the fibonacci
- LevelsColor - Setting to customise the color of the fibonacci levels
- AlertAtLevel - The level of which you will get alerts when the price crosses it
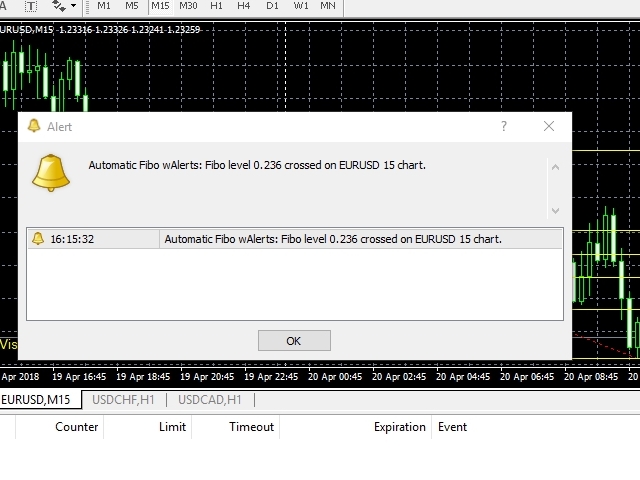
- OnScreenAlerts - If set to true then you will get alerts on your screen
- PushAlerts - Set true to get push alerts via your mt4 ID
- EmailAlerts - If true, alerts will be sent to your email
- FiboName - Setting for the name of the fibonacci. If you attach several times then each fibo should have a different name.
For push and email alerts, you ought to have your metaquotes ID and email settings entered in the notifications tab. For push notifications you should enter your metaquotes ID at Tools-> Options-> Notifications while email settings can be entered at Tools-> Options-> Email.
Hallo habe eben ihren Automatic Fibo MT4 gekauft. Leider wird der indikator nicht in der Datenbank gefunden. 29111 nicht in Datenbank gefunden. Wenn es kein Fehler von Ihnen ist, an wen muss ich mich wenden? Vielen Dank für ihre Unterstützung