Bars expiration for MT5
- 지표
-
Eugenio Bravetti
 Hi guys,
my name is Eugenio and I am a private trader and developer.
Since 2001 I development in various languages including:
MQL4 for MetaTrader 4
MQL4 for MetaTrader 5
Easy Language for Trade Station
PowerLanguage for Multicharts,
Easy Language for Trade Station 2000i, - 버전: 20.729
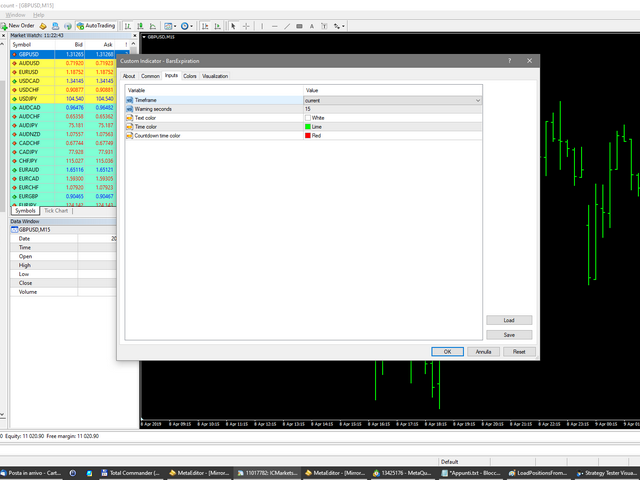
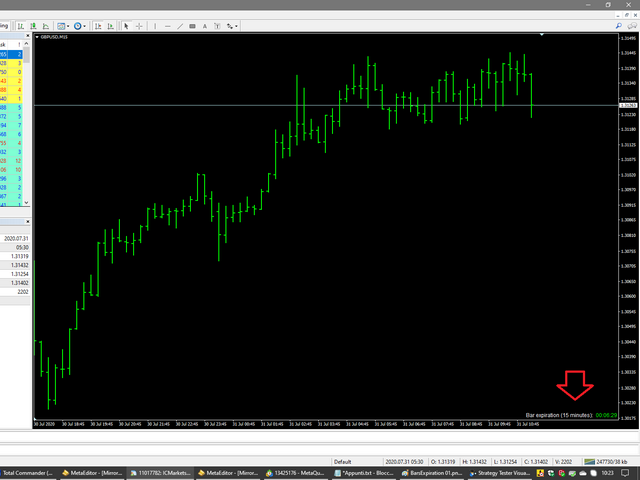
This indicator is an utility for have always under control, how much time is left at the end of the bar setted.
The utility show on the lower right of the chart, the countdown to the end.
When the remaining seconds is = to the seconds set in the input, the color of remaining seconds on chart, change color and play a warning sound to warn you that the bar is about the end.
When the remaining seconds is < to the seconds set in the input, the utility play a beep to warn you that the bar is in countdown mode.
When the new bar start, the utility play a newbar sound.
You can apply this utility on chart together with other indicators.
Good