Currency Strength Meter Pro for EA MT5
- 지표
-
ALEKSANDR SHUKALOVICH
 💎 HELPFUL INFORMATION 💎
=================================================================================================================================================
🛑Personal Email: n0mad@xakep.ru 👈 - 버전: 4.20
- 업데이트됨: 7 1월 2026
- 활성화: 8
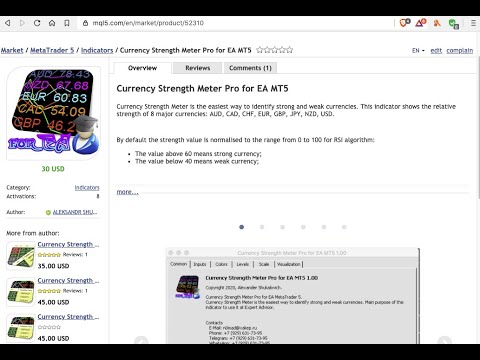
Currency Strength Meter is the easiest way to identify strong and weak currencies. The indicator shows the relative strength of 8 major currencies: AUD, CAD, CHF, EUR, GBP, JPY, NZD, USD.
By default the strength value is normalised to the range from 0 to 100 for RSI algorithm:
- The value above 60 means strong currency;
- The value below 40 means weak currency;
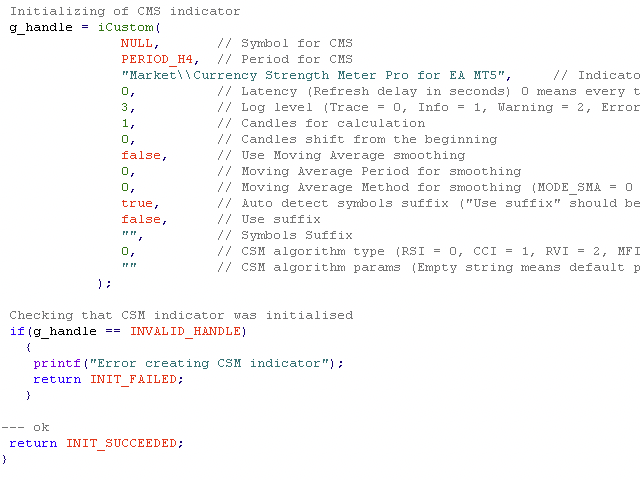
The indicator is created and optimized for using it externally at an Expert Advisors or as a Custom Indicator inside your programs.
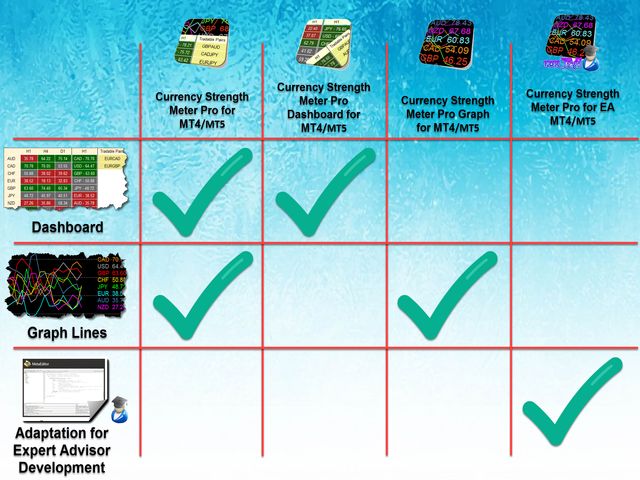
For direct usage as an indicator there are several special versions for it:
- Currency Strength Meter Pro for MT5
- Currency Strength Meter Pro Dashboard for MT5
- Currency Strength Meter Pro Graph for MT5
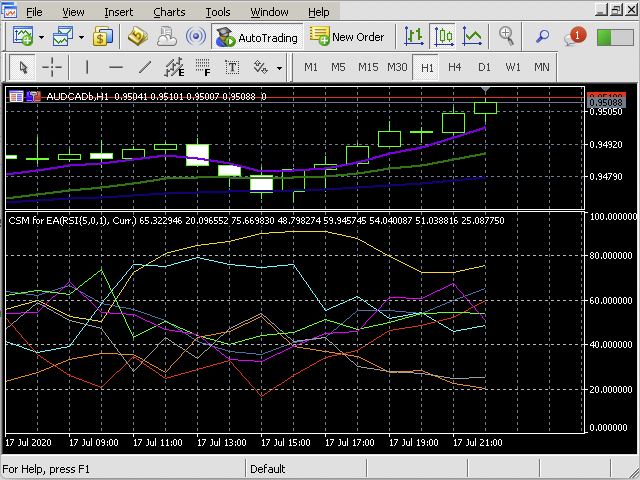
- Currency Strength Meter Graph (shows strength of currencies with graphic lines);
- Allows to calculate average currency strength from specified timeframes;
- Many algorithms for calculation of currencies strength (MACD, RSI, CCI, RVI, MFI, Stochastic, DeMarker, Momentum);
- Moving average smoothing (allowed to smooth result with specific algorithms);
- Latency (allowed to calculate currency strength with specified interval, thus it takes less time for calculation);
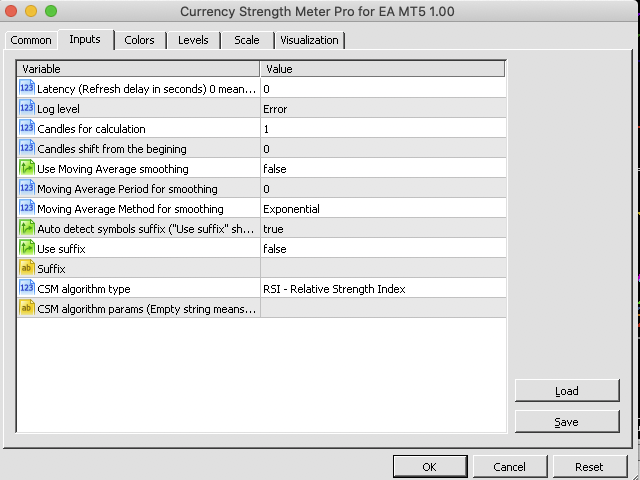
- And much more (see indicator's properties);
The indicator needs history data of all 28 major currency pairs and 9 timeframe. History data will be downloaded automatically as indicator will be started.
Relative links:
- Read this article to get more knowledge How to use Currency Strength Meter Pro to write your own Expert Advisor for MT5
Additional indicators for trend trading:
- Trend Power for MT5 - It helps to identify trend direction and its power by using moving averages ZigZag pattern and correlations of tradable instruments.
- MA Bounce Strategy for MT5 - It helps to identify and find place for potential market entry by MA bounce strategy.
- Chart State Saver for MT5 - It helps to save and manage states of all charts even if they would be closed.
- News Scalping Executor Pro Utility for MT4 - It helps to trade high impact and huge volatility news.
Communication:
- Join Take Profit Channel to get latest news and updates.
- Join Take Profit Group to discuss products of author.
- If you want new feature contact me please.