The Tangram Indicator
- 지표
- Naim El Hajj
- 버전: 1.20
- 업데이트됨: 22 4월 2020
- 활성화: 8
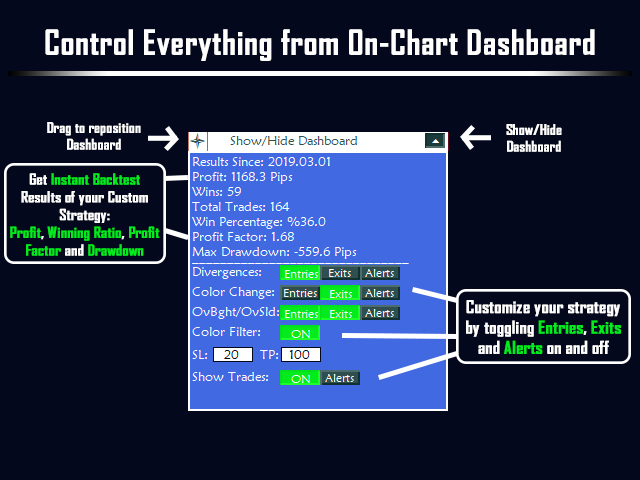
Customize Your Own Strategy and Get Instant Backtest Results
All Oscillators Data in a single indicator, displayed on the chart.
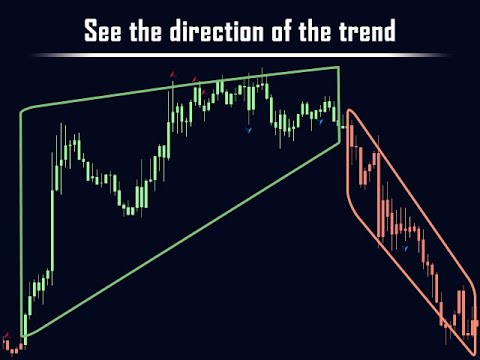
The Tangram indicator uses an amalgam of 7 different oscillators, then analyses when the price is in Overbought/Oversold territory, when there's a divergence, and when price is trending.
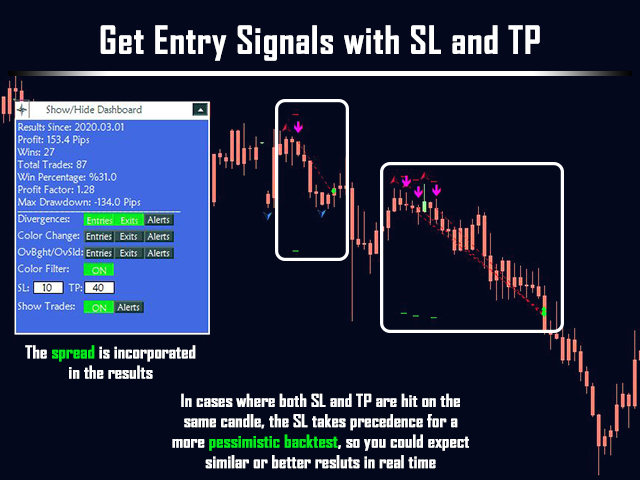
Besides being an indicator that helps you analyse the charts, Tangram also gives you the ability to get entry signals, based on your own strategy.
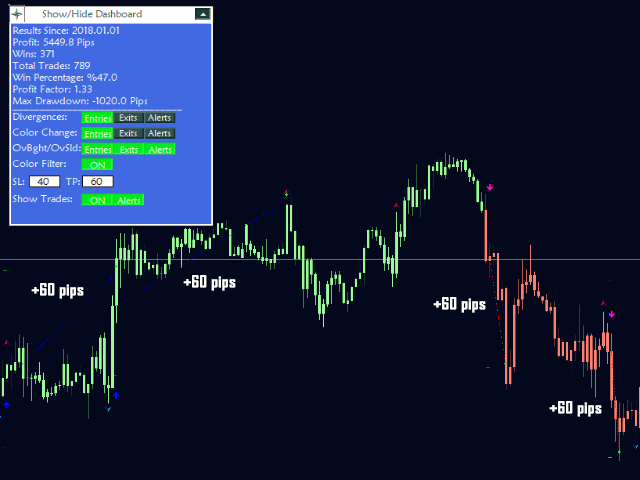
It also allows you to customize a strategy based on the indicator data and gives instant backtesting results of your strategy, and displays the report on the on-chart dashboard.
► Check the User's Manual here:
Key Features:
- Non-Repainting
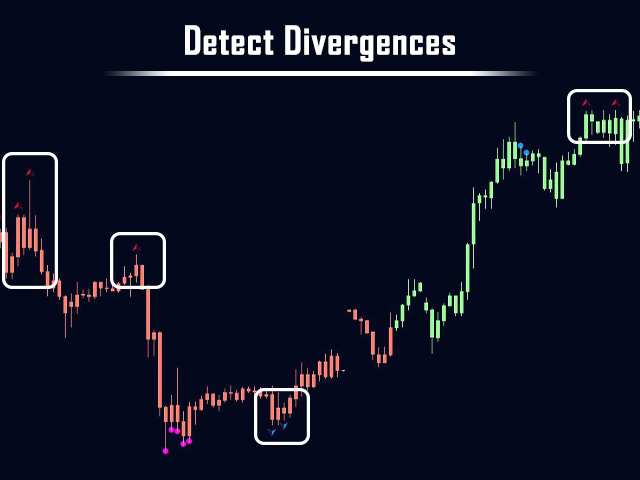
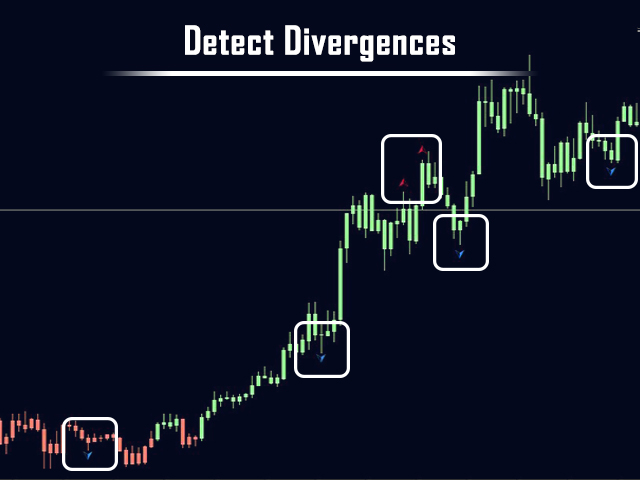
- Detects Divergences
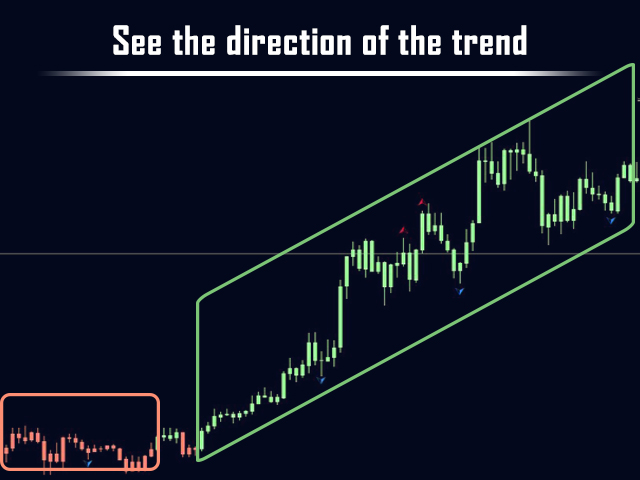
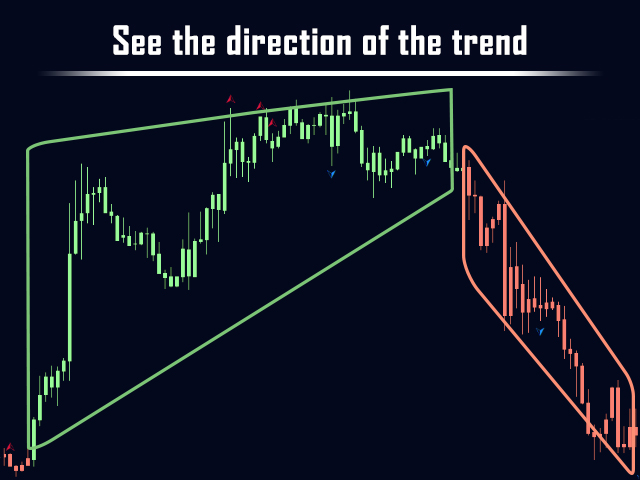
- Detects Trends
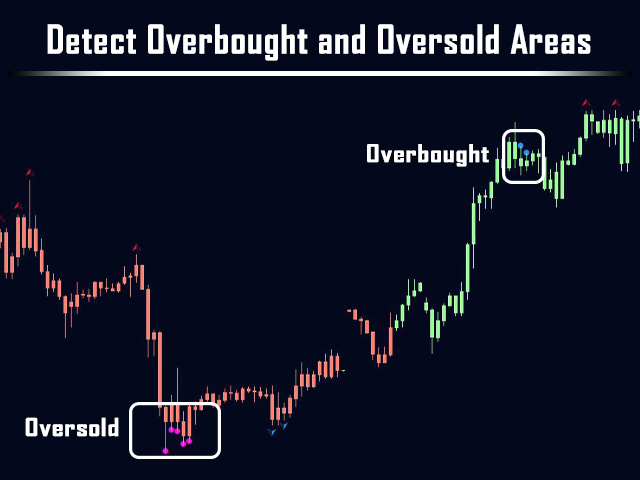
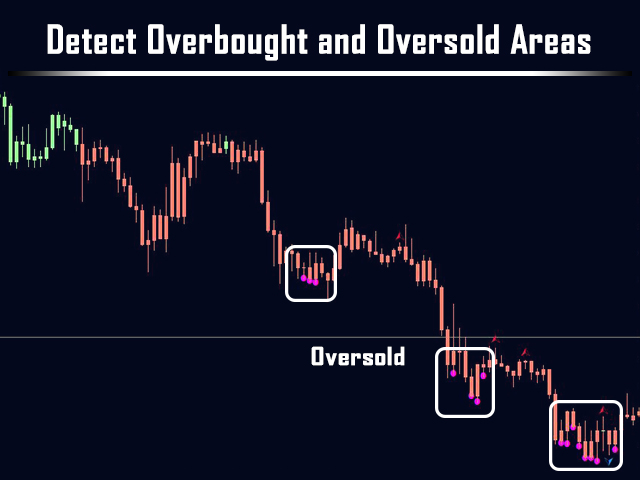
- Displays Overbought/Oversold areas
- Allows you to test different trading strategies
- Instantly displays the backtesting results of the strategy on dashboard
- Calculates different measures of the backtested strategy:
- Profit
- Wins
- Total Trades
- Winning Percentage
- Profit Factor
- Max Balance Drawdown
- Accounts for spread while backtesting the strategy
- Interactive dashboard that allows you to try different Entries and Exits
- Alerts on MT4, Email, Mobile
- Allows you to adjust Alert triggers
- Could easily use in a custom-built Expert Advisor.
►Write an honest review of the indicator
►and send me a proof of purchase to tangramindicator@gmail.com
►and get a free Tangram Optimizer that helps you find the best settings to use for each currency and timeframe


사용자가 평가에 대한 코멘트를 남기지 않았습니다