The Sextet
- 지표
- 버전: 1.0

Overview
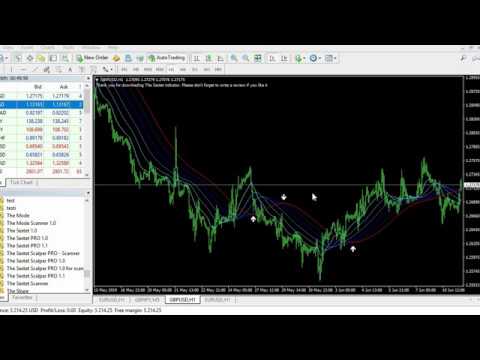
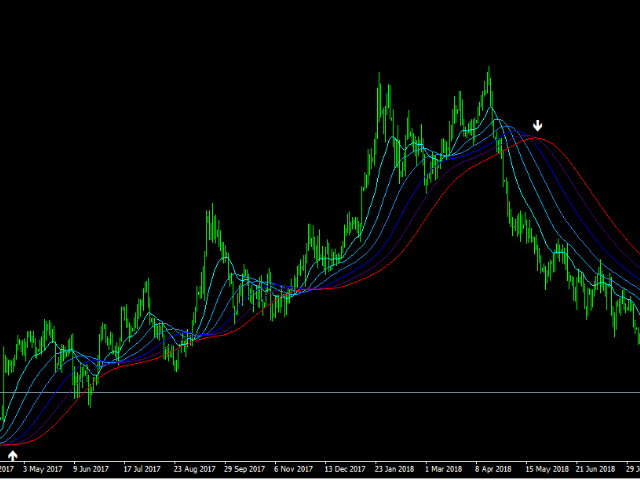
The Sextet is an MT4 trend-alignment indicator based on a sequence of six moving-average levels.
Each level is calculated from the previous one, creating a layered view of trend structure. The indicator marks conditions where the moving-average levels align in order, which can help traders observe trend direction and trend organization more clearly.
Key Features
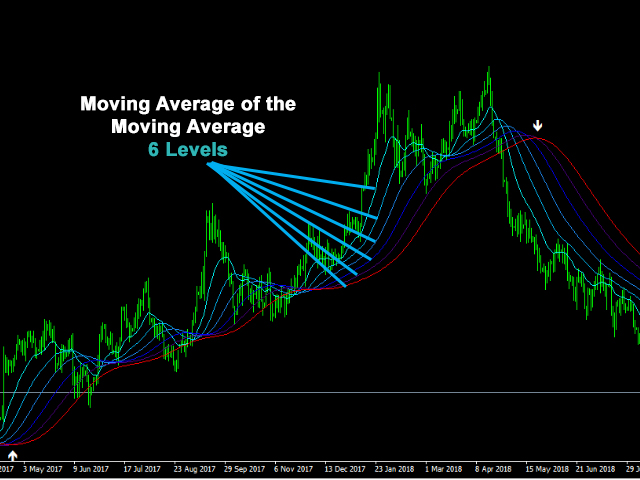
- Displays six moving-average levels.
- Uses a layered moving-average sequence.
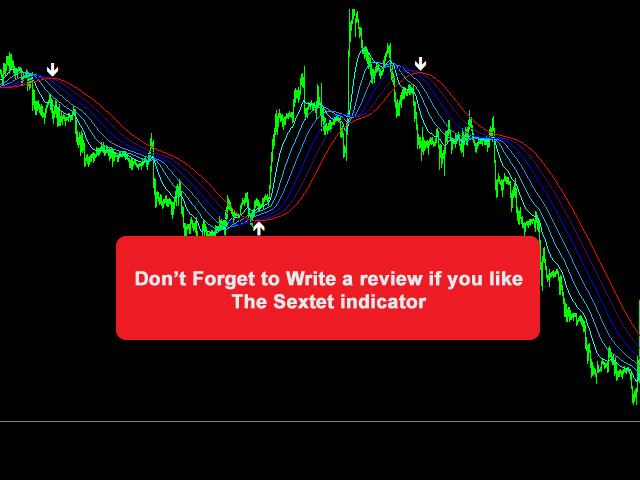
- Helps visualize trend alignment and directional structure.
- Can be used as a chart context tool for trend-following analysis.
- Designed for traders who want a simple visual view of moving-average alignment.
How It Works
The first level is calculated from price. Each following level is calculated from the level before it. When the levels align in sequence, the chart shows a more organized trend structure. When the levels are mixed, market direction may be less clear.
Important
The Sextet is a decision-support indicator. It does not predict future price movement and does not guarantee trading results. Use it with your own confirmation process, execution rules, and risk management.


1st day to use it : 100 % win on the peaks, can to be use on Binary, avoid to use on flat.