ZhiBiSmart MT5
- 지표
- 버전: 1.0
- 활성화: 10

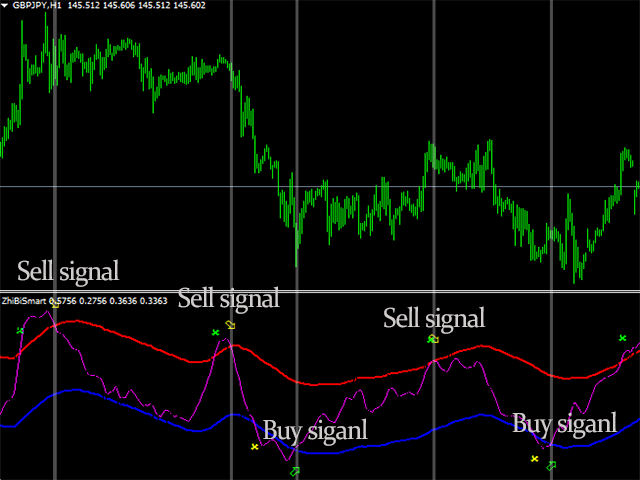
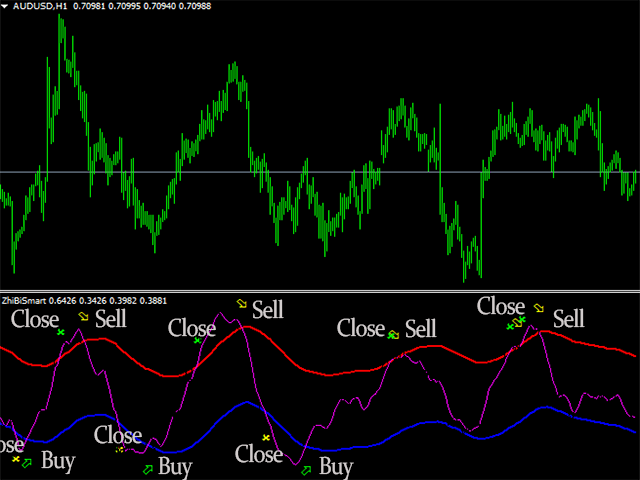
ZhiBiSmart is suitable for all chart cycles of all market varieties. It uses the trend back call to make the bounce band, which will better predict the band and trend.
- Buy the order: a mark with a green upward arrow;
- Buy the close: the green cross mark appears;
- Sell the order: a mark with a yellow downward arrow;
- Sell the close: a yellow cross mark;
parameter settings:
- [TrendPeriod]: the period of the trend line;
- [SignalPeriod]: the period of the signal line;
- [TrendSpread]: The final determined spread of the trend line;
- [Alert_No_Off]: Open or close the pop-up message; true=on, false=off;
- [SendMail_No_Off]: Email on or off; true=on, false=off;
- [SendNotification_No_Off]: The message is pushed to the mobile terminal on or off; true=on, false=off;
- [UpArrowMessage]: The content of the message sent when the upward arrow appears;
- [DownArrowMessage]: The content of the message sent when the downward arrow appears;
- [UpCloseMessage]: The content of the message sent when the fork of the up order is closed;
- [DownCloseMessage]: The content of the message sent when the fork of the down order is closed;
More useful indicator URL: https://www.mql5.com/en/users/zhengqiuyang/seller