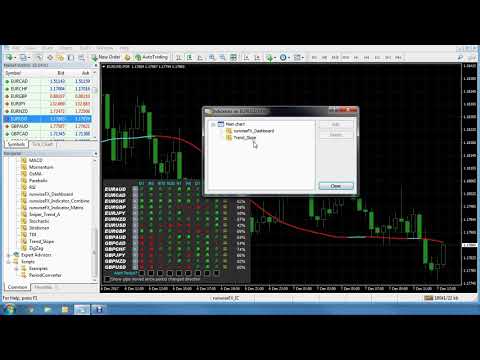
Configurable Dashboard Pro by RunwiseFX MT5
- 지표
- 버전: 6.4
- 업데이트됨: 21 9월 2023
- 활성화: 5

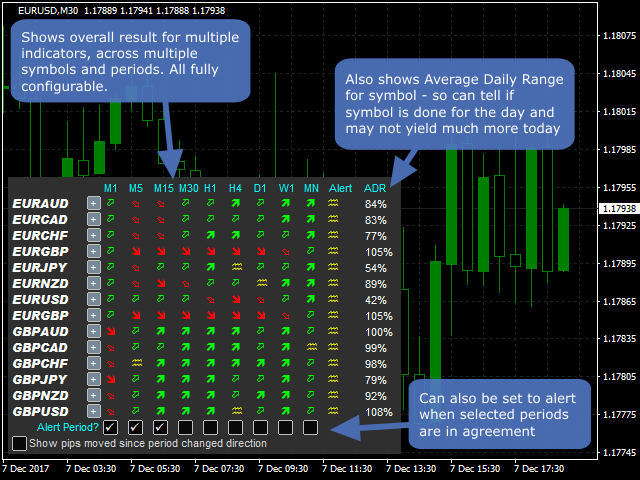
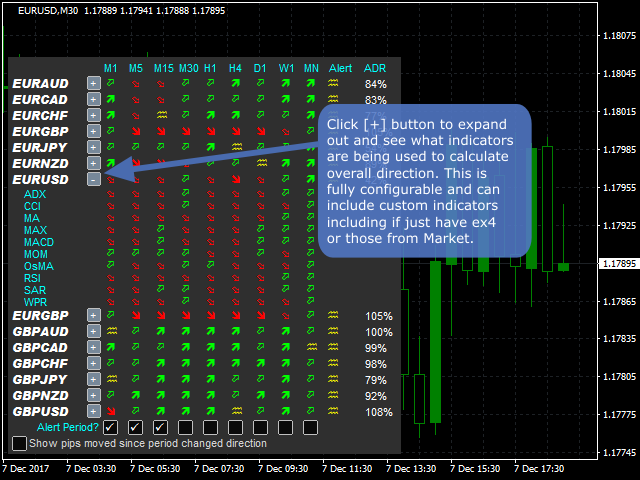
Displays multiple indicators, across multiple timeframes and symbols to give a comprehensive overview of the market. Uniquely, the indicators are configurable and can include custom indicators, even those where you just have the ex4 file or those purchased from Market. Standard indicators can also be selected, the default being ADX, CCI, market price above/below Moving Average (MA), Moving Average Cross (MAX), MACD, Momentum (MOM), OsMA, RSI, Parabolic SAR, William's Percentage Range (WPR). Use [+] button to expand symbol and see readings of each configured indicator.
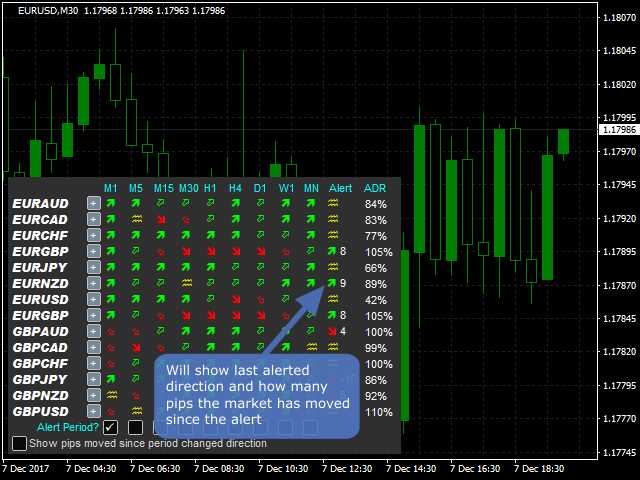
The product will also alert when selected timeframes change direction, which can take place when only multiple timeframes are in agreement. The last alert direction is shown with number of pips moved since the alert. The Average Daily Range (ADR) is also shown, so can tell if symbol is 'done for the day'. Optionally, can also display the number of pips moved since the timeframe changed direction.
The dashboard shows solid arrows if all indicators are in agreement (depending on Important_alertThresholdPercentage input) or hollow arrows if majority.
The properties of the standard indicators can be changed via the indicator inputs and a wide variety custom indicators are supported.
Notes when using strategy tester: Alerts will appear in the Journal tab. Indicators on the weekly and monthly timeframes may not be calculated.
Inputs
- Important_alertThresholdPercentage - Threshold at which alert will happen and solid arrows will be shown, e.g. if set to 75 would mean 75% of indicators would need to agree
- Important_alertOnlyWhenAllSelectedMatch - If true, then will only alert if all the selected timeframes are in agreement.
- Important_defaultAlerts - Set to 1 if alert should be on by default. Values are comma separated for each timeframe.
- Important_periodsToShow - Periods (timeframes) to show. Values are comma separated.
- Important_symbol - Symbol to show information for, comma separated. Can also specify currencies.
- Important_symbol2 - Additional symbols.
- Important_symbolsExclude - Will exclude symbols that contains any of the items, e.g. exotic currencies.
- CustomN_indicatorName - Custom indicator name as appears in Indicators folder in your MetaTrader Data Folder.
- CustomN_indicatorDisplayAs - Indicator name to display as in the dashboard. If left blank then will truncated CustomN_indicatorName.
- CustomN_indicatorProperties - Indicator properties. Should be comma separated in the order they appear in the indicator. Boolean type inputs should be set as 0 or 1 and text inputs should be enclosed in double quotes. If left blank then the default indicator properties will be used.
- CustomN_colorIndex - Color index of the indicator to show in matrix. Can be comma separated if buy and sell indexes need to be supplied.
- CustomN_shift - Candle shift to use for indicator capture, where 0 is live candle and 1 is most recently closed candle.
- CustomN_midPoint - Mid point to be used if only one color index is supplied and gives the indicator value that represents the transition from buy to sell.
- CustomN_nullValue - Null value to be used to decide if the indicator value should be ignored / regarded as not present. AUTO is EMPTY_VALUE or 0.
- CustomN_captureMethod - Controls how the indicator value should be interpreted (see video for examples)
- Include_* - Allows the standard indicators to be turned on/off, in terms of being in the dashboard and contributing to the alert.
- Box_* - Allows the position of the matrix to be changed.
- Property_* - Allows the properties of the standard indicators to be changed, e.g. period of moving average.
- Gen_alert* - Allows the alert to be sent to mobile / email.


Thank you Mark. I have searched a long time for a customisable multiframe alignment dashboard. I have been able to configure my own strategy with your dashboard within a day and produced excellent results. Well written software which is low in CPU usage. Keep up the good work. Thanks Andrew
P.S Mark also helped with the MT4 version when I realised I couldn't use some of my MT4 indicators in MT5.