TriSync

TriSync User Manual

Market Structure Indicator for MetaTrader 5 · Version 0.40

1. What It Is

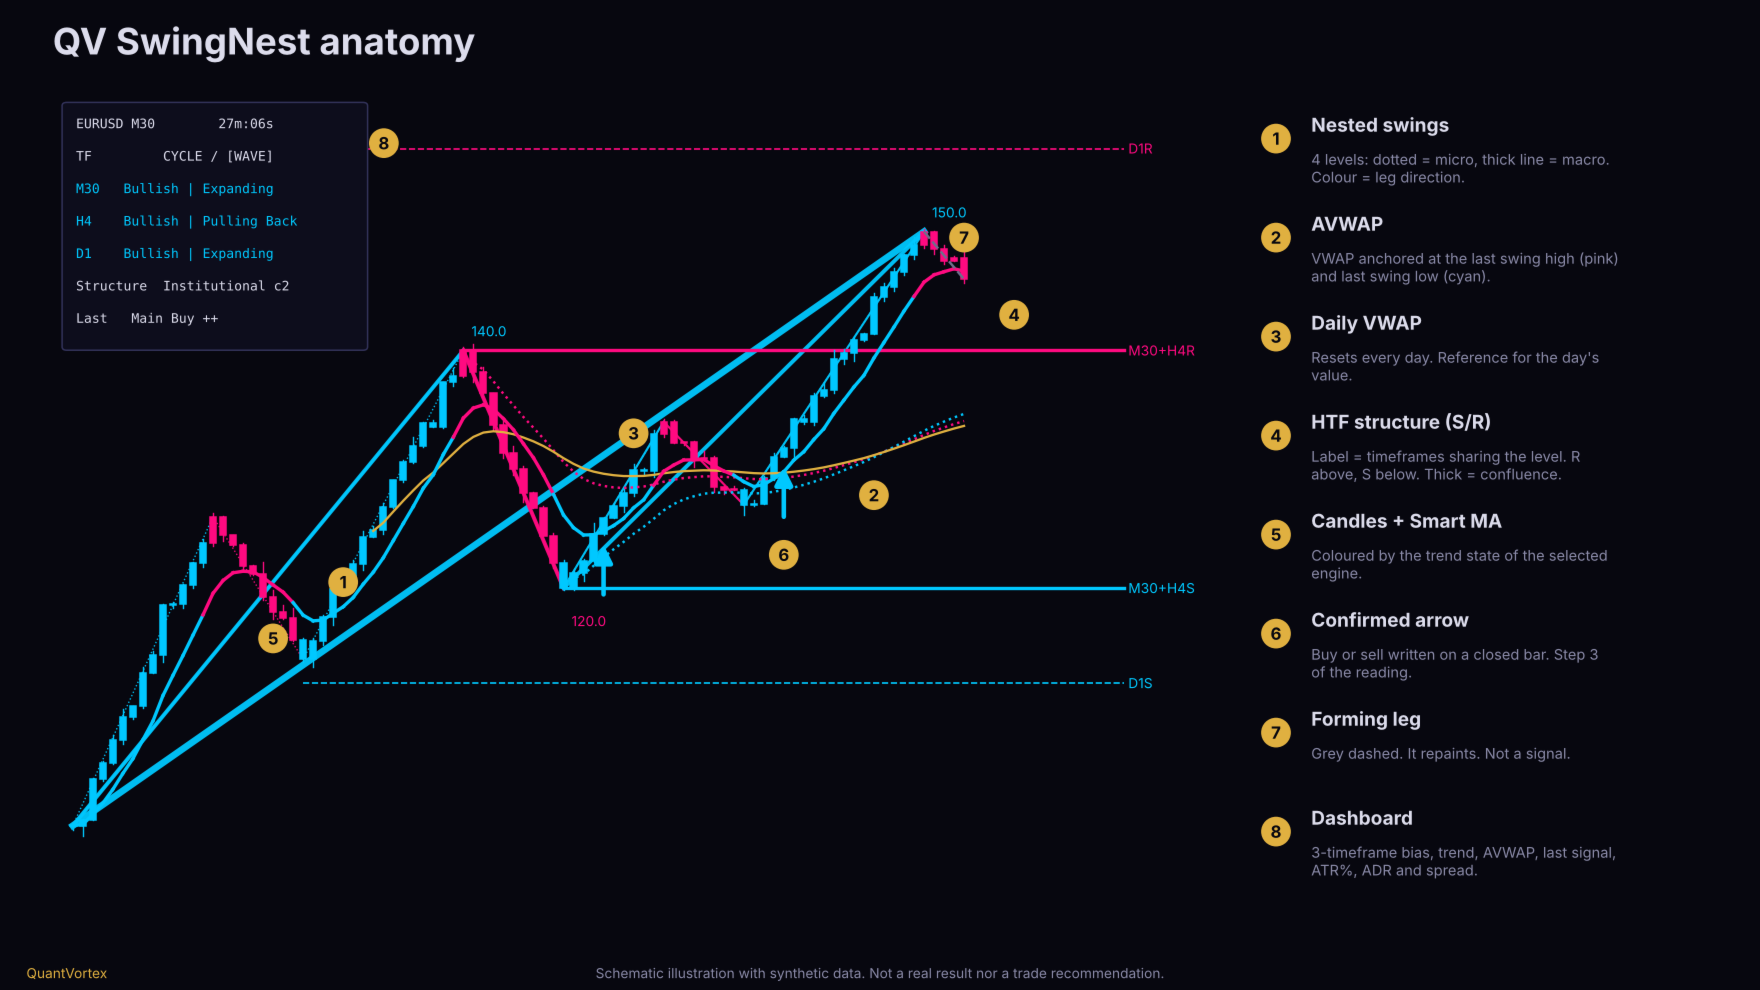
TriSync shows market structure in layers on a single chart: four nested swing levels, VWAP anchored to swing highs and lows, Daily VWAP, higher-timeframe support and resistance, three-timeframe bias, and confirmed entry arrows on closed bars.

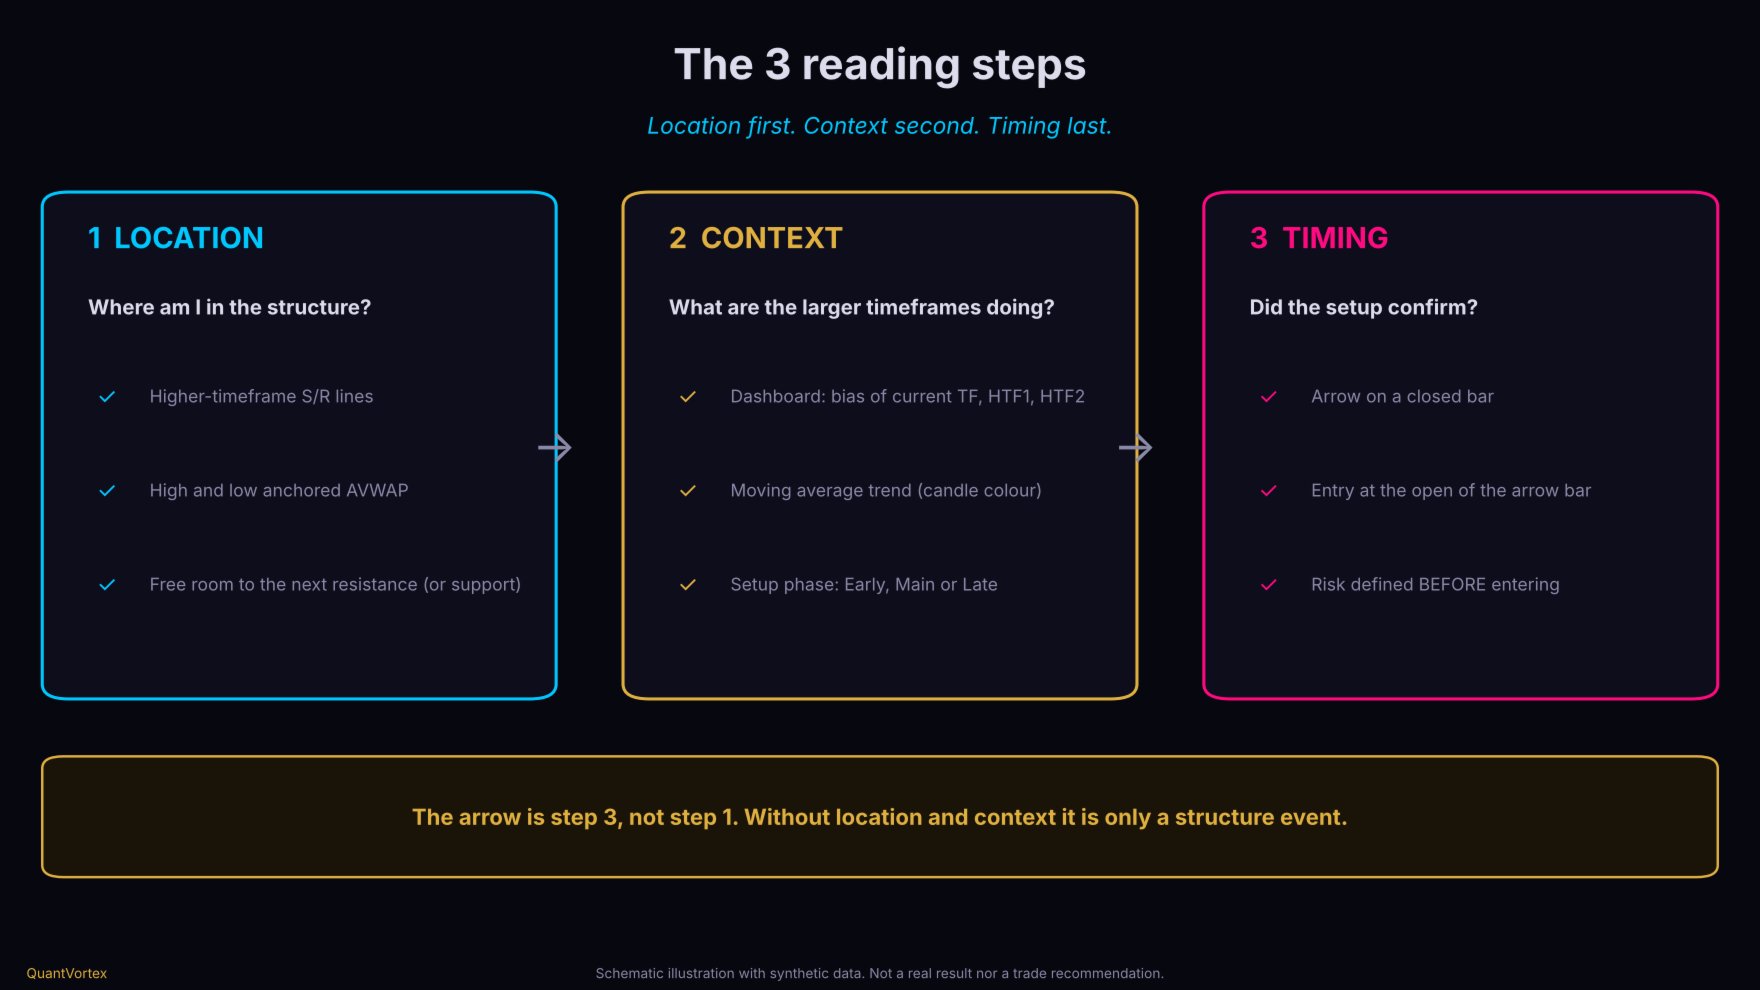
The core idea is a reading order: Location first. Context second. Timing last. The arrow is step 3, never step 1.

What it is not: it is not a robot, not a blind signal service, it does not send stop loss or take profit, and it does not promise results. It is a market-reading tool: it organizes the information, while the decision and risk remain entirely yours.2. The 3 Reading Steps (Figure 4)

  • Step 1 — Location. Where is price relative to structure? Look at higher-timeframe support and resistance lines, AVWAP, and the last swing high or low. A buy near support, with clear room to the next resistance, is very different from a buy stuck right against resistance.

  • Step 2 — Context. What are the higher timeframes doing? Read the dashboard: current TF bias, HTF1 and HTF2, the moving average trend color, and the setup phase (Early, Main, or Late).

  • Step 3 — Timing. Only after the first two steps, the arrow confirms that the setup has formed and a bar has closed in favor of the direction.

If steps 1 and 2 are not in favor, the arrow alone is not a reason to enter.

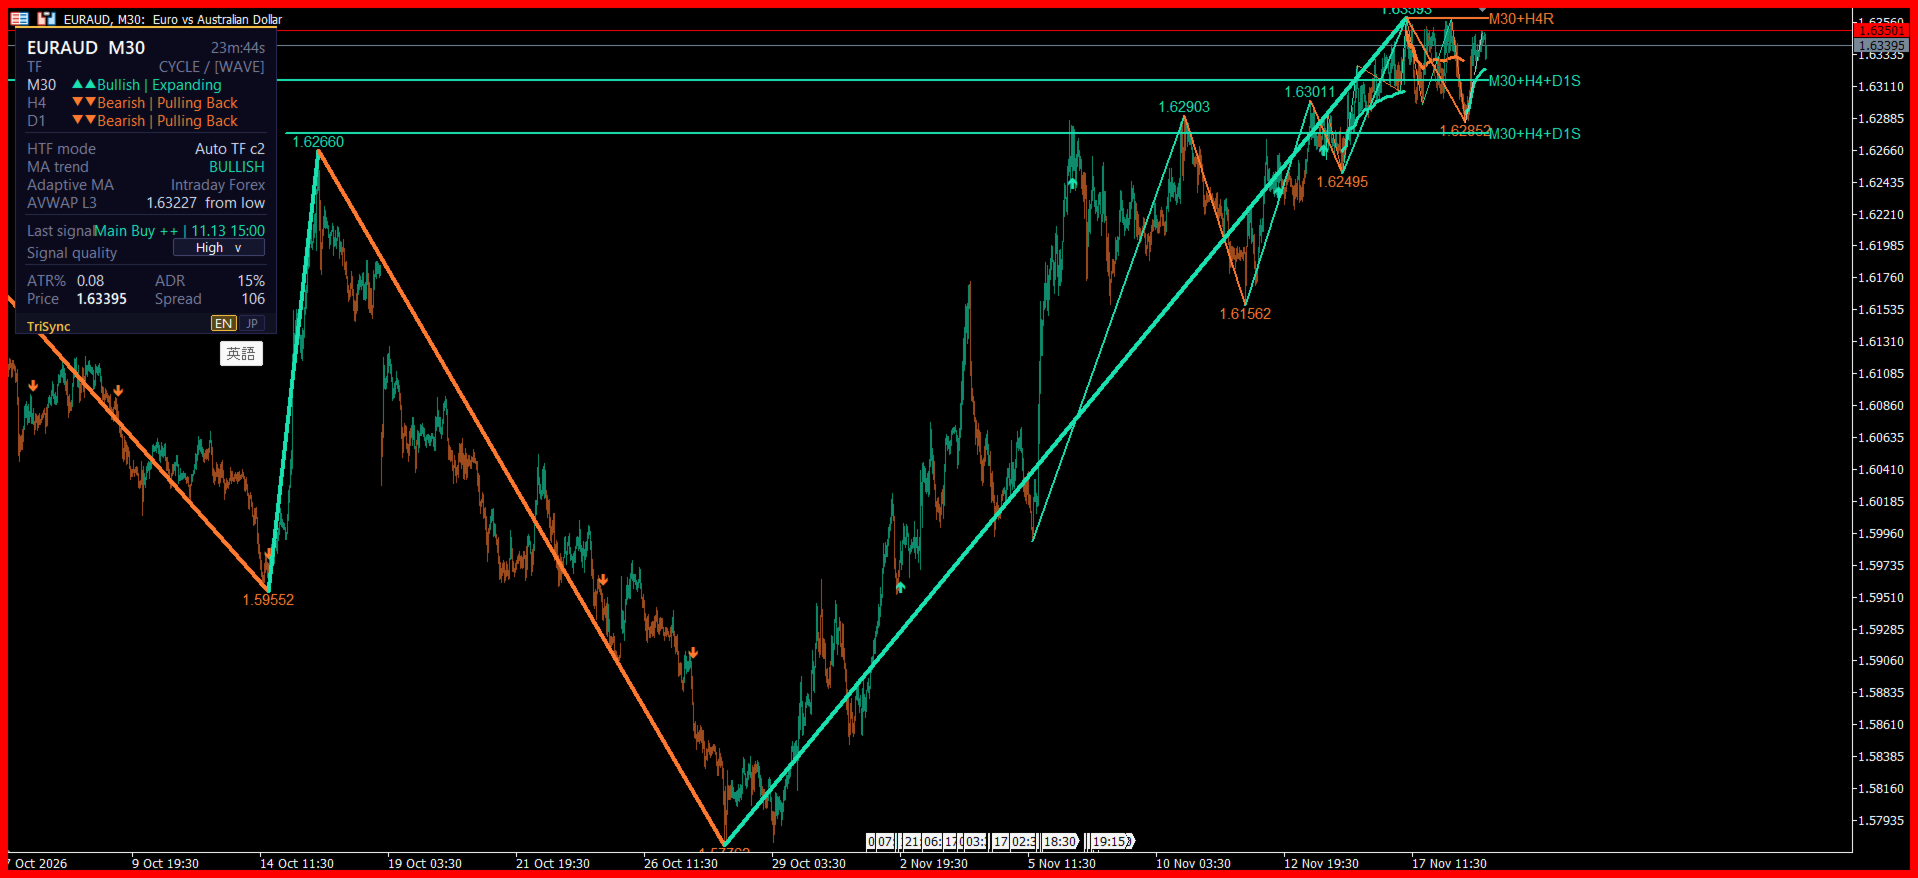
3. What You See on the Chart (Figure 1)

  • Nested Swings (4 levels): Level 1 is the minor structure (thin dotted line); levels 2, 3, and 4 move up to the macro (thicker lines). Levels 3 and 4 show the pivot price. Color indicates leg direction: cyan goes up, pink goes down (default theme).

  • Gray Dashed Leg: The forming leg, still unconfirmed. It moves with price and repaints. It is not a signal.

  • AVWAP (two dotted lines): One anchored to the last swing high (pink) and another to the last swing low (cyan), at the chosen level (default: level 3). Use as a value reference: where volume-weighted average price is since that pivot. Not a trigger.

  • Daily VWAP (gold line): VWAP that resets every day based on server time.

  • Higher-Timeframe Structure Lines: Horizontals labeled like M30+H4S : the timeframes sharing that level, followed by R (level above price, resistance) or S (level below price, support). Solid and thick lines mean confluence of 2 or more timeframes; dashed and thin means one. Nearby zones are automatically merged.

  • Colored Candles and Smart MA Line: Colored by the trend state of the chosen engine (cyan bullish, pink bearish, gray neutral).

  • Arrows: Up arrow below the candle: buy. Down arrow above the candle: sell.

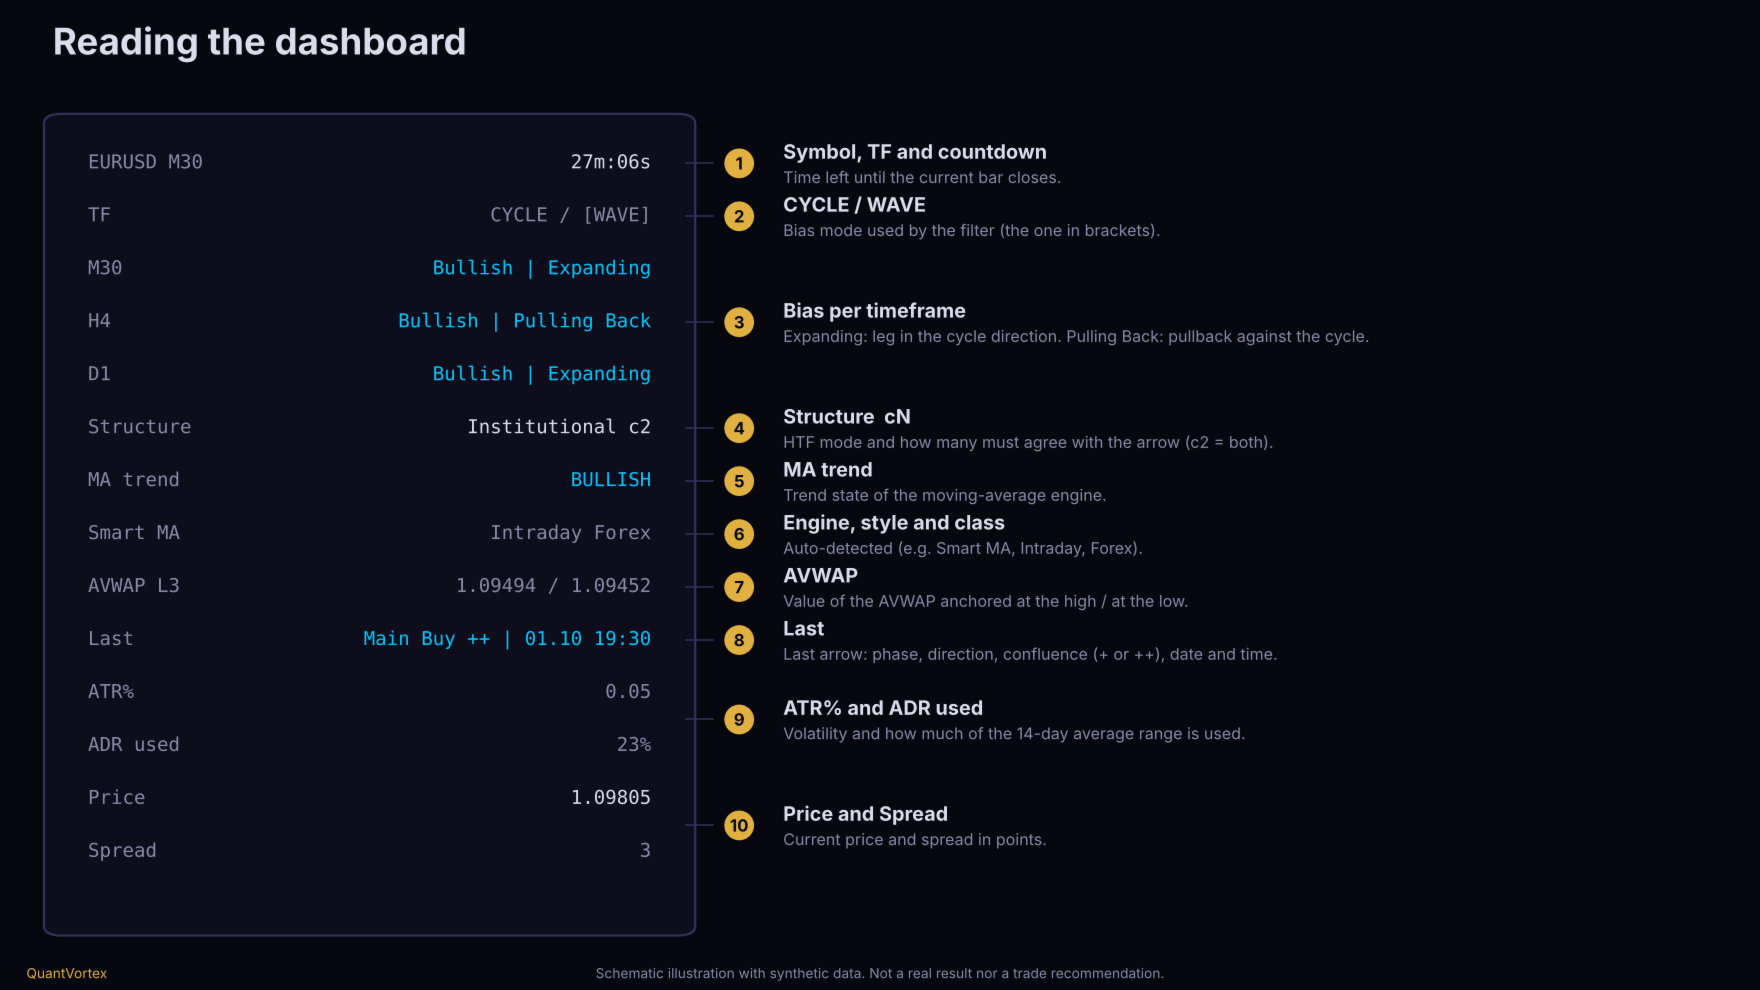
4. Reading the Dashboard (Figure 5)

  • Symbol, timeframe, and countdown to the current bar close.

  • TF — CYCLE / WAVE: Shows which bias mode the filter uses (in brackets). Wave is reactive (last leg direction); Cycle is stricter (higher highs and higher lows, or lower lows and lower highs).

  • Current TF, HTF1, and HTF2 lines: Cycle bias and current leg state. Expanding: the current leg moves in the cycle direction. Pulling Back: the current leg is a correction against the cycle. Example: Bullish | Pulling Back is an uptrend in correction.

  • Structure: Higher-timeframe resolution mode and how many HTFs must agree with the arrow (e.g., c2 means both must agree).

  • MA trend: Trend state of the chosen moving average engine.

  • Engine line: Name of the engine, style, and detected asset class (e.g., Smart MA, Intraday, Forex).

  • AVWAP: Values of AVWAP anchored at the top and bottom.

  • Last: Last signal: phase, direction, confluence (+ or ++), and timestamp.

  • ATR%: ATR divided by price, in %. ADR used: How much of the 14-day average daily range today's range has consumed. Price and Spread.

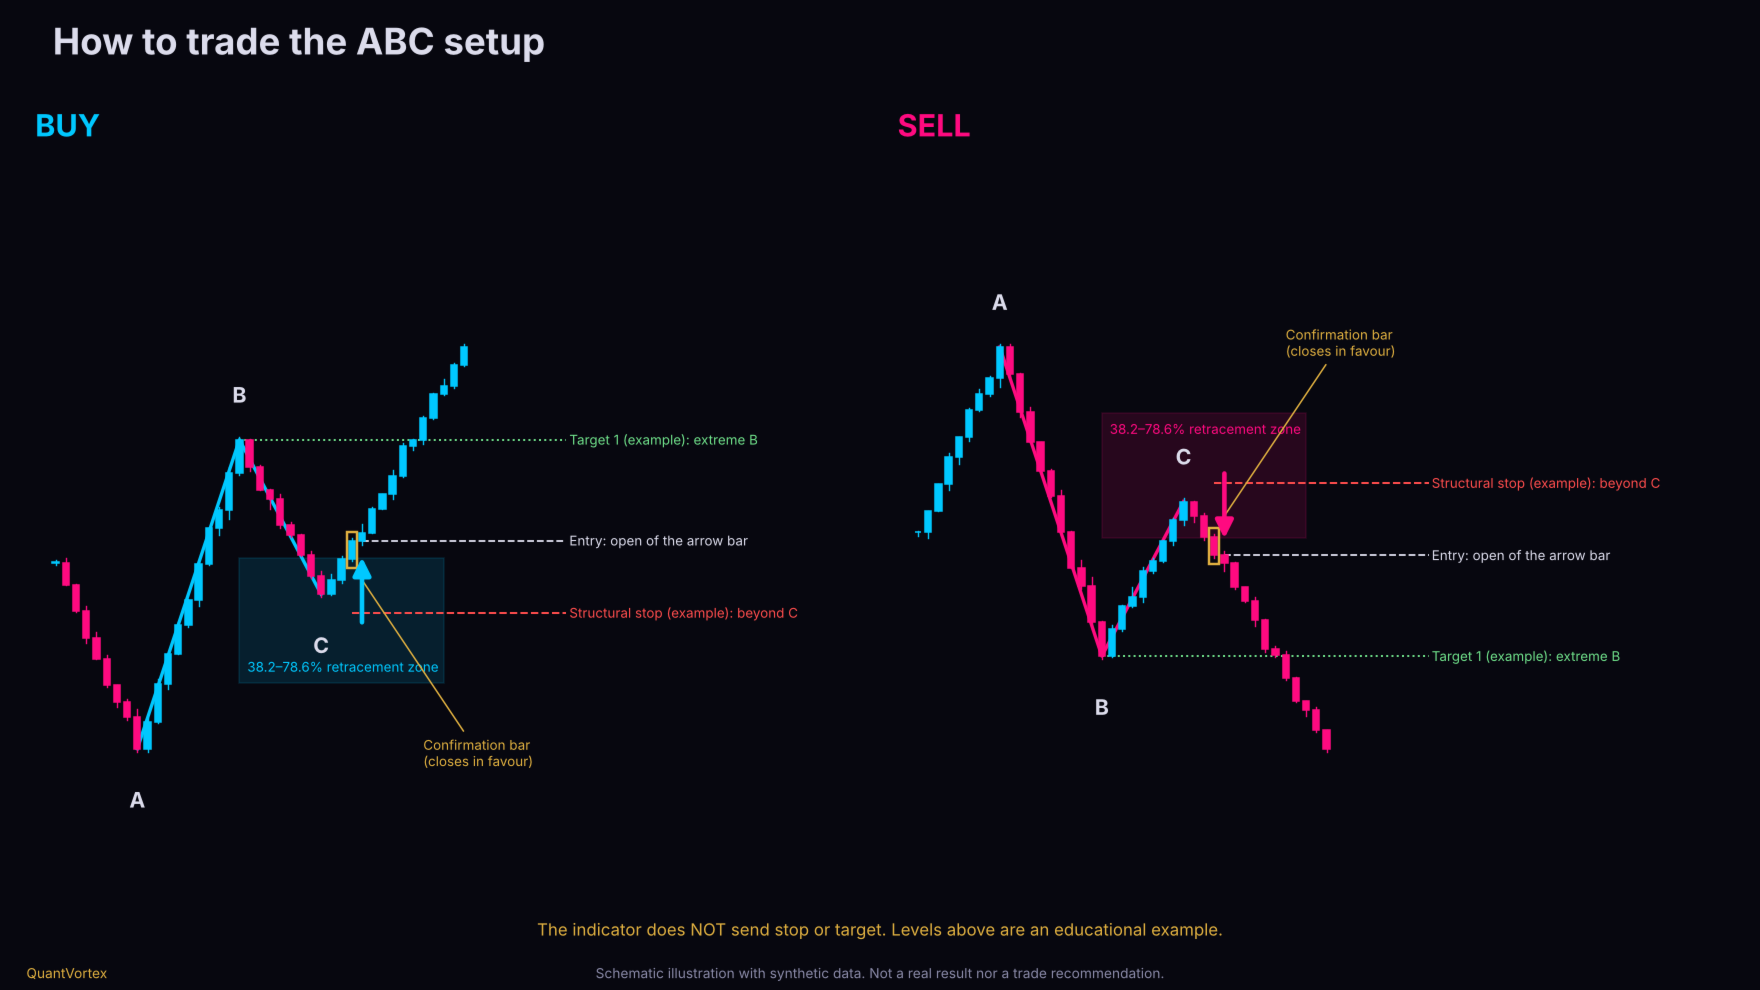
5. How to Trade (Figure 2)

The setup is an ABC pullback pattern: A is a pivot, B is the next pivot (leg A→B), and C is the pullback. The setup is only valid if C retraced between 38.2% and 78.6% of leg A→B, C did not lose the level of A, and leg A→B has at least 2.5 ATR. The arrow only appears after price reverses from C enough to confirm the pivot, and is printed at the open of the next bar.

Buy Checklist

  1. Location: Is price near support (label ending in S) or bottom AVWAP, with room to the next resistance (R)?

  2. Context: Are HTF1 and HTF2 consistent with the buy? (with c2 , the arrow only appears when both agree). Is the MA trend cyan?

  3. Phase: Early or Main are typical resumption scenarios. Late demands caution (see section 6).

  4. Timing: Up arrow. Entry is at the open of the bar where the arrow was printed.

  5. Risk: Define before entering. A reference example is a stop below the C low (structural stop) and the first target at the B high or nearest higher-timeframe resistance. The indicator does not send stops or targets: the example is educational, and position sizing by fixed risk is your decision.

Sell

Mirrored: down arrow, resistance above price as location, bearish HTFs, stop above the C high.

What to Expect from Entry

You enter after pivot C is confirmed, so you do not catch the exact bottom or top. This is a design choice: it avoids arrows in the middle of movement, but costs part of the leg. How much of the move has already been consumed is a question your own testing must answer (see section 11).

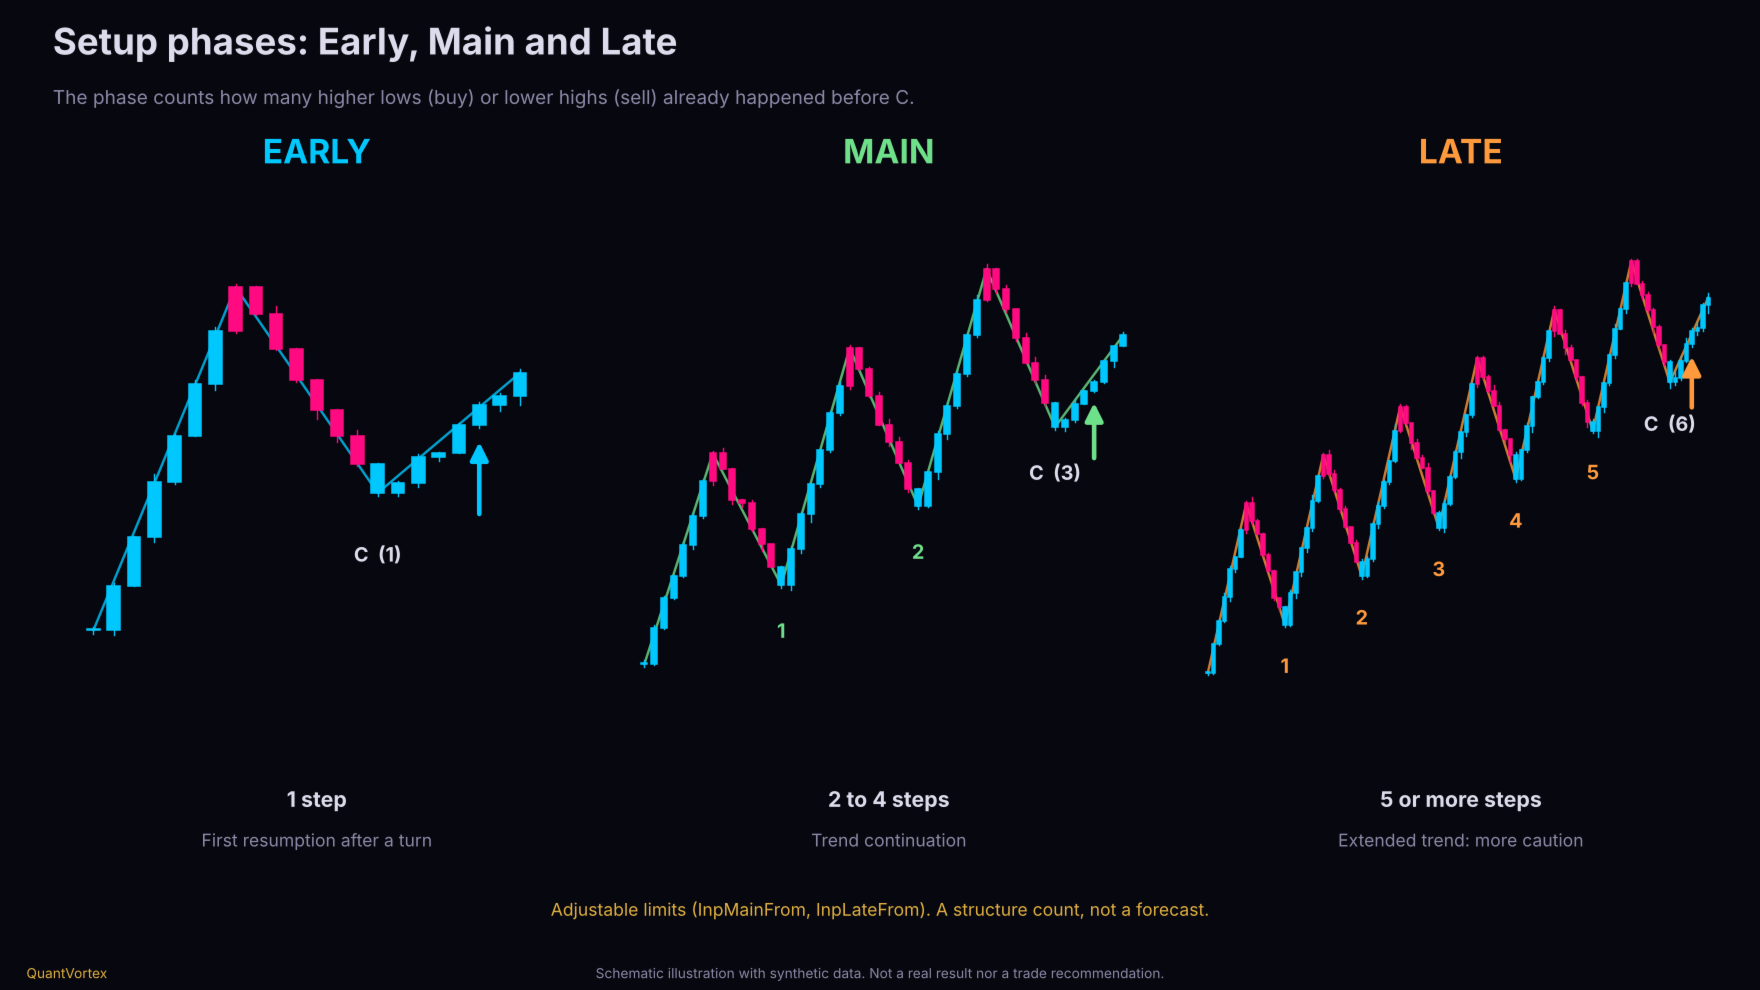
6. Early, Main, and Late Phases (Figure 3)

The phase counts how many consecutive trend-aligned highs or lows exist before pivot C (how many impulse steps have occurred):

  • Early: 1 step. First resumption after a turn.

  • Main: 2 to 4 steps. Trend continuation.

  • Late: 5 or more steps. Extended trend, higher exhaustion risk.

Limits are adjustable (InpMainFrom and InpLateFrom ), and each phase can be disabled. It is a structural count classification, not a prediction. Verify with your data whether it makes a difference on your asset.

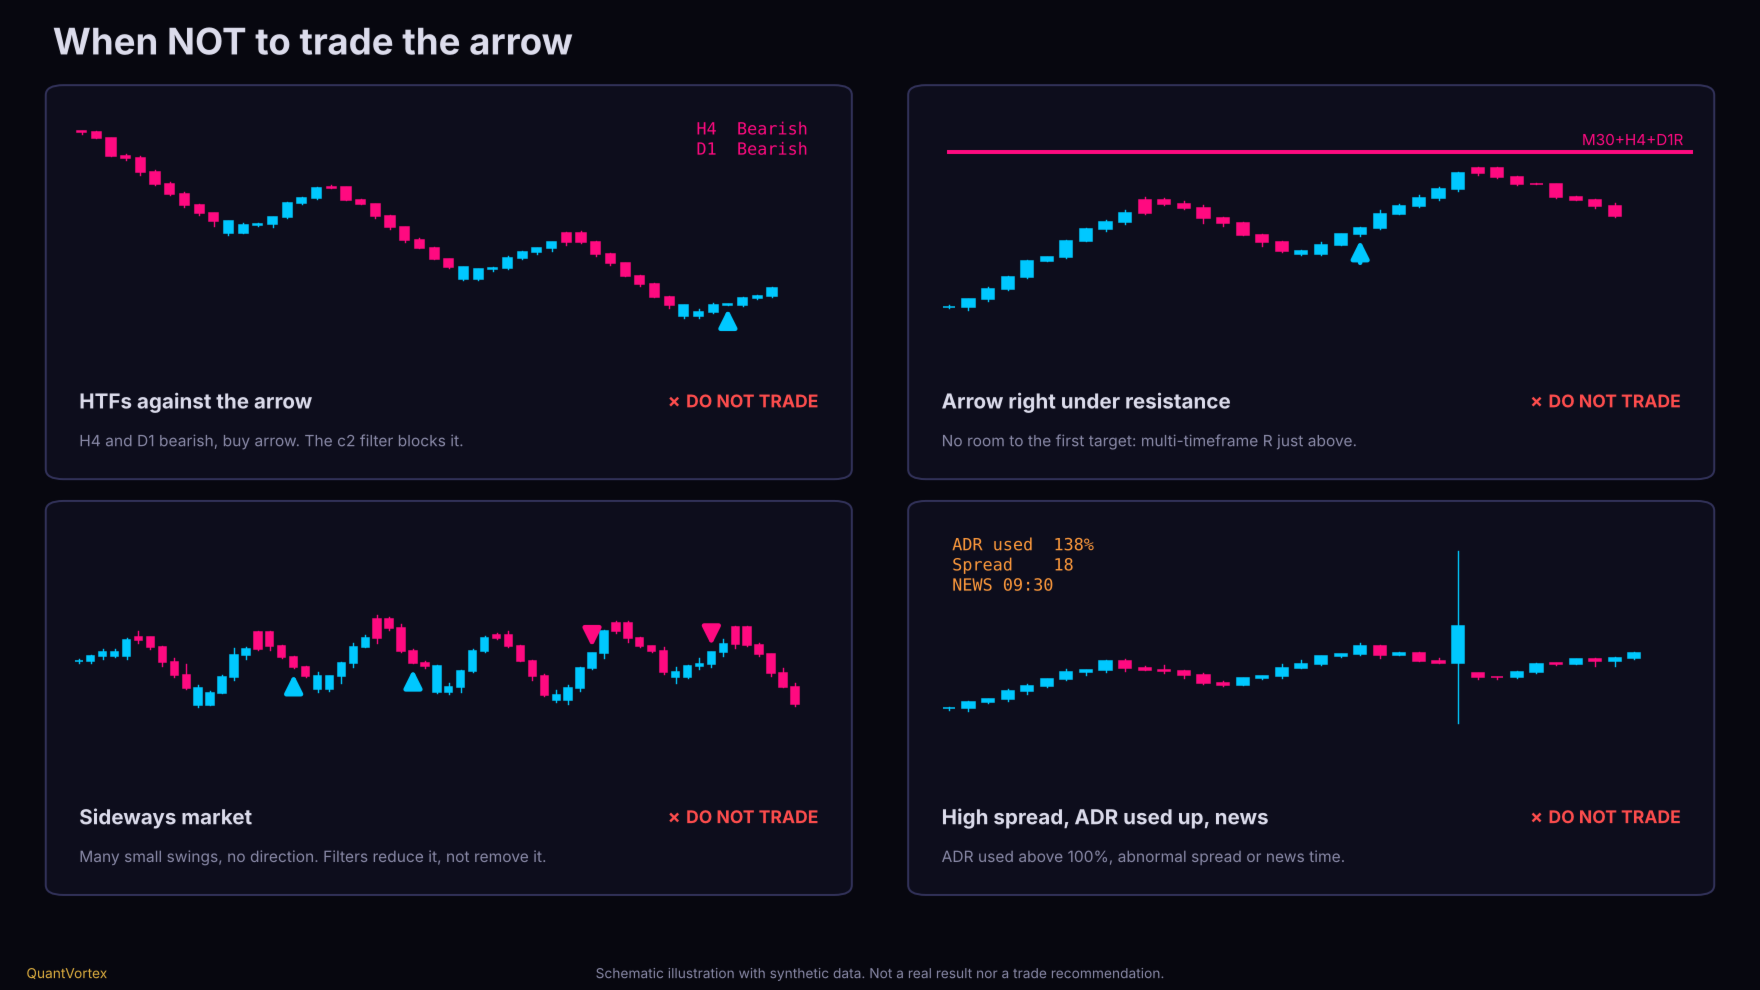
7. When Not to Trade (Figure 6)

  • Higher timeframes against the arrow: The default filter (c2 ) blocks these. If relaxed, know you are trading against context.

  • Arrow stuck right against resistance (or support for sells) from multiple timeframes: No room to the first target.

  • Ranging market: Many small, directionless swings. Minimum leg size and cooldown filters reduce noise, but don't eliminate it.

  • High spread, ADR consumed (>100%), or news times: Dashboard shows spread and ADR used.

  • Dashed leg: It repaints and is not a signal.

8. Configuration

Auto Configuration

  • Style by timeframe: Scalping (up to M5), Intraday (M15 to M30), Intraweek (H1 to H3), Swing (H4+). Also GANN (3-bar swing) and Manual.

  • Asset class by symbol: Forex, Metal, Index, Crypto, Energy, Stock. B3 contracts WIN and WDO are recognized by prefix.

  • Style and class adjust swing sensitivity (reversal in ATR multiples). These values are starting points, not calibrated values: test on your asset.

Higher Timeframes (Institutional Ladder)

Chart TF HTF1 HTF2
M1 M5 M15
M5 M15 H1
M15 H1 H4
H1 H4 D1
H4 D1 W1
D1 W1 4 weeks

Higher candles are built from chart candles (synthetic engine) using server time blocks, maintaining identical results for identical history. Also available: Absolute TF (you choose both) and Fixed Ratio Cascade (x2, x3, x4, or x6).Main Parameters

Parameter Default Purpose
InpStyle / InpClass Auto Style and asset class
InpEngine Smart MA Trend engine (Smart MA, EMA, or conservative)
InpBiasMode Wave Wave (reactive) or Cycle (stricter)
InpMinConf 2 Higher timeframes that must agree (0 to 2)
InpMinLegATR 2.5 Minimum leg size A→B in ATR
InpCooldown 12 Minimum bars between same-direction arrows
InpQuality Standard Strict requires strong confirming bar and close beyond previous bar
InpAvwapLvl 3 Swing level anchoring AVWAP
InpMaxBars 3000 Bars analyzed (fewer bars = lighter)
InpID A Use different IDs when running multiple instances on the same chart

9. Alerts

Popup, sound, and push notifications can be toggled separately. 

추천 제품
Liquidity Map
Alex Amuyunzu Raymond
Liquidity Map  Overview The Liquidity Map indicator is an advanced visualization tool based on ICT Smart Money Concepts . It automatically identifies daily Buy Zones , Sell Zones , and Liquidity Levels , showing where price is likely to reverse or continue based on institutional order flow. It calculates key levels from the daily session — such as the previous day’s high, low, and midpoint — then derives a premium (sell bias) and discount (buy bias) structure. When price trades into these mapped
Linha PCM Fimathe
Anderson Maicon De Vargas Odorcik
1 (1)
Manual de Instalação e Configuração Para que você tenha a melhor experiência profissional, siga estes passos simples para preparar o seu terminal: 1. Ativação no Terminal (Ajuste de Segurança) Antes de começar, precisamos garantir que o MetaTrader permita que você manipule a ferramenta livremente: Pressione Ctrl + O para abrir as Opções . Vá na aba Gráficos . Marque a opção: "Selecionar objetos com um clique do mouse" . Isso permitirá que você ajuste a régua de medição de forma instantânea. 2. V
Round levels for XAUUSD
Antonio Chrispus Mpanga Ntege
RoundLevels is an XAUUSD indicator designed to display psychological round-number price levels on the chart. These levels can be used as reference points when analyzing price movement, support and resistance, breakouts, retests, and reactions around commonly observed price intervals. The indicator automatically presents selected round levels on the chart, reducing the need to mark these levels manually. Traders can use the displayed levels together with their existing market structure, volatili
SLL Struct
Akarat Premprat
SLL Struct is a market structure and cycle Fibonacci indicator for MetaTrader 5. It is designed to help traders visualize confirmed price swings, identify Bull and Bear market structure, classify breakout behavior, and display cycle-based Fibonacci extension levels directly on the chart. Main features: • Confirmed Swing High and Swing Low structure • Bull and Bear market structure visualization • Complete and Neck Break classification • Divergence-aware structure classification • Candidate c
Moving pivot Average Fibonacci The  indicator compares the selected period with its counterpart from the previous period. The indicator determines the moving Fibonacci levels for the day or any time interval to assess the price movement range from the time average. The indicator helps predict the expected high or low for the day based on historical time data. The pivot line can be considered an average trend line and use it in a variety of trading strategies. If you have any question about the
DM IND Exclusive
Sergio Vidal Prado
Indicador Para Opções Binarias. Indicator for Binary Options Usa dois gales. Instalar em mt5 Esse indicador é para ser usado no tempo de vela de 5 minutos e em M5. Este também funciona em M1, porém é mais eficiente em M5. Só descompactar e copiar os arquivos na pasta de dados do seu MT5. Arquivos indicator na pasta MQL5 - Indicator. Baixe também a Media Movel totalmente gratis: https://www.mql5.com/pt/market/product/50400 Esse Indicador é para a próxima vela. Apareceu a seta, só aguardar a próx
Signal Eskiya mt5
Vitalii Zakharuk
Signal Eskiya, in addition to channel lines, reflects entry signals in the form of arrows. Trading strategies using the channel indicator belong to the classic methods of technical analysis, are easy to execute, and therefore available even to beginners. Price ranges work equally well on any trading assets and timeframes, they can be used both independently and with additional confirmation from oscillators and market volumes. American traders say: “Trend is your friend”, which means “Trend is
Adaptive Math Zones Indicator is a professional MT5 indicator designed to identify high-probability price reaction areas using mathematical price projections and Fibonacci-based channel structures. The indicator automatically builds a reference price channel, highlights neutral zones, and projects future price levels (50%, 100%, and 200%), helping traders visually understand market structure and potential reaction points. This tool is especially effective during ranging and corrective market con
Probability Range Bands
Florian Nuebling
5 (1)
The indicator ‘Probability Range Bands’ gives a prediction of the amount, how much the asset is moving from its current price. The range bands give probabilities, that the candle close will not exceed this certain price level. It is also called the expected move for the current candle close.   This Indicator is based on statistical methods, probabilities and volatility. Asset price is assumed to follow a log-normal distribution. Therefore, log returns are used in this indicator to determine the
CypherNexus
Casey Nkalubo
3 (1)
Cypher Pattern Detector A tool for automatic detection of Cypher harmonic patterns (XABCD) in financial charts. Overview The Cypher Pattern Detector identifies both bullish and bearish Cypher harmonic patterns in real time. It applies Fibonacci ratio validation and a quality scoring system to highlight patterns that closely match the defined structure. This helps traders observe and analyze potential market structures more consistently, without the need for manual drawing. Main Features Pattern
FREE
TTB ABC Trend Structure is a clean, practical price-action indicator designed to help traders spot trend alignment, market structure swings, and high-probability entry points without chart clutter. MAIN FEATURES: 1. ATR TREND LINE:    - A single, smooth dynamic trendline that filters macro market direction.    - Sky Blue line = Bullish trend.    - Crimson Red line = Bearish trend.    - Keeps your chart clean and free of noisy indicators. 2. POINT C SIGNAL ARROWS & TRIGGER STRIPE:    - Clear si
FREE
CYP Trade Manager Pro MT5: The Trader's Edge in Position Management Transform How You Manage Trades - Focus on What Matters Why Most Traders Fail - And How CYP Trade Manager Pro Solves It Many traders have solid entry strategies but lack proper trade management - the key difference between professionals and amateurs. CYP Trade Manager Pro handles the critical "after entry" phase of trading that most EAs ignore, giving you the edge that institutional traders use every day. Who Is It For Manual
HTF Open Markers + ICT Silver Bullet Zones — Usage & Strategy Guide What it draws Session 1 / Session 2 lines : vertical lines at the open of every bar on two independently configurable higher timeframes (defaults: H4 and D1), including a projected line for the rest of today's not-yet-opened bars on sub-daily timeframes, so you can see where the next candle will open before it happens. ICT Silver Bullet zones : shaded rectangles over the three classic ICT kill-zone windows, converted from New Yo
FREE
Send me a message so I can send you the setfile 다양한 구성이 가능한 견고한 로봇 아래 스크린샷의 설정에 따라 10분 기간으로 BTC를 사용하세요. 전문가 로봇을 구매할 경우, 로봇을 지속적으로 개선하기 위해 수정을 요청할 권리가 있습니다. 주요 특징 이동 평균 교차 전략: EA는 두 개의 이동 평균선(MA1과 MA2)을 사용하여 거래 신호를 생성합니다. 빠른 MA(MA1)가 느린 MA(MA2) 위 또는 아래로 교차하면 거래가 시작됩니다. 마팅게일 전략: 거래에서 손실이 발생하면 다음 거래의 로트 크기가 승수(마팅게일 승수)만큼 증가합니다. 마팅게일 시퀀스는 승리한 거래 후 또는 최대 마팅게일 단계 수(maxMartingale)에 도달하면 재설정됩니다. 위험 관리: 손절매(SL) 및 이익실현(TP) 수준은 구성 가능합니다. 수익을 확보하고 손실을 최소화하기 위해 추적 정지 및 손익분기점 기능이 포함되었습니다. 일일 이익/손
MultiSymbolsWpr Indice x IBOV
Israel Goncalves Moraes De Souza
O Indicador identifica relação do Índice com a soma dos principais ativos, funciona para qualquer mercado do mund o, possui um oscilador WPR com a soma dos principais ativos escolhidos, indicando a antecipação do movimento em relação ao Índice. Características WPR com a soma dos papéis escolhidos - branco WPR do papel atual - vermelho Canal de Tendência O indicador pode indicar movimento de entradas, sendo: cruzamento das linhas cruzamento da linha Multi Symbols no -50 cruzamento entre os canai
FREE
Fibonacci Retracement EA
Choawana Malaikitsanachalee
Fibonacci Retracement EA for MetaTrader 5 Fibonacci Retracement EA is an Expert Advisor that shows Fibonacci-based trading logic directly on your chart. It builds a Fibonacci box from recent candles, shows where it is waiting to enter, and manages each trade with break-even and trailing stop rules. It was built to help traders learn and test a rule-based approach. Please test it on a demo account before using real money. How It Works 1. Fibonacci box: the EA finds the high and low of recent
TM Price Stretch Map은 캔들이 밴드 밖에서 마감한 뒤 다음 확정 캔들이 밴드 안으로 돌아왔는지 차트에 표시합니다. 실선 밴드는 해당 시점까지 확인된 가격만 사용하는 인과적 가우시안 커널 계산을 기반으로 합니다. 상단 밴드 위에서 마감하면 빨간 점, 하단 밴드 아래에서 마감하면 청록색 점이 표시됩니다. 그 다음 확정 캔들이 두 밴드 안에서 마감하면 상단 이탈 뒤에는 아래쪽 화살표, 하단 이탈 뒤에는 위쪽 화살표가 표시됩니다. 점과 화살표는 실선 밴드만 기준으로 계산됩니다. 선택 가능한 점선 밴드는 과거 데이터를 소급하여 평활화하므로 새 캔들이 생기면 과거 곡선이 다시 그려질 수 있습니다. 점선은 시각적 분석용이며 점이나 화살표를 생성하지 않습니다. 커널 대역폭, 밴드 폭, 가격 소스, 표시 기간, 색상, 중심선과 마커를 설정할 수 있습니다. 자동 매매를 하지 않으며 가격 반전을 보장하지 않습니다.
FREE
ApexForge MA Trend Strength Professional is the flagship edition of the ApexForge product line, delivering the most complete feature set for traders who demand professional-grade market analysis. Built for serious traders, it combines powerful trend evaluation with extensive customization, providing a flexible solution for scalping, intraday trading, swing trading, and multi-timeframe analysis. The indicator automatically evaluates moving average slopes and converts them into five intuitive tren
Adaptive SR Zones Breakout
Alex Amuyunzu Raymond
Adaptive SR Zones – Breakout Edition Adaptive SR Zones is a next-generation MetaTrader 5 indicator that automatically maps support and resistance zones and tracks breakout activity in real time. Designed for traders who rely on market structure and zone confluence, it combines multi-timeframe analysis , breakout confirmation logic , and customizable alerts into one powerful tool. No repainting. Core Features Dynamic Support & Resistance Mapping Detects zones from swing highs/lows and reaction po
Alphabet AI MT5
Sergei Pomytkin
3.43 (7)
알파벳 AI는 평균 회귀 전략을 기반으로 하는 어드바이저입니다. 즉, 시장의 자연스러운 특성인 큰 변동 후 평균값으로 회귀하는 특성을 활용합니다. 이 알고리즘은 자산의 현재 가격을 지속적으로 분석하여 계산된 평균값과 비교합니다. 가격이 평균값에서 크게 벗어나면 어드바이저는 이를 행동 신호로 해석합니다. 상한선을 초과하면 가격 하락을 예상하여 숏 포지션을, 하한선 아래로 떨어지면 가격 상승을 예상하여 롱 포지션을 취합니다. 저희 어드바이저의 특징은 채널 경계를 파악하고 잘못된 신호를 걸러내는 적응형 접근 방식으로, 중간 정도의 추세에서도 효과적으로 작동한다는 것입니다. 특히 가격 채널 내에서 급격한 변동을 보이는 통화쌍에서 탁월한 성과를 보입니다. Advisor는 20년 넘게 데이터 테스트를 거쳤으며 그 기간 동안 가장 불안정한 기간도 견딜 수 있습니다. 컴퓨터를 연중무휴 24시간 실행할 수 없다면 VPS 서버 서비스를 이용하는 것이 좋습니다. 고문은 12개월 이상 낮은 손실률로 안
Automatically plots the 'Golden Fibonacci Ratio’ between the High and Low of the previous day... ...Highs and Lows are great Support and Resistance zones. Breakouts of Fibonacci levels are key points for entry and exit of trades. Pink lines indicate that the previous day's Candle closed lower. Blue colored lines indicate that the previous day's Candle closed higher.
Adaptive Trend Projection is a MetaTrader 5 indicator designed to help traders visualize the possible continuation of the current market structure. The indicator analyzes recent price behavior using two weighted regression windows: a longer lookback to understand the broader direction and a shorter lookback to capture the most recent movement. It then combines trend slope, recent acceleration, volatility, and ATR-based limits to draw a forward projection for the next candles. The central project
Auto Trend Doug Scalper – Linhas Automáticas de Tendência O Auto Trend Doug Scalper é um indicador desenvolvido para MetaTrader 5 (MT5) que identifica e desenha automaticamente linhas de tendência, suporte e resistência diretamente no gráfico. Seu objetivo é facilitar a análise técnica, permitindo que o trader visualize regiões relevantes de preço, acompanhe a estrutura do mercado e identifique possíveis áreas de reação, continuidade ou rompimento. Principais funcionalidades Linhas automáticas:
FREE
Midpoint Bands
Emanuel Cavalcante Amorim Filho
Midpoint Bands   is a   channel-like   indicator that draws two lines on the chart - an upper band and a lower band, pointing out possible reversal levels. This is one of the indicators used in the Sapphire Strat Maker - EA Builder. Sapphire Strat Maker - EA Builder:  https://www.mql5.com/en/market/product/113907 The bands are simply calculated like this: Upper Band   = (HighestHigh[N-Periods] + LowestHigh[N-Periods])/2  Lower Band   = (LowestLow[N-Periods] + HighestLow[N-Periods])/2 Middl
FREE
이 다중 시간 프레임 및 다중 기호 표시기는 스토캐스틱 신호 라인이 스토캐스틱 메인 라인을 교차하는 시기를 식별합니다. 대안으로 스토캐스틱이 과매수/과매도 영역을 벗어나는 경우(본선을 가로지르는 신호선 없이) 경고할 수도 있습니다. 보너스로 볼린저 밴드와 RSI 과매수/과매도 교차를 스캔할 수도 있습니다. 자신의 규칙 및 기술과 결합하여 이 지표를 사용하면 자신만의 강력한 시스템을 만들거나 향상시킬 수 있습니다. 특징 Market Watch 창에 표시되는 모든 기호를 동시에 모니터링할 수 있습니다. 지표를 하나의 차트에만 적용하고 전체 시장을 즉시 모니터링하십시오. M1에서 MN까지 모든 시간 프레임을 모니터링할 수 있으며 교차가 식별되면 실시간 경고를 보냅니다. 모든 Metatrader 기본 경고 유형이 지원됩니다. 표시기에는 대화형 패널이 포함되어 있습니다. 설명은 별도의 스크린샷을 참조하십시오. 표시기는 신호를 텍스트 파일에 쓸 수 있습니다.       또는 전역 변수    
XAUUSD AMNESIA PROTOCOL AI     Amnesia Protocol - Exploiting the chaotic moments when the market forgets all technical analysis.    XAUUSD Amnesia Protocol AI is a breakthrough trading system based on "The Market Amnesia Hypothesis". When high-impact news hits or panic ensues, the market experiences temporary "Amnesia". Support and resistance levels become meaningless, and chaos takes over. This EA is specifically designed to remain dormant during normal market conditions and instantly awaken th
Smart Pivot Points
Alexandr Saprykin
MetaTrader 5용 스마트 피벗 포인트 - 스마트 트레이딩을 위한 명확한 레벨 스마트 피벗 포인트는 MetaTrader 5용 전문 지표로, 차트에 주요 트레이딩 레벨을 자동으로 계산하여 표시해 줍니다. 복잡한 가격 움직임을 명확하고 구조화된 지도로 변환하여 지지선, 저항선, 가격 균형점, 그리고 잠재적 목표가를 강조합니다. 명확성을 중시하는 트레이더를 위해 설계된 이 도구는 외환, 암호화폐(비트코인, 이더리움), 주가지수, 주식, 원자재(XAUUSD) 등 모든 시장에서 활용 가능합니다. 이 지표는 계산 시간을 절약하고 분석에 객관성을 더하는 믿음직한 분석 도우미입니다. 시장 신호를 제공하거나 트레이딩 결정을 대신해 주는 것이 아니라, 트레이더 스스로 정보에 기반한 트레이딩 결정을 내릴 수 있도록 고품질의 정보를 제공합니다. 주요 기능 및 이점 바로 사용 가능한 가격 좌표 시스템: 더 이상 레벨을 수동으로 그릴 필요가 없습니다. 중심 레벨(균형점), 지지선, 저항선, 매수
Five Point Turn
Brighton Mufaro Mudzingwa
FiveZero Spike & Trend Engine  The Ultimate Non-Repainting Multi-Asset Signal & Pattern System Take control of the markets with an elite, precision-engineered trading indicator designed to capture explosive market moves with extreme accuracy. Built on the powerful 5-0 Harmonic Pattern Structure (0-X-A-B-C) combined with a real-time Bollinger/Structure Block Engine and Reciprocal Ratio Validation, this tool gives you non-repaint buy and sell signals right at the candle open . Whether you trade Fo
SessionRange-MT5-Ind   is an indicator for MetaTrader 5 that builds a High/Low/Middle channel based on the given trading session. Indicator : Defines the session range   - builds a channel based on a given high/low window Draws three lines : SessionTop (blue) —   maximum session SessionMiddle (grey) — channel center SessionBottom (orange) —   minumum session Session mode (Mode) : `Previous Day` —   for classical PDH/PDL (previous day range) `Current Day` —   to display the current day’s session
FREE
Previous Day Close
Vincent Kipleting Burugo
5 (1)
The indicator is a line right at yesterday's closing price. With the indicator, there is no need for adding or deleting previous day close lines each new day. T he line gives you an instant visual reference point for support, resistance, and market sentiment.   Whether you are day trading or swing trading, this line helps you quickly gauge where the market closed last session and how current price action relates to that level. It works seamlessly across all timeframes - from 1-minute charts to d
FREE
이 제품의 구매자들이 또한 구매함
Trend Sniper X
Sarvarbek Abduvoxobov
4.87 (46)
Trend Sniper X 는 트레이더가 추세 방향과 잠재적 반전 지점을 명확하고 정확하게 포착할 수 있도록 도와주는 MetaTrader 5용 멀티 타임프레임 추세 추종 지표입니다. MT4용: https://www.mql5.com/en/market/product/193245 가격 정보: 현재 가격은 프로모션 할인가이며, 향후 업데이트 및 새로운 기능이 출시됨에 따라 변동될 수 있습니다. 보너스 혜택: 본 지표 전용 무료 자동매매 Assistant EA를 받으시려면 구매 후 작성자에게 메시지를 보내주시기 바랍니다. Code2Profit 채널 멀티 타임프레임 분석으로 시장을 마스터하세요! Trend Sniper X로 승률을 극대화하는 방법: 핵심 규칙 및 세션 팁 기술 사양 플랫폼 MetaTrader 5 지표 유형 멀티 타임프레임 추세 지표 운용 타임프레임 모든 차트 타임프레임 지원, 독립적으로 선택 가능한 상위 타임프레임(M1–MN1) 주요 상품 외환, 금(XAUUSD) 및 기타 C
SuperScalp Pro
Van Minh Nguyen
4.5 (38)
SuperScalp Pro - Professional Multi-Layer Confluence Scalping System SuperScalp Pro는 기존 Supertrend에 여러 지능형 확인 필터를 추가하여 기능을 강화한 고급 스캘핑 지표입니다. 잘못된 신호를 크게 줄이면서 성공 가능성이 더 높은 Buy/Sell 거래 기회를 식별하는 데 도움을 줍니다. 명확한 Buy 및 Sell 화살표가 차트에 직접 표시되며, ATR 기반 Stop Loss 및 Take Profit 레벨도 실시간으로 자동 계산됩니다. 구매 후 MQL5 메시지로 저에게 연락하시면 SuperScalp Pro Auto Trader EA를 무료로 받으실 수 있으며, 사용자 가이드와 비공개 그룹 이용 권한도 제공됩니다. XAUUSD M1 고빈도 스캘핑 실거래 결과: [Live Trading] 권장 설정 파일 다운로드: [Set File] 전체 문서는 제품 블로그에서 확인할 수 있습니다: [User Guide] 업데
Entry Points Pro for MT5
Yury Orlov
4.54 (156)
Entry Points Pro는 주문을 넣기 전에 어디에서 진입하고, 스탑을 어디에 두고, 어떤 랏으로 거래할지 보여 줍니다. 가격 지금 199 USD이며, 이 가격으로는 4카피입니다. 이후 가격은 249 USD, 최종 가격은 349 USD입니다. 저는 시장에서 트레이딩으로 돈을 벌고 그것을 보여 드립니다. 그래서 이 인디케이터를 모두에게 팔 필요가 없습니다. 스스로 생각하는 트레이더를 위한 도구이지, 마법 버튼이 아닙니다. 돌파가 없으면 거래도 없습니다. 회색 화살표는 취소된 신호입니다. 가격이 신호 캔들을 돌파하지 못했으므로 진입도 손실도 없습니다. 화살표는 캔들이 마감될 때 나타나며 리페인팅되지 않습니다. 설정은 두 가지: 예치금과 거래당 리스크. 결제 전에 확인하세요: 무료 데모는 MT5 전략 테스터에서 작동하며 2분이면 됩니다. 구매 후에는 제가 직접 설정을 도와 드리겠습니다. 2019년, 저는 이 지표가 무엇을 할 수 있는지 전 세계에 보여 주었습니다. 실계좌에서 지표의
Gann Made Easy MT5
Oleg Rodin
5 (14)
Gann Made Easy 는 mr.의 이론을 사용하여 최고의 거래 원칙을 기반으로 하는 전문적이고 사용하기 쉬운 Forex 거래 시스템입니다. W.D. 간. 이 표시기는 Stop Loss 및 Take Profit Levels를 포함하여 정확한 BUY 및 SELL 신호를 제공합니다. PUSH 알림을 사용하여 이동 중에도 거래할 수 있습니다. 구매 후 거래 방법 안내 및 유용한 추가 지표를 무료로 받으시려면 저에게 연락주세요! 아마도 Gann 거래 방법에 대해 이미 여러 번 들었을 것입니다. 일반적으로 Gann의 이론은 초보자 거래자뿐만 아니라 이미 거래 경험이 있는 사람들에게도 매우 복잡한 것입니다. Gann의 거래 방식은 이론적으로 적용하기 쉽지 않기 때문입니다. 나는 그 지식을 연마하고 Forex 지표에 최고의 원칙을 적용하기 위해 몇 년을 보냈습니다. 표시기는 적용하기가 매우 쉽습니다. 차트에 첨부하고 간단한 거래 권장 사항을 따르기만 하면 됩니다. 지표는 지속적으로 시장 분석
Ultra Indicator
Ihor Otkydach
5 (1)
ULTRA는 “올인원” 방식으로 작동하는 기술적 지표로, 시장을 독자적으로 분석하고, 매매 신호를 생성하며, 손절매 주문 설정 수준을 표시하고, 이익을 실현하거나 손실을 최소화하기 위해 포지션을 청산해야 할 시점을 제안합니다. 다시 말해, 시장을 분석하는 법을 모르거나, 가격 수준(손절매를 어디에 설정할지)을 파악하지 못하거나, 자금 관리에 어려움을 겪더라도 상관없습니다. ULTRA가 그 모든 것을 대신 해줄 테니까요! 구매자 특전 : ULTRA 지표를 구매하신 후, 저에게 비공개 메시지를 보내주시면 “ULTRA BOT”을 무료 선물로 드립니다. 이 도구는 해당 지표의 신호를 바탕으로 개설한 거래를 관리하는 데 도움을 주는 특별한 도구입니다(각 거래에 대해 손절매를 설정하고, 최상의 결과를 얻을 수 있도록 전략의 규칙에 따라 거래를 자동으로 청산해 줍니다).  또한 구매자분들께 다양한 자산에 바로 적용할 수 있는 설정값을 제공해 드리고 있으며, 이를 통해 지표가 최대 효율로 작동할
통화 강도 마법사는 성공적인 거래를 위한 올인원 솔루션을 제공하는 매우 강력한 지표입니다. 표시기는 여러 시간 프레임의 모든 통화 데이터를 사용하여 이 또는 해당 외환 쌍의 힘을 계산합니다. 이 데이터는 특정 통화의 힘을 확인하는 데 사용할 수 있는 사용하기 쉬운 통화 지수 및 통화 전력선의 형태로 표시됩니다. 필요한 것은 거래하려는 차트에 표시기를 부착하는 것뿐입니다. 표시기는 거래하는 통화의 실제 강세를 보여줍니다. 지표는 또한 추세와 거래할 때 유리하게 사용할 수 있는 구매 및 판매 거래량 압력의 극한값을 보여줍니다. 지표는 또한 피보나치에 기반한 가능한 대상을 보여줍니다. 표시기는 PUSH 알림을 포함한 모든 유형의 알림을 제공합니다. 구매 후 연락주세요. 나는 당신과 거래 팁을 공유하고 당신에게 무료로 훌륭한 보너스 지표를 줄 것입니다! 나는 당신에게 행복하고 유익한 거래를 기원합니다!
Auto Optimized SpeedAngle 은 지속적인 워크포워드 최적화(Walk-Forward Optimization, WFO)를 통해 곡선 적합(curve-fitting)을 제거한 기관 수준의 모멘텀 벡터화 시스템입니다. 시장 체제가 바뀔 때 성능이 떨어지는 정적 입력에 의존하는 대신, 이 지표는 표본 외(Out-of-Sample, OOS) 검증을 사용하여 매개변수를 동적으로 재보정하며, 표시되는 신호가 과거의 우연이 아닌 진정한 통계적 우위를 나타내도록 보장합니다. 핵심 기관용 프레임워크 워크포워드 최적화 엔진: 핵심 알고리즘은 수천 가지의 룩백(lookback) 및 임계값 조합을 지속적으로 스캔하며, 데이터를 인샘플(in-sample)과 표본 외(out-of-sample) 세트로 엄격하게 분리합니다. 미지의 데이터 환경에서 수학적 우수성이 증명된 경우에만 새로운 매개변수 구성을 채택합니다. 정량적 목적 함수: 순수한 총이익을 쫓는 대신, 최적화 엔진은 기관 수준의 안정성
Dynamic Forex28 Navigator MT5
Bernhard Schweigert
5 (1)
다중 통화 강도 및 모멘텀 지표 MT5 Dynamic Forex28 Navigator는 오랫동안 사랑받아 온 인기 지표들의 진화형으로, 다섯 가지의 힘을 하나로 결합했습니다. Advanced Currency Strength28 Indicator (리뷰 700개) Advanced Currency IMPULSE with ALERT (리뷰 530개) Currency Strength EXOTICS GOLD Impulse with Alert CS28 Combo Signals (최근 보너스) 지표 네 개를 따로 구매해 차트에 겹쳐 놓을 필요가 없습니다. 28개 Forex 페어의 강도, 이를 이끄는 시장의 모멘텀, 그리고 두 가지 모두의 알림이 하나의 강력한 지표로 통합되어 한 창, 한 차트에서 확인할 수 있습니다. 위 프로그램들은 MQL5 Market에서 1,200개 이상의 리뷰를 받았으며 2016년부터 MT4 커뮤니티의 필수 지표로 자리잡았습니다. Dynamic Forex28 Navigato
M1 Sniper MT5
Oleg Rodin
5 (7)
M1 SNIPER 는 사용하기 쉬운 거래 지표 시스템입니다. M1 시간대에 맞춰 설계된 화살표 지표입니다. 이 지표는 M1 시간대 스캘핑을 위한 단독 시스템으로 사용할 수 있으며, 기존 거래 시스템의 일부로도 사용할 수 있습니다. 이 거래 시스템은 M1 시간대 거래용으로 특별히 설계되었지만, 다른 시간대에도 사용할 수 있습니다. 원래는 XAUUSD와 BTCUSD 거래를 위해 이 방법을 설계했지만, 다른 시장 거래에도 유용하다는 것을 알게 되었습니다. 이 지표의 신호는 추세 방향과 반대로 거래될 수 있습니다. 저는 지표의 신호를 활용하여 양방향으로 거래할 수 있도록 돕는 특별한 거래 기법을 알려드립니다. 이 방법은 특별한 동적 지지선과 저항선 가격 영역을 활용하는 것을 기반으로 합니다. 구매하시면 M1 SNIPER 화살표 지표를 바로 다운로드하실 수 있습니다. 또한, 아래 스크린샷에 표시된 Apollo Dynamic SR 지표는 M1 SNIPER 도구를 사용하는 모든 사용자에게 무료로
다음 업데이트 — 버전 2.52 곧 출시! [신규] 시장 분석 및 트레이딩 워크플로를 향상시키기 위해 설계된 4가지 주요 신규 기능을 기대해 주세요. 트레이딩 요구 사항을 충족하도록 설계된 4가지 새로운 기능으로 시장 분석을 한 단계 더 발전시킵니다. 다음 기능을 소개합니다: 1. TRADE OVERVIEW DASHBOARD 2. CONFLUENCE AT ZONE 3. STRONG & WEAK HIGH/LOW 4. OTE 1. TRADE OVERVIEW DASHBOARD 시장 전체 상황을 더 쉽게 파악할 수 있도록 도와주는 대시보드입니다. 트레이딩 의사결정을 지원하는 가이드를 제공하며, 하나의 화면에서 시장을 분석하고 체계적으로 트레이딩을 계획할 수 있도록 도와줍니다. 멀티 타임프레임 시장 개요 (Multi-Timeframe Market Overview) 시장 방향과 가격 구조를 더욱 명확하게 파악 시장 상황을 빠르게 확인 체계적인 시장 분석 및 진입 계획을 위한 가이드 2. CO
FX Power MT5 NG
Daniel Stein
5 (33)
FX Power: 통화 강세 분석으로 더 스마트한 거래 결정을 개요 FX Power 는 어떤 시장 상황에서도 주요 통화와 금의 실제 강세를 이해하기 위한 필수 도구입니다. 강한 통화를 매수하고 약한 통화를 매도함으로써 FX Power 는 거래 결정을 단순화하고 높은 확률의 기회를 발견합니다. 트렌드를 따르거나 극단적인 델타 값을 사용해 반전을 예측하고자 한다면, 이 도구는 귀하의 거래 스타일에 완벽히 적응합니다. 단순히 거래하지 말고, FX Power 로 더 스마트하게 거래하세요. 1. FX Power가 거래자에게 매우 유용한 이유 통화와 금의 실시간 강세 분석 • FX Power 는 주요 통화와 금의 상대적 강세를 계산하고 표시하여 시장 역학에 대한 명확한 통찰력을 제공합니다. • 어떤 자산이 앞서고 있고 어떤 자산이 뒤처지는지 모니터링하여 보다 현명한 거래 결정을 내릴 수 있습니다. 포괄적인 멀티 타임프레임 뷰 • 단기, 중기 및 장기 타임프레임에서 통화와 금의 강세를
Azimuth Pro
Ottaviano De Cicco
5 (7)
Azimuth Pro V2: Synthetic Fractal Structure and Confirmed Entries for MT5 Overview Azimuth Pro is a multi-level swing structure indicator by Merkava Labs . Four nested swing layers, swing-anchored VWAP, ABC pattern detection, three-timeframe structural filtering, and closed-bar confirmed entries — one chart, one workflow from micro-swings to macro-cycles. This is not a blind signal product. It is a structure-first workflow for traders who care about location, context, and timing. 1. What Change
Boba Analysis Suite
Trade Ready Solutions LLC
5 (2)
Boba Analysis Suite Boba Analysis Suite는 MetaTrader 5용 분석 지표입니다. 시장 구조, 주요 가격 영역, 전반적인 시장 상황을 하나의 차트 화면에 통합하여 표시합니다. 트레이더이자 트레이딩 코치로서의 실무 경험을 바탕으로 개발되었으며, 시장 방향 평가, 주요 가격 수준 식별, 여러 시간대의 종합적인 분석 등 체계적인 분석 과정을 지원합니다. 시장 맥락을 고려한 분석 개별 신호의 의미는 시장 상황에 따라 달라집니다. Boba Analysis Suite는 현재 차트 상황을 더 넓은 시장 구조와 연결하고, 사전에 정한 규칙에 따라 매매 아이디어를 검토할 수 있도록 돕습니다. 주요 분석 기능은 다음과 같습니다. 추세 및 시장 구조: 시장 방향과 관련 구조적 맥락을 평가합니다. 주요 가격 영역 및 수준: 추가 분석이 필요한 중요한 영역을 차트에 시각적으로 표시합니다. 여러 시간대: 서로 다른 시간대의 정보를 통합하여 전반적인 시장 상황을 평가합니다.
Gold Sniper Scalper Pro
Ich Khiem Nguyen
3.9 (10)
Gold Sniper Scalper Pro는 XAUUSD에서 허위 돌파 (false breakout) 패턴을 감지하기 위해 특별히 설계된 MetaTrader 5 지표입니다. 가격이 레인지 경계를 돌파하여 돌파 트레이더를 유인한 후 반전하는 4봉 트랩 구조를 식별합니다. 지표는 각 셋업을 17개 품질 요소로 평가하고, 4계층 합류 파이프라인을 통해 처리하며, 7타임프레임 추세 합의 엔진으로 검증하고, 금 변동성 상태 분류기로 필터링합니다. 이 모든 과정이 신호가 차트에 표시되기 전에 완료됩니다. 자세한 사용자 가이드는 작성자의   MQL5 블로그 에서 확인할 수 있습니다. 추가 업데이트는 작성자의   MQL5 채널 을 통해 제공됩니다. 현재 지원 정책에 따라 구매자는 저자가 개발한 선별된 보조 도구에 대한 추가 접근 권한을 받을 수 있습니다. Forex 쌍, 지수 및 암호화폐에서도 작동하지만, 감지 매개변수, 변동성 처리 및 필터 로직은 XAUUSD 특성에 최적화되어 있습니다.
Naked Forex Tweezer Pro Indicator Tweezer Pro Indicator is a pattern recognition indicator for Forex, Stocks, Indices, Futures, Commodities and Cryptos. The standard Tweezer is a two bar pattern. Our enhanced version is a multi-bar pattern. We filter the patterns for you so that you only get the     best and most effective patterns   and ignore the noise. The Tweezer pattern is a simple and effective pattern to trade. The strategy that comes with the Tweezer is based on price action. The Twe
Power Candles MT5
Daniel Stein
4.58 (12)
Power Candles V3 - 자체 최적화 강도 지표 파워 캔들 V3는 적용된 모든 차트에서 통화 및 상품의 강세를 실행 가능한 거래 계획으로 전환합니다. 단순히 캔들에 색상을 입히는 대신, 백그라운드에서 실시간 자동 최적화를 수행하여 현재 보고 있는 종목에 대한 최적의 손절매, 익절 및 신호 임계값을 제공합니다. 한 번의 클릭으로 실시간 거래에 적용할 수 있으며, 진입점, 손절매 및 익절 선이 정확한 가격에 맞춰 차트에 표시되고, 방향과 함께 알림이 발령됩니다. 이 도구는 Stein Investments 에코시스템의 일부입니다. 18개 이상의 도구와 함께 당신의 1대1 AI 트레이딩 멘토 Max.  항상 대기 중, 모든 인디케이터를 깊이 있게 이해, 무언가를 차근차근 생각해보고 싶은 순간에 도움을 줍니다.  https://stein.investments 에서 만나보세요 매 종가 바마다 3,000회 이상의 트레이딩 시뮬레이션. 9가지 강도 상태. 2가지 전략을 병렬로 테스트.
FX Levels Premium indicator for MT5
Renaud Herve Francois Candel
Fx Levels Premium Indicator Support and Resistance are important concepts in trading. Fx Levels Premium was created to easily draw important levels of support and resistance for the active trader. The indicator will give you all important levels (support/resistance) to watch for a wide range of assets. Trading without these levels on your chart is like driving a car for a long journey without a roadmap. You would be confused and blind. Support and resistance levels should be used as guideline
OrderFlux – MetaTrader 5용 Order Flow Footprint Chart, Volume Profile 및 Market Profile 지표 OrderFlux는 MetaTrader 5용 오더 플로우 Footprint 지표로, 각 캔들 내부에서 실제로 어떤 거래가 발생하는지 명확하게 보여줍니다. 개별 캔들을 펼쳐 각 가격 수준에서 체결된 거래량을 표시하고, 공격적인 매도와 공격적인 매수를 구분합니다. 틱 데이터를 기반으로 실시간 Footprint 차트를 구성하며, Delta, Imbalance, Absorption, Volume Profile, Market Profile(TPO), VWAP, Cumulative Delta(CVD), DOM 탭 및 경제 캘린더를 하나의 정돈되고 읽기 쉬운 인터페이스에 통합합니다. 일반적인 차트는 시가, 고가, 저가, 종가만 보여줍니다. 이는 가격 움직임의 결과이지 원인은 아닙니다. OrderFlux는 오더 플로우 트레이딩의 핵심 질문에
Meridian Pro
Ottaviano De Cicco
4 (3)
Meridian Pro 2.00: Professional Multi-Timeframe Trend Matrix for MT5 Meridian Pro 2.00 is a professional adaptive trend matrix for MetaTrader 5. It combines the original Meridian trend engine, a clean chart ribbon, closed-bar signal arrows, an 8-timeframe dashboard, Fuel momentum, weighted consensus, synthetic HTF processing and chart-native higher-timeframe context lines. The goal is simple: read current trend, multi-timeframe structure, strength, momentum and EA-ready state from one discipline
PZ Swing Trading MT5
PZ TRADING SLU
5 (5)
Protect against whipsaws: revolutionize your swing trading approach Swing Trading is the first indicator designed to detect swings in the direction of the trend and possible reversal swings. It uses the baseline swing trading approach, widely described in trading literature. The indicator studies several price and time vectors to track the aggregate trend direction and detects situations in which the market is oversold or overbought and ready to correct. [ Installation Guide | Update Guide | Tro
Crystal Heikin Ashi Signals
Muhammad Jawad Shabir
5 (6)
Crystal Heikin Ashi Signals—Professional Trend & Signal Detection Indicator Advanced Heikin Ashi Visualization with Intelligent Signal System for Manual & Automated Trading Final Price: $149 ---------> Price goes up $10 after every 10 sales . Limited slots available — act fast . Overview User Guide PDF Crystal Heikin Ashi Signals is a professional-grade MetaTrader 5 indicator that combines pure Heikin Ashi candle visualization with an advanced momentum-shift detection system. Designed for both m
Apollo SR Master는 지지/저항 구간에서의 거래를 더욱 쉽고 안정적으로 만들어 주는 특수 기능을 갖춘 지지/저항 지표입니다. 이 지표는 지역 가격의 고점과 저점을 감지하여 시간 지연 없이 실시간으로 지지/저항 구간을 계산합니다. 새롭게 형성된 저항 구간을 확인하기 위해 지표는 해당 저항 구간을 실제 매도 또는 매수 신호로 활용할 수 있음을 나타내는 특수 신호를 표시합니다. 이 경우, 저항 구간의 강도가 높아지고, 따라서 저항 구간에서의 성공적인 거래 가능성도 높아집니다. 이것이 바로 이 지표의 핵심 아이디어입니다. SR 존은 손절매와 이익실현을 더욱 쉽게 할 수 있도록 해줍니다. 신호 방향에 따라 SR 존 위 또는 아래 공간을 손절매로 활용할 수 있습니다. 또한, 반대쪽 SR 존은 잠재적 이익실현 영역으로 활용할 수 있습니다. 또한 Apollo SR Master 지표를 사용하는 모든 사용자에게 "Apollo Price Action System" 지표를 무료로 제공합니다.
FX Trend MT5 NG
Daniel Stein
5 (6)
FX Trend NG: 차세대 멀티 마켓 트렌드 인텔리전스 개요 FX Trend NG 는 다중 시간 프레임 기반의 전문 트렌드 분석 및 시장 모니터링 도구입니다. 몇 초 만에 전체 시장 구조를 파악할 수 있도록 설계되었습니다. 여러 차트를 일일이 전환할 필요 없이, 어떤 종목이 추세에 있는지, 어디에서 모멘텀이 약화되고 있는지, 그리고 어떤 시간 프레임이 서로 정렬되어 있는지 즉시 확인할 수 있습니다. 출시 기념 특별 혜택 – FX Trend NG 를 $30 (6개월) 또는 $80 평생 라이선스 로 이용할 수 있습니다. 이미 Stein Investments 고객이신가요? -> 메시지를 보내 전용 고객 그룹에 참여하세요. 설정이나 사용 방법이 필요하신가요? -> Stein Investments 공식 페이지 를 방문하세요. 1. FX Trend NG가 특별한 이유 3단계 추세 로직 – 단순한 Buy / Sell이 아닙니다 • 대부분의 지표는 Buy 또는 Sell 두 가지 상태만 제
Neuro Poseidon MT5
Daria Rezueva
4.68 (53)
Neuro Poseidon is a new indicator by Daria Rezueva. It combines precise trading signals with adaptive TP/SL levels - creating best possible trades as a result! Message me and get  Neuro Poseidon Assistant  as a gift to automize your trading process! What makes it stand out? 1. Proven profitability on all assets and timeframes 2. Only confirmed BUY and SELL signals present on the chart 3. Adaptive TP & SL levels generated by the software for each trade 4. Easy to understand - suitable for al
Trend Lines PRO MT5
Roman Podpora
5 (1)
트렌드 라인즈 프로       이 지표는 시장이 실제로 어떤 방향으로 전환되는지 파악하는 데 도움이 됩니다. 실제 추세 반전 지점과 주요 시장 참여자들이 다시 진입하는 지점을 보여줍니다. 보시다시피       BOS 라인       복잡한 설정이나 불필요한 노이즈 없이 더 높은 시간대의 추세 변화와 주요 레벨을 확인할 수 있습니다. 신호는 차트에 다시 그려지지 않고 캔들이 마감된 후에도 계속 표시됩니다. VERSION MT 4   -   RFI LEVELS PRO   표시기   와 결합할 때 최대 잠재력을 발휘합니다. 지표가 보여주는 내용: 실제 변화       추세(BOS 라인) 한 번 신호가 나타나면 그 신호는 계속 유효합니다! 이는 신호를 발생시킨 후 변경될 수 있는 리페인팅 방식의 지표와 중요한 차이점입니다. 리페인팅 방식의 지표는 잠재적으로 자금 손실로 이어질 수 있습니다. 이제 더욱 높은 확률과 정확도로 시장에 진입할 수 있습니다. 또한 화살표가 나타난 후 목표가(익절)
Murrey Math Classic
Sarvarbek Abduvoxobov
5 (2)
Murrey Math Classic Murrey Math Classic 은 금융 시장의 가격 변동을 수학적 정밀함으로 예측하도록 설계된 전문적이고 역동적인 트레이딩 지표입니다. 이 시스템은 전설적인 가격-시간 기하학을 현대화하여 현대 금융 시장에 적합한 고도로 구조화된 수학적 모델로 변환했습니다. 머레이 수학(Murrey Math)의 핵심 논리는 금융 시장이 무작위로 움직이지 않고 특정 리듬에 따라 움직인다는 것입니다. 음악이 한 옥타브의 8개 음으로 나뉘는 것처럼, 주어진 가격 범위는 0/8부터 8/8까지 8개의 동일한 수학적 레벨로 나뉩니다. 이 선들은 숨겨져 있고 신뢰도가 높은 지지 및 저항 영역으로 작용하여, 가격이 도달하기도 전에 잠재적 반전 지점을 드러내 줍니다. Code2Profit 채널 지표 작동 방식 | 전체 전략 개요 궁극의 다중 확인 진입 전략 설명 Murrey Math Classic이 기존 지표보다 우수한 이유 Murrey Math Classic:
Non repaint MT5
Yan Zhen Du
5 (1)
This is a professional chart indicator designed for traders focused on stability and clear price action. It helps filter market noise and provides clear visual entry and exit zones for your trading decisions. Price Information: The current price is promotional and is subject to change as upcoming updates and new features are released. MQL5 public channel:  CLICK HERE for MT4:  Non-repainting MT4 version Core Features: Strictly Non-Repainting:   The system is built with strict non-repaint logic.
Bill Williams Advanced
Siarhei Vashchylka
5 (11)
Bill Williams Advanced is designed for automatic chart analysis using Bill Williams' "Profitunity" system. The indicator analyzes four timeframes at once. Manual (Be sure to read before purchasing) Advantages 1. Analyzes the chart using Bill Williams' "Profitunity" system. Signals are displayed in a table in the corner of the screen and on the price chart. 2. Finds all known AO and AC signals, as well as zone signals. Equipped with a trend filter based on the Alligator. 3. Finds "Divergence Bar
Advanced Supply Demand MT5
Bernhard Schweigert
4.53 (15)
현재 33% 할인! 초보자나 전문 트레이더를 위한 최고의 솔루션! 이 보조지표는 우리가 다수의 독창적 기능과 새로운 공식을 통합한 독특하고 고품질이며 저렴한 거래 도구입니다. 이 업데이트를 통해 이중 시간대를 표시할 수 있습니다. 더 높은 TF를 표시할 수 있을 뿐만 아니라 차트 TF와 더 높은 TF 모두를 표시할 수 있습니다: 중첩 영역 표시. 모든 Supply Demand 트레이더들이 좋아할 것입니다. :) 중요한 정보 공개 Advanced Supply Demand의 잠재력을 극대화하려면 다음을 방문하십시오. https://www.mql5.com/ko/blogs/post/720245   진입 또는 목표의 명확한 트리거 포인트를 정확히 찾아냄으로 해서 거래가 어떻게 개선될지 상상해 보십시오. 새로운 알고리즘을 기반으로 매수자와 매도자 간의 잠재적인 불균형을 훨씬 더 쉽게 분간할 수 있습니다. 왜냐하면 가장 강한 공급영역과 가장 강한 수요 영역과 과거에 어떻게 진행 되었는지를(이전
TPA True Price Action indicator reveals the true price action of the market makers through 100% non-repainting signals strictly at the close of a candle! TPA shows entries and re-entries, every time the bulls are definitely stronger than the bears and vice versa. Not to confuse with red/green candles. The shift of power gets confirmed at the earliest stage and is ONE exit strategy of several. There are available now two free parts of the TPA User Guide for our customers. The first "The Basics"
제작자의 제품 더 보기
SMC Visual indicator MT4
Gabriel Balbino De Oliveira
SMC Visual Indicator – Trade Like Smart Money Most traders spend hours trying to identify market structure, liquidity zones, Fair Value Gaps, and potential reversals. By the time they finish their analysis, the market has already moved. SMC Visual Indicator v6 does the hard work for you. Built around advanced Smart Money Concepts (SMC) and ICT methodologies, this indicator automatically identifies the key areas where institutional traders leave their footprints. Imagine opening your chart and in
Price Action Alpha Pro MT4
Gabriel Balbino De Oliveira
PRICE ACTION PRO v4. 90 — The Smart Chart Pattern Scanner for MetaTrader 4 Transform how you analyze the market with Price Action Pro v4. 90, the most advanced version of this powerful indicator that automatically detects key chart patterns and trend reversal or continuation signals in real time. Forget spending hours analyzing charts manually. Price Action Pro continuously scans the market and highlights high-probability opportunities directly on your chart — now featuring context validation
AlphaTrend Pullback Pro mt4
Gabriel Balbino De Oliveira
AlphaTrend Pullback Pro MT4 Trend-following pullback signals, economic news filter, and professional dashboard — all in one indicator. AlphaTrend Pullback Pro transforms trend and correction analysis into clear, actionable visual signals. It identifies the macro market direction on a higher timeframe, waits for a pullback to the moving average, confirms rejection with a trend-aligned close, and triggers the entry point. No repainting on closed bars, no noise, no complexity. Why AlphaTrend Pullba
Correlation Radar pro MT4
Gabriel Balbino De Oliveira
Correlation Radar PRO — Multi-Asset Correlation Dashboard for MetaTrader 4 Short Description: Eliminate market noise and spot price divergences in seconds. Correlation Radar PRO calculates historical, monthly, weekly, and real-time correlations across multiple assets and lets you overlay candles directly on your chart without switching your main symbol. Full Description: Manually switching charts to understand inter-market relationships wastes precious time and leads to missed setups. Correlatio
NexusFlow MTF Pro MT4
Gabriel Balbino De Oliveira
NexusFlow MTF Pro MT4 — The Ultimate Multi-Timeframe Power for MetaTrader 4 Tired of trading on the M5 or M15 timeframe only to realize too late that the H1 or H4 trend was completely against your entry? Lost count of how many times you had to open multiple windows, constantly switch charts, or clutter your screen with confusing indicators just to align the market direction? NexusFlow MTF Pro MT4 was engineered specifically to eliminate this operational friction and elevate your flow and trend a
TriSync MT4
Gabriel Balbino De Oliveira
TriSync User Manual Market Structure Indicator for MetaTrader 4 · Version 0.40 1. What It Is TriSync shows market structure in layers on a single chart: four nested swing levels, VWAP anchored to swing highs and lows, Daily VWAP, higher-timeframe support and resistance, three-timeframe bias, and confirmed entry arrows on closed bars. The core idea is a reading order: Location first. Context second. Timing last. The arrow is step 3, never step 1. What it is not: it is not a robot, not a blind sig
QuantVortex Gold Alpha V13
Gabriel Balbino De Oliveira
QUANT VORTEX ELITE V13 — The XAUUSD (Gold) Specialist QuantVortex Elite V13 is a high-performance algorithmic trading framework specifically engineered for XAUUSD (Gold) on the M30 (Highly Optimized) and H1 timeframes. Developed for professional traders, asset managers, and prop firm evaluators, this advanced automated system combines the precision of multi-period momentum analysis with a proprietary structural filtering architecture named the Luminus Engine . Unlike common grid or martingale
Luminus Gold Pro
Gabriel Balbino De Oliveira
Luminus PRO – High-Performance Quantitative Algorithm Luminus PRO is a fully automated Expert Advisor (EA) engineered for traders and investors seeking institutional consistency and mathematical precision in global financial markets. By combining macro trend tracking with dynamic volatility layers, this EA executes trades surgically, maximizing profit potential while keeping risk under strict control. Forget strategies that rely on luck. Luminus PRO is built purely on statistical data and ra
Luminus Market Regime PRO
Gabriel Balbino De Oliveira
Luminus Market Regime PRO — Know WHAT the Market Is Before You Trade Stop trading setups in the wrong context. The Luminus Market Regime PRO tells you exactly what the market is doing — before you place a single order. The Problem Every Trader Faces Most indicators answer "where is price going?" The Luminus Market Regime PRO answers the more important question: "Is it worth trading right now?" Losses come not from bad signals — but from trading a good signal in the wrong market environment.
Nexus Prime AIO
Gabriel Balbino De Oliveira
Nexus Quantum AIO – Your Ultimate Trading GPS Tired of messy charts and confusing signals? Most traders fail because they operate in the dark, guessing where the price will go. Nexus Quantum AIO is a complete visual decision-making system. It takes complex institutional calculations and translates them into simple colors and signals on your screen. What does it do for you? The Market Traffic Light: It colors your candles and background. Green (Strong Uptrend), Red (Strong Downtrend), and Gray (S
SupResAI Market Pro
Gabriel Balbino De Oliveira
Elevate your trading to an institutional level. SupRes AI v7 is the ultimate all-in-one indicator for MetaTrader 5, engineered to map the market in real-time with mathematical precision. Say goodbye to time-consuming manual analysis; this dashboard centralizes everything you need for fast, profitable execution directly on your chart. Key Features: Dynamic Support & Resistance: Advanced algorithm that identifies and clusters high-relevance price zones, featuring a retest counter (level strength
SMC Visual indicator
Gabriel Balbino De Oliveira
SMC Visual Indicator v6 – Trade Like Smart Money Most traders spend hours trying to identify market structure, liquidity zones, Fair Value Gaps, and potential reversals. By the time they finish their analysis, the market has already moved. SMC Visual Indicator v6 does the hard work for you. Built around advanced Smart Money Concepts (SMC) and ICT methodologies, this indicator automatically identifies the key areas where institutional traders leave their footprints. Imagine opening your chart and
UpPulse
Gabriel Balbino De Oliveira
UpPulse Gaussian Signal – Master Trends with Mathematical Precision Are you tired of false breakouts and lagging indicators that get you into trades when the move is already over? Discover UpPulse Gaussian Signal , a high-performance indicator for MetaTrader 5 (MT5) engineered for traders who demand surgical precision and statistical validation before risking capital. UpPulse combines the advanced smoothing power of a Gaussian Filter (ALMA Core) with the institutional momentum tracking of the AD
Price Action Alpha Pro
Gabriel Balbino De Oliveira
PRICE ACTION PRO v4. 90 — The Smart Chart Pattern Scanner for MetaTrader 4 Transform how you analyze the market with Price Action Pro v4. 90, the most advanced version of this powerful indicator that automatically detects key chart patterns and trend reversal or continuation signals in real time. Forget spending hours analyzing charts manually. Price Action Pro continuously scans the market and highlights high-probability opportunities directly on your chart — now featuring context validation
AngleMeter Pro
Gabriel Balbino De Oliveira
Turn market slope into your greatest trading advantage! Tired of lagging and subjective indicators? AngleMeter Pro is here to revolutionize your chart analysis in MetaTrader 5. Powered by advanced trigonometry and statistical linear regression, it measures the exact trend angle in real time using a striking visual protractor with a continuous color gradient. Featuring dual-timeframe support for macro context analysis, dynamic bisection channels, an embedded normalized mini-chart, and an interact
AlphaTrend Pullback Pro
Gabriel Balbino De Oliveira
AlphaTrend Pullback Pro Trend-following pullback signals, economic news filter, and professional dashboard — all in one indicator. AlphaTrend Pullback Pro transforms trend and correction analysis into clear, actionable visual signals. It identifies the macro market direction on a higher timeframe, waits for a pullback to the moving average, confirms rejection with a trend-aligned close, and triggers the entry point. No repainting on closed bars, no noise, no complexity. Why AlphaTrend Pullbac
CorrelationRadarPRO
Gabriel Balbino De Oliveira
Correlation Radar PRO — Multi-Asset Correlation Dashboard for MetaTrader 5 Short Description: Eliminate market noise and spot price divergences in seconds. Correlation Radar PRO calculates historical, monthly, weekly, and real-time correlations across multiple assets and lets you overlay candles directly on your chart without switching your main symbol. Full Description: Manually switching charts to understand inter-market relationships wastes precious time and leads to missed setups. Correlatio
NexusFlow MTF Pro
Gabriel Balbino De Oliveira
[MT5] NexusFlow MTF Pro | Display up to 50 moving averages from higher time frames without switching time frames. Supports crossover alerts. NexusFlow MTF Pro is an MT5 indicator that allows you to overlay moving averages from any time frame—such as “daily,” “4-hour,” or “1-hour”—on your current chart. For example, while viewing a 30-minute chart, you can simultaneously check the 20-period MA on the daily chart or the 50-period MA on the 4-hour chart. This eliminates the need to open and compar
Sidus Pro
Gabriel Balbino De Oliveira
Sidus Pro for MetaTrader 5: The Ultimate Evolution of the Classic Sidus Method Turn your trend analysis into a true statistical edge. Sidus Pro reinvents the renowned moving average crossover and volatility channel method, combining mechanical precision, visual automation, and macroeconomic intelligence into a single professional interface. Forget amateur indicators that repaint past data or generate blind noise in sideways markets. Sidus Pro is engineered under rigorous MQL5 standards to delive
Puria Pro
Gabriel Balbino De Oliveira
PURIA METHOD PRO MT5 — The Ultimate Evolution of the Classic Puria Strategy Tired of lagging indicators, repainting arrows, or false signals that drain your account? Puria Method Pro was engineered for serious traders looking for surgical precision, visual automation, and robust trading logic. Built upon the world-renowned Puria Method (EMA 5 crossing the dual LWMA 75/85 Low channel) combined with a fast MACD (15, 26, 1) filter , this PRO edition turns a classic institutional strategy into a
TriConfluence Pro
Gabriel Balbino De Oliveira
TriConfluence Pro: The End of False Breakouts and Blind Speculation Tired of losing money to fake signals, lagging indicators, and choppy sideways markets? Most traders fail because they trade market noise instead of true price structure. TriConfluence Pro is built upon a rigorous triple-confluence methodology. It eliminates guesswork by combining three of the market's most powerful and respected tools— Bollinger Bands, RSI, and ADX —into a smart, automated dashboard right on your MetaTrader cha
필터:
리뷰 없음
리뷰 답변