TriSync

TriSync User Manual

Market Structure Indicator for MetaTrader 5 · Version 0.40

1. What It Is

TriSync shows market structure in layers on a single chart: four nested swing levels, VWAP anchored to swing highs and lows, Daily VWAP, higher-timeframe support and resistance, three-timeframe bias, and confirmed entry arrows on closed bars.

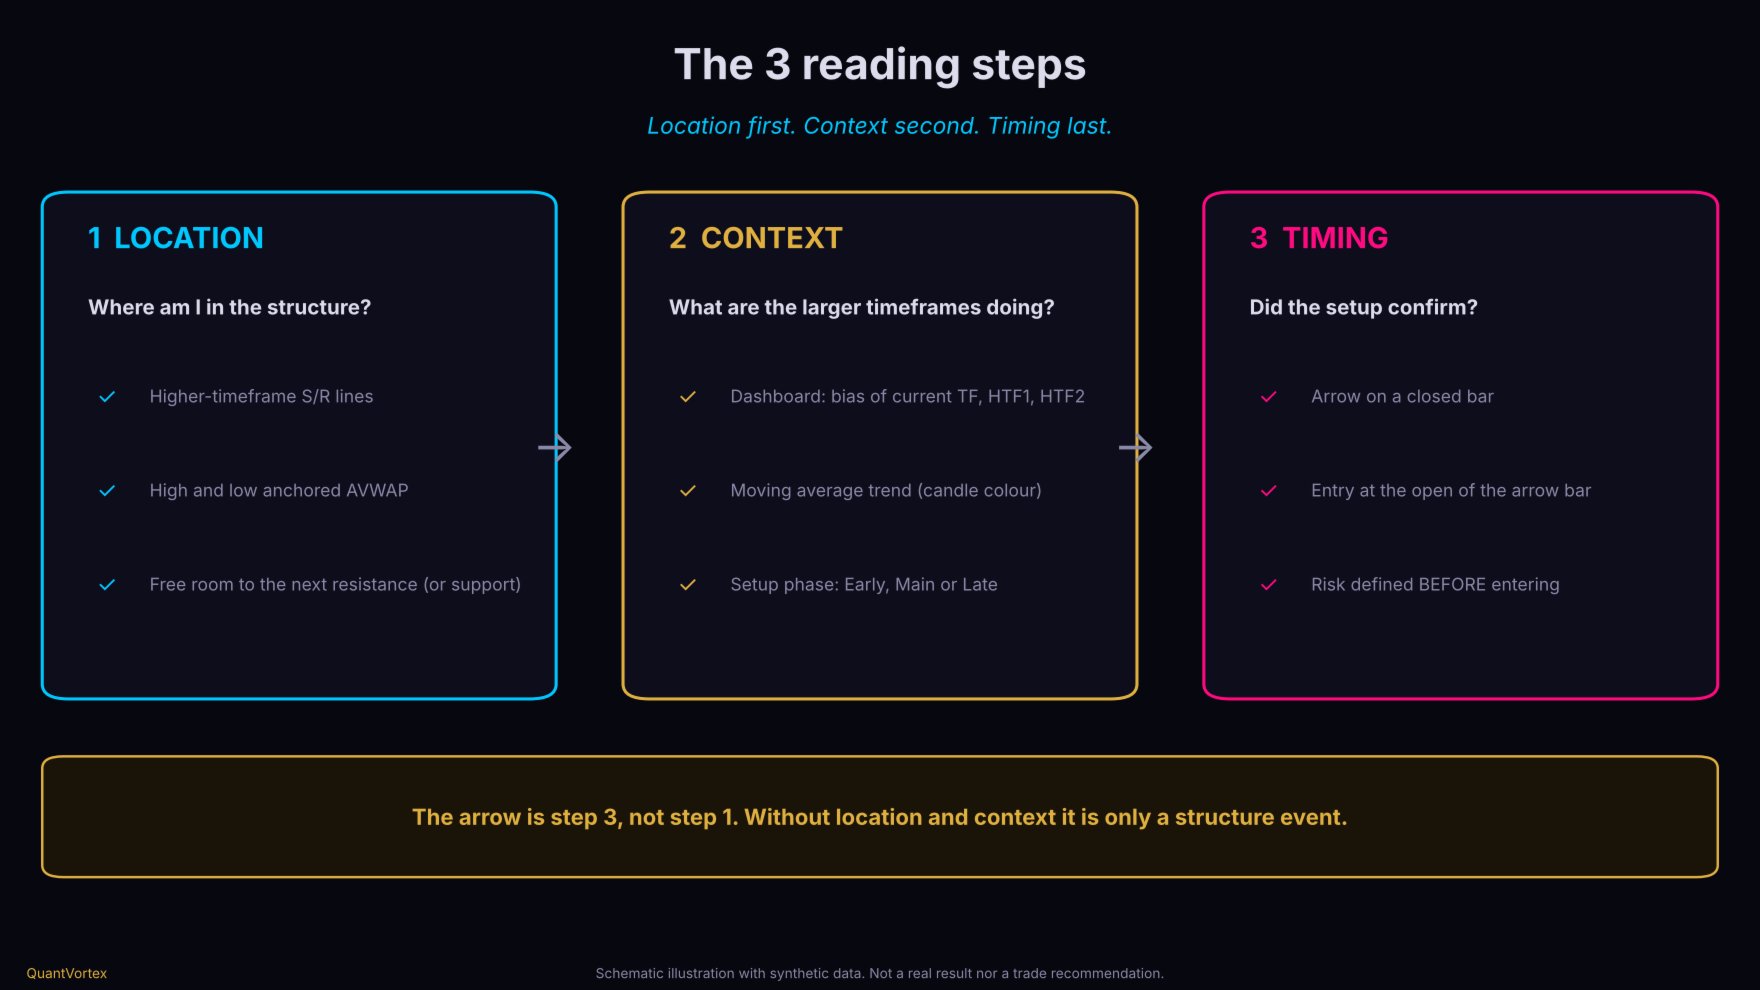
The core idea is a reading order: Location first. Context second. Timing last. The arrow is step 3, never step 1.

What it is not: it is not a robot, not a blind signal service, it does not send stop loss or take profit, and it does not promise results. It is a market-reading tool: it organizes the information, while the decision and risk remain entirely yours.2. The 3 Reading Steps (Figure 4)

  • Step 1 — Location. Where is price relative to structure? Look at higher-timeframe support and resistance lines, AVWAP, and the last swing high or low. A buy near support, with clear room to the next resistance, is very different from a buy stuck right against resistance.

  • Step 2 — Context. What are the higher timeframes doing? Read the dashboard: current TF bias, HTF1 and HTF2, the moving average trend color, and the setup phase (Early, Main, or Late).

  • Step 3 — Timing. Only after the first two steps, the arrow confirms that the setup has formed and a bar has closed in favor of the direction.

If steps 1 and 2 are not in favor, the arrow alone is not a reason to enter.

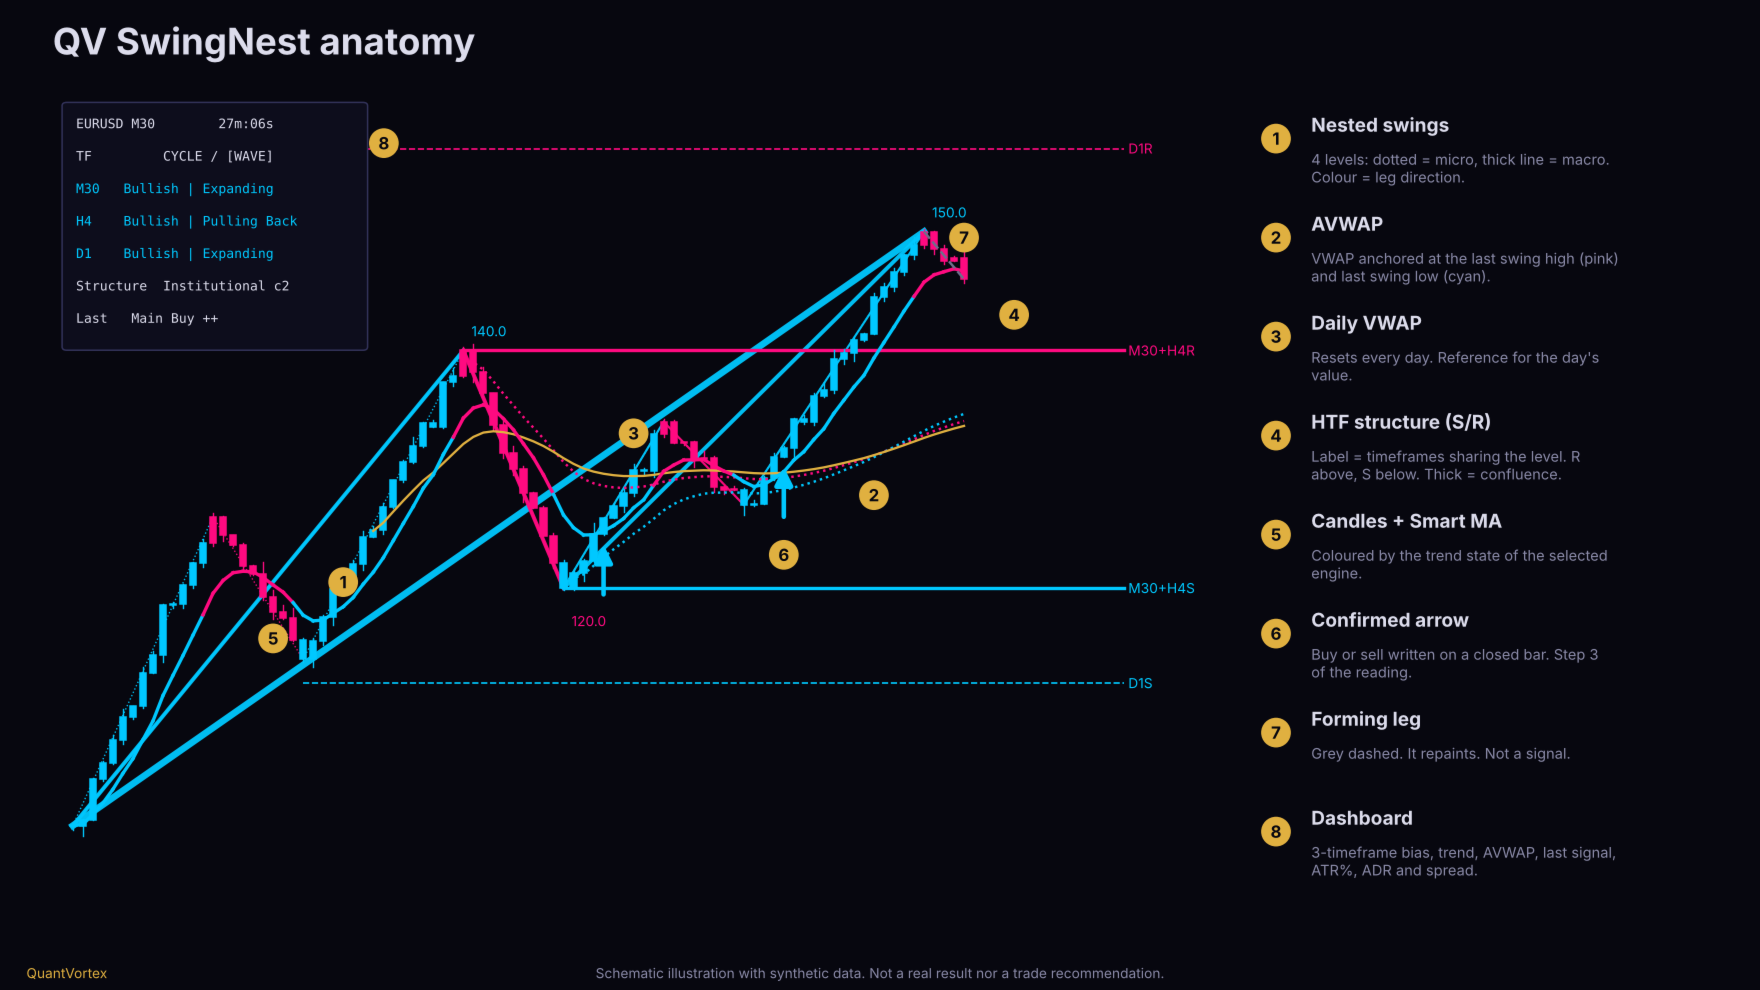
3. What You See on the Chart (Figure 1)

  • Nested Swings (4 levels): Level 1 is the minor structure (thin dotted line); levels 2, 3, and 4 move up to the macro (thicker lines). Levels 3 and 4 show the pivot price. Color indicates leg direction: cyan goes up, pink goes down (default theme).

  • Gray Dashed Leg: The forming leg, still unconfirmed. It moves with price and repaints. It is not a signal.

  • AVWAP (two dotted lines): One anchored to the last swing high (pink) and another to the last swing low (cyan), at the chosen level (default: level 3). Use as a value reference: where volume-weighted average price is since that pivot. Not a trigger.

  • Daily VWAP (gold line): VWAP that resets every day based on server time.

  • Higher-Timeframe Structure Lines: Horizontals labeled like M30+H4S : the timeframes sharing that level, followed by R (level above price, resistance) or S (level below price, support). Solid and thick lines mean confluence of 2 or more timeframes; dashed and thin means one. Nearby zones are automatically merged.

  • Colored Candles and Smart MA Line: Colored by the trend state of the chosen engine (cyan bullish, pink bearish, gray neutral).

  • Arrows: Up arrow below the candle: buy. Down arrow above the candle: sell.

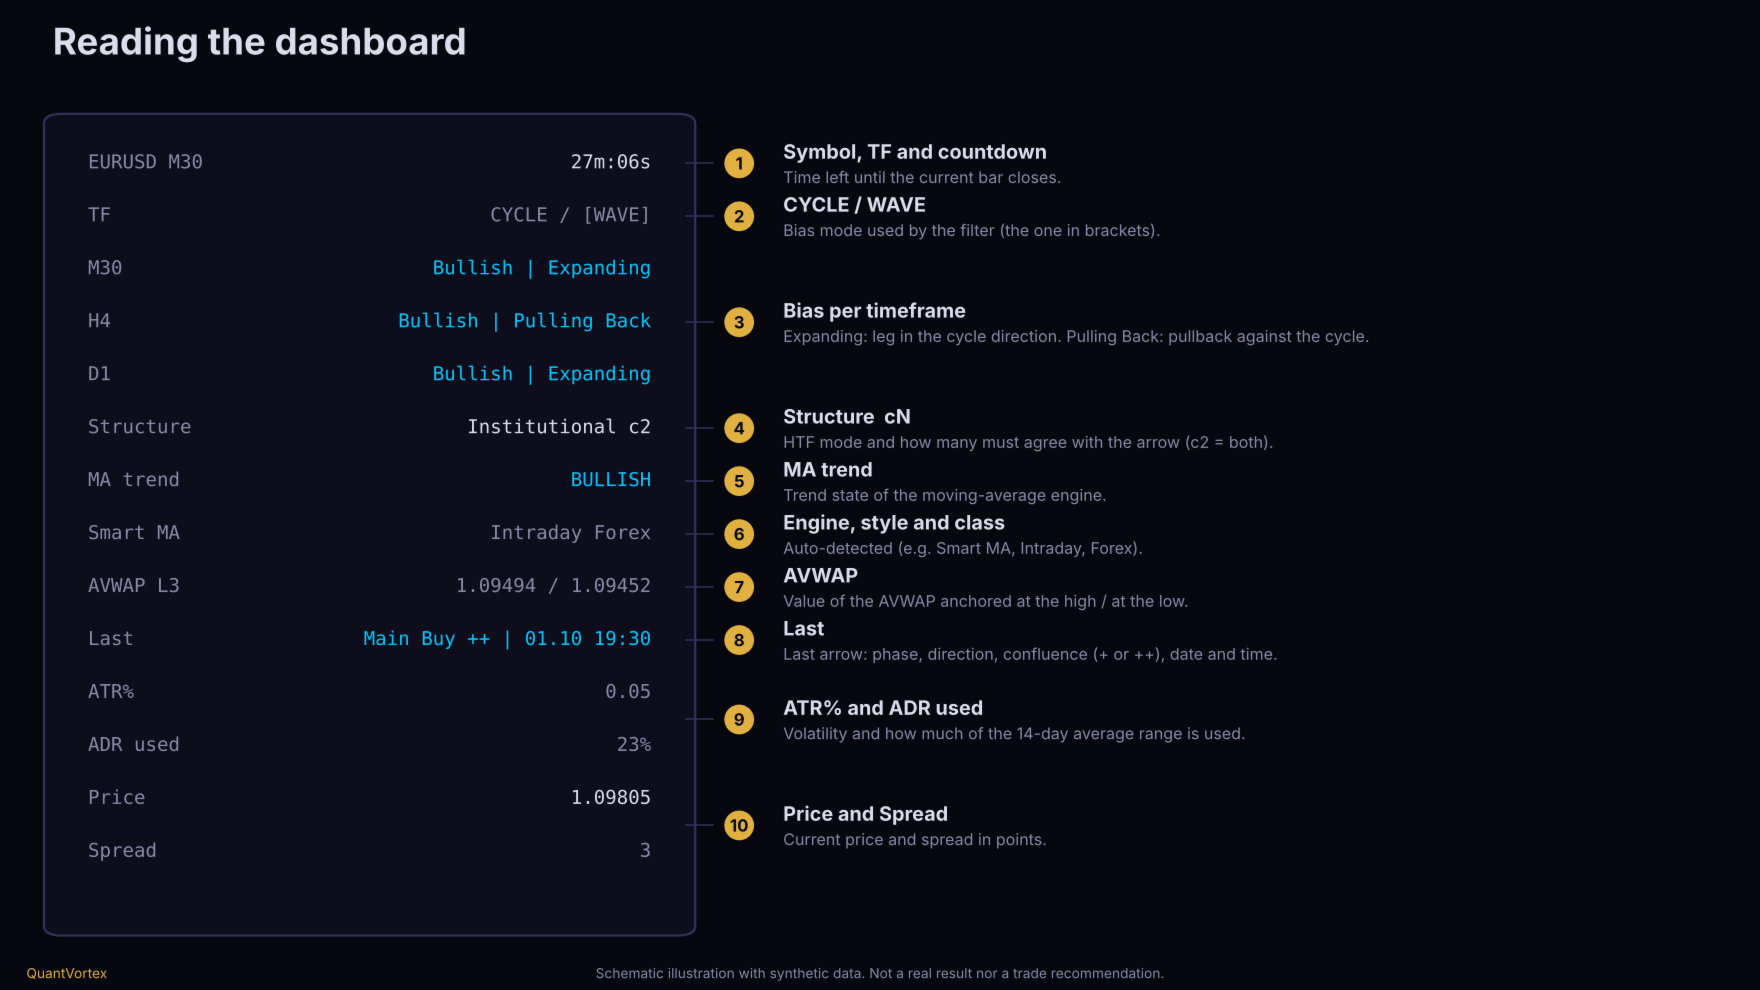
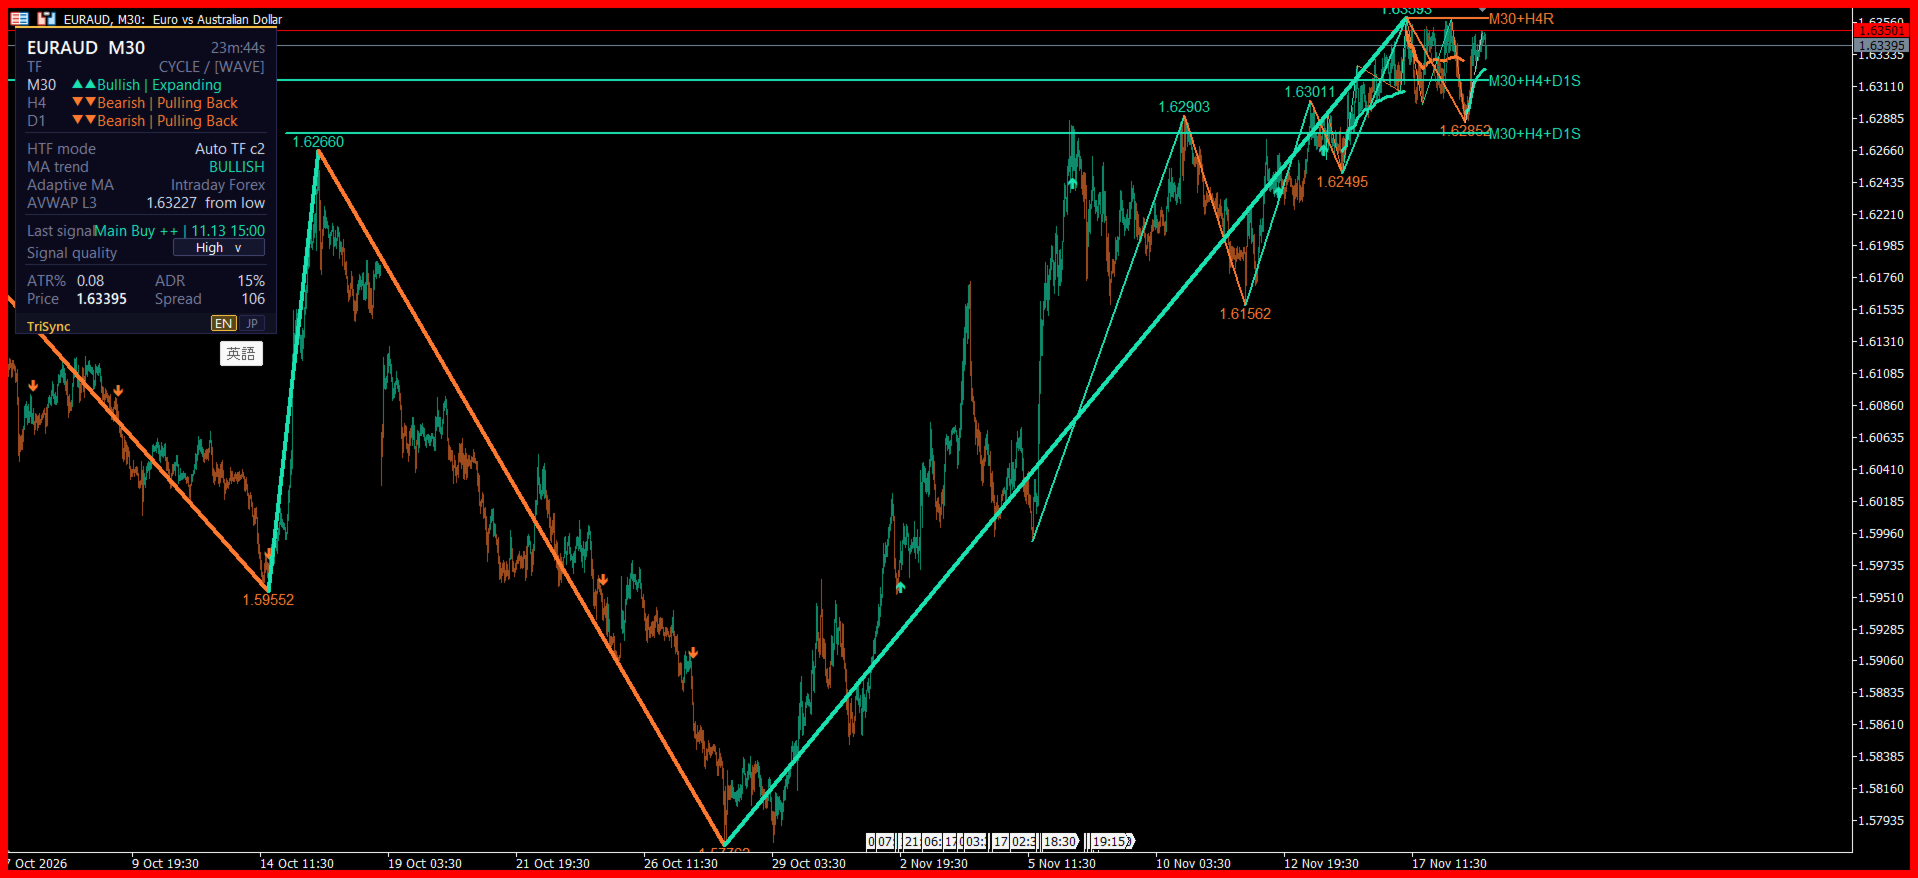
4. Reading the Dashboard (Figure 5)

  • Symbol, timeframe, and countdown to the current bar close.

  • TF — CYCLE / WAVE: Shows which bias mode the filter uses (in brackets). Wave is reactive (last leg direction); Cycle is stricter (higher highs and higher lows, or lower lows and lower highs).

  • Current TF, HTF1, and HTF2 lines: Cycle bias and current leg state. Expanding: the current leg moves in the cycle direction. Pulling Back: the current leg is a correction against the cycle. Example: Bullish | Pulling Back is an uptrend in correction.

  • Structure: Higher-timeframe resolution mode and how many HTFs must agree with the arrow (e.g., c2 means both must agree).

  • MA trend: Trend state of the chosen moving average engine.

  • Engine line: Name of the engine, style, and detected asset class (e.g., Smart MA, Intraday, Forex).

  • AVWAP: Values of AVWAP anchored at the top and bottom.

  • Last: Last signal: phase, direction, confluence (+ or ++), and timestamp.

  • ATR%: ATR divided by price, in %. ADR used: How much of the 14-day average daily range today's range has consumed. Price and Spread.

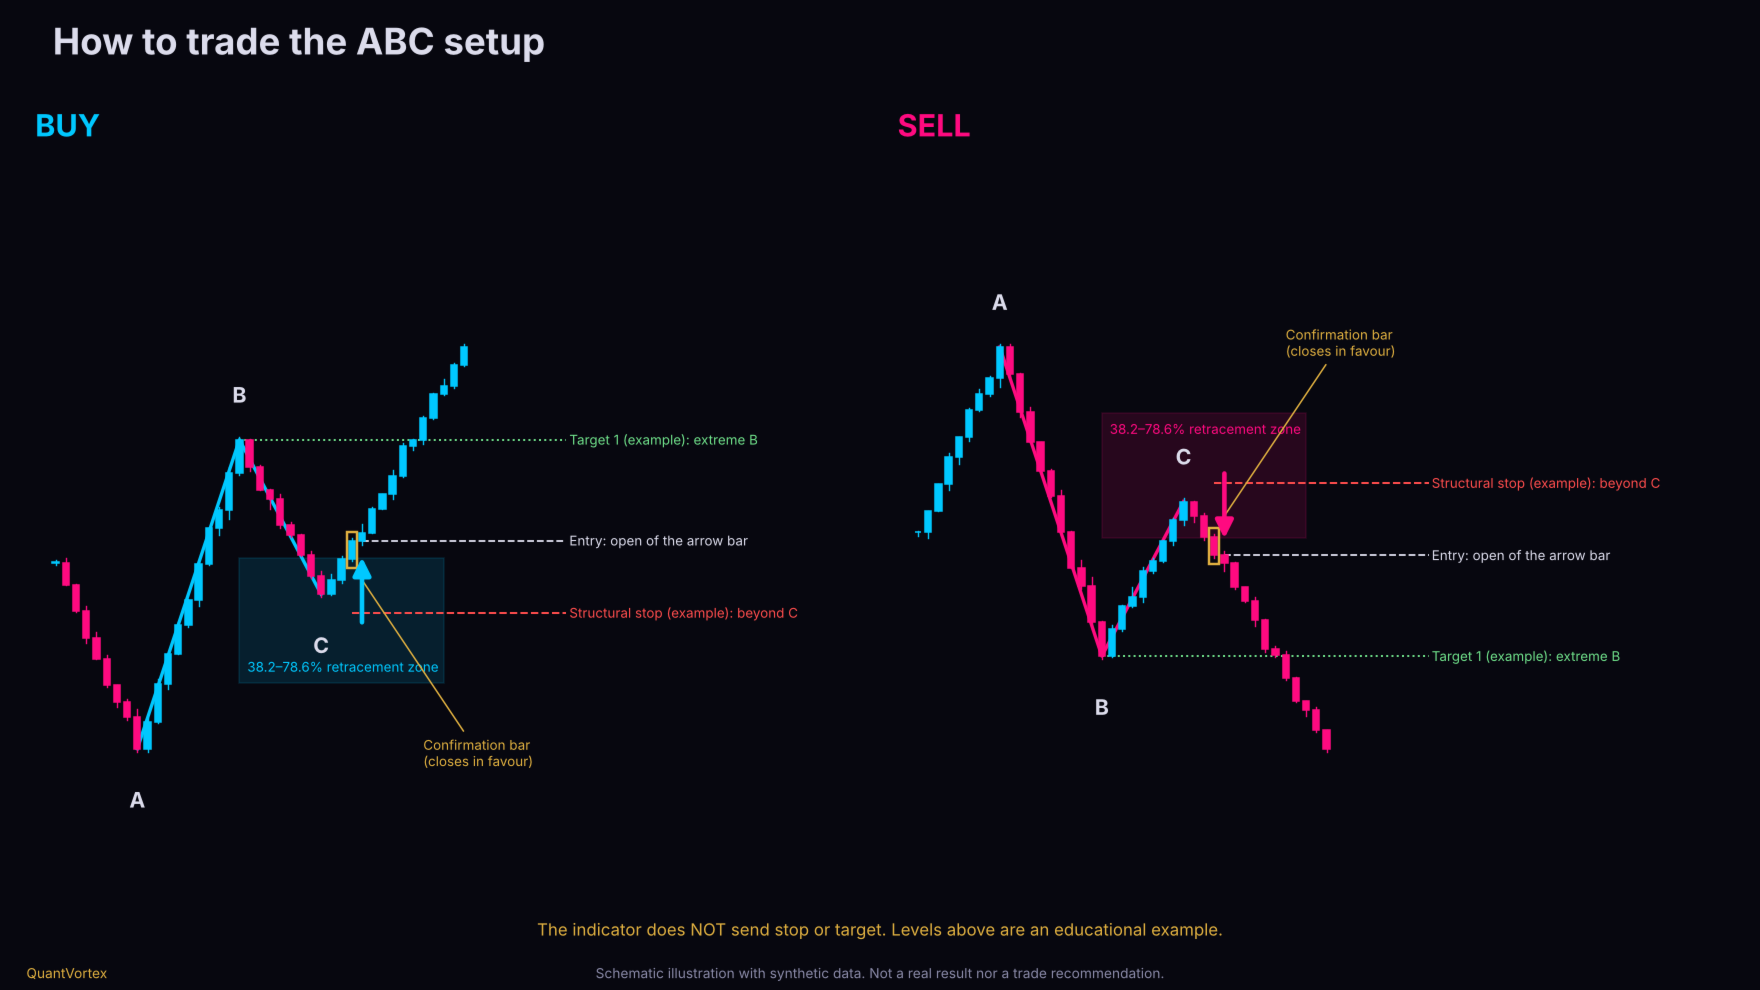
5. How to Trade (Figure 2)

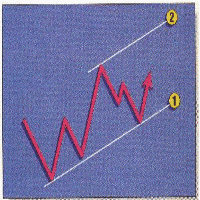
The setup is an ABC pullback pattern: A is a pivot, B is the next pivot (leg A→B), and C is the pullback. The setup is only valid if C retraced between 38.2% and 78.6% of leg A→B, C did not lose the level of A, and leg A→B has at least 2.5 ATR. The arrow only appears after price reverses from C enough to confirm the pivot, and is printed at the open of the next bar.

Buy Checklist

  1. Location: Is price near support (label ending in S) or bottom AVWAP, with room to the next resistance (R)?

  2. Context: Are HTF1 and HTF2 consistent with the buy? (with c2 , the arrow only appears when both agree). Is the MA trend cyan?

  3. Phase: Early or Main are typical resumption scenarios. Late demands caution (see section 6).

  4. Timing: Up arrow. Entry is at the open of the bar where the arrow was printed.

  5. Risk: Define before entering. A reference example is a stop below the C low (structural stop) and the first target at the B high or nearest higher-timeframe resistance. The indicator does not send stops or targets: the example is educational, and position sizing by fixed risk is your decision.

Sell

Mirrored: down arrow, resistance above price as location, bearish HTFs, stop above the C high.

What to Expect from Entry

You enter after pivot C is confirmed, so you do not catch the exact bottom or top. This is a design choice: it avoids arrows in the middle of movement, but costs part of the leg. How much of the move has already been consumed is a question your own testing must answer (see section 11).

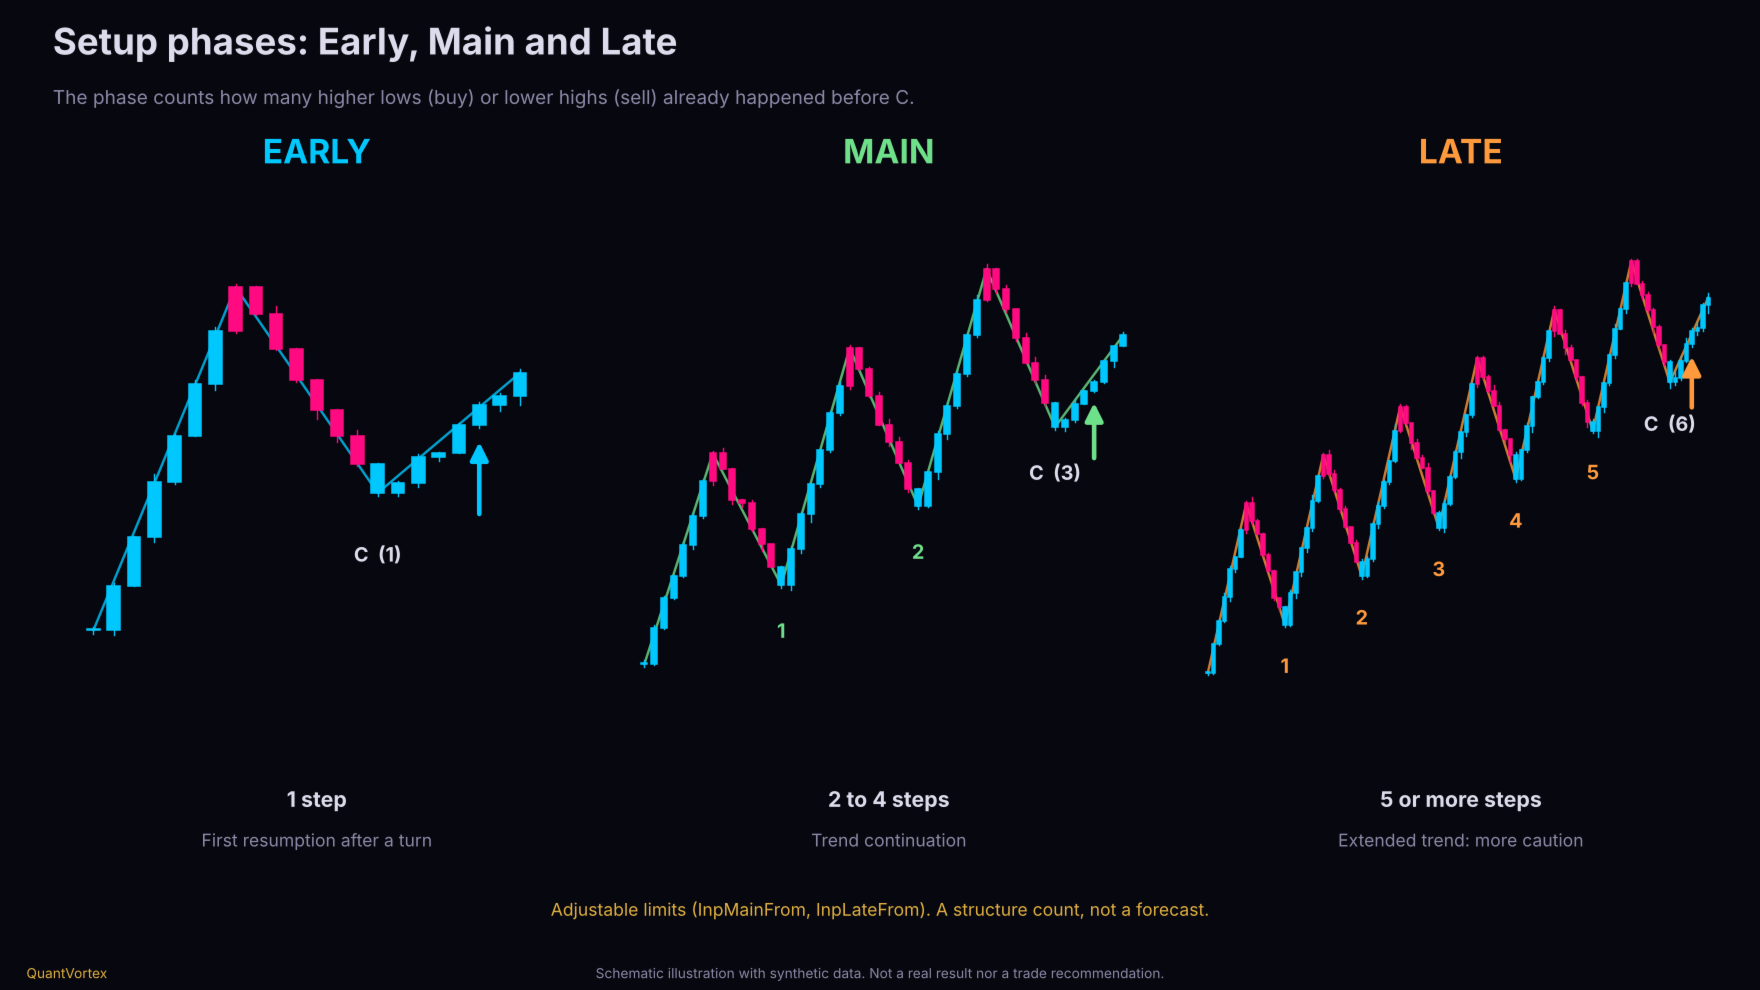
6. Early, Main, and Late Phases (Figure 3)

The phase counts how many consecutive trend-aligned highs or lows exist before pivot C (how many impulse steps have occurred):

  • Early: 1 step. First resumption after a turn.

  • Main: 2 to 4 steps. Trend continuation.

  • Late: 5 or more steps. Extended trend, higher exhaustion risk.

Limits are adjustable (InpMainFrom and InpLateFrom ), and each phase can be disabled. It is a structural count classification, not a prediction. Verify with your data whether it makes a difference on your asset.

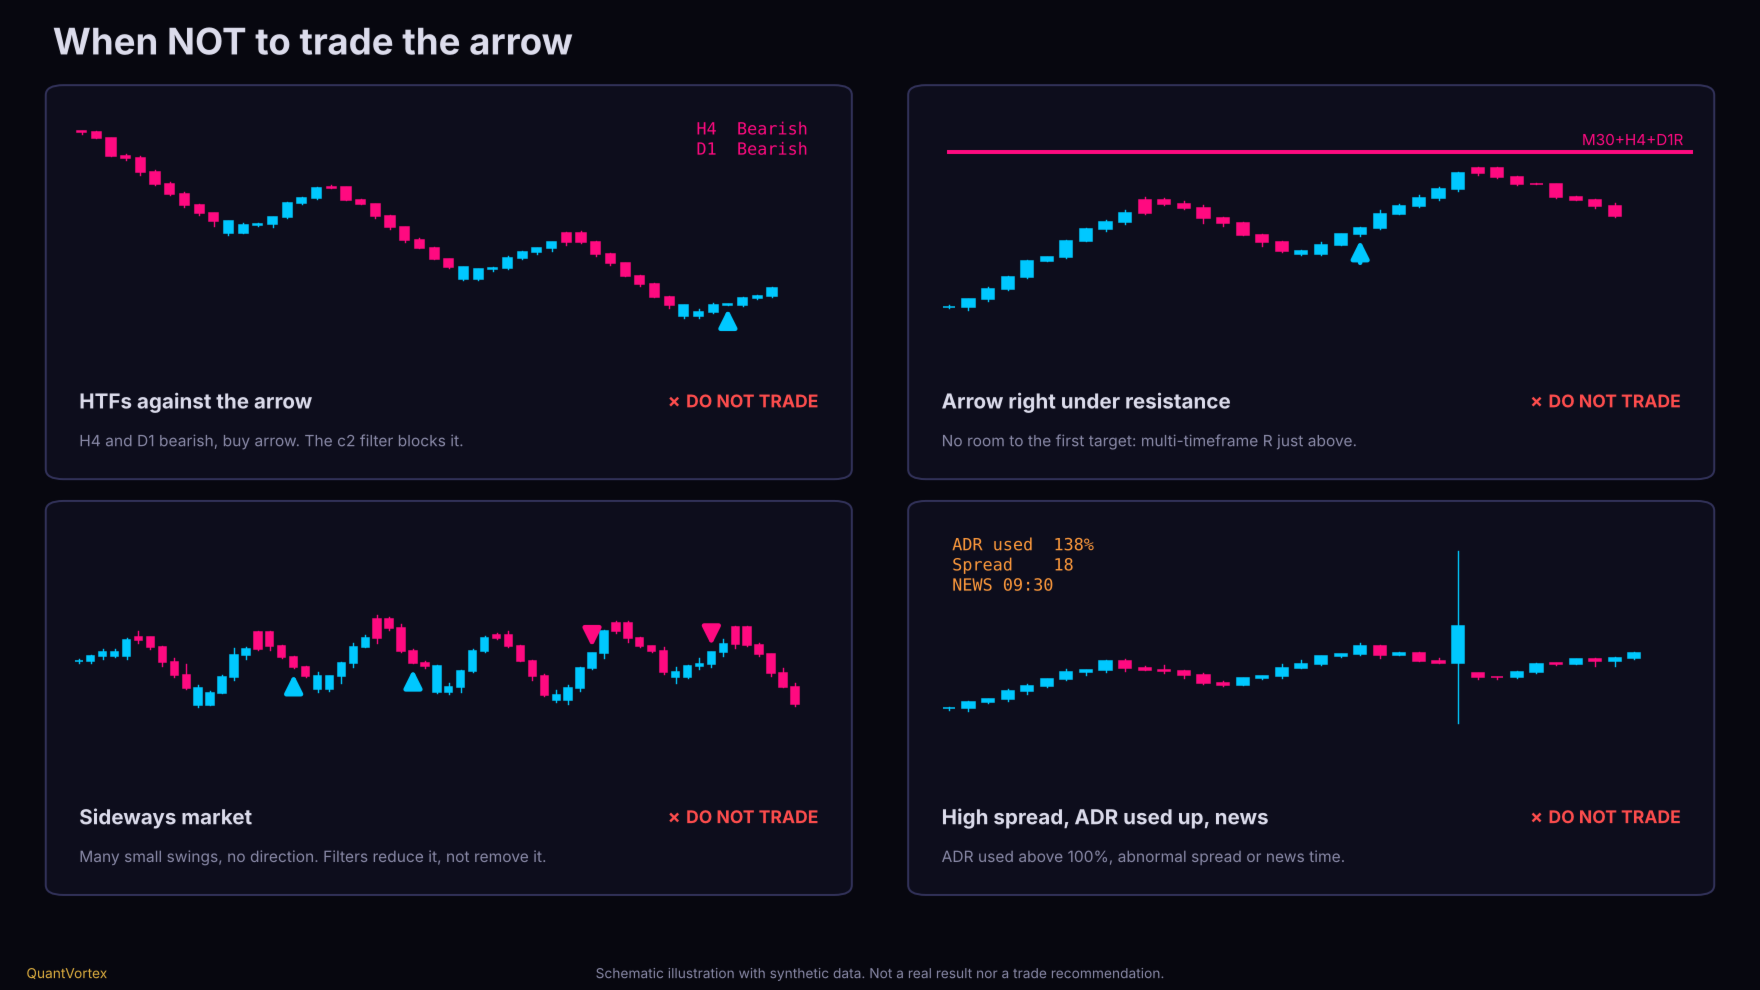
7. When Not to Trade (Figure 6)

  • Higher timeframes against the arrow: The default filter (c2 ) blocks these. If relaxed, know you are trading against context.

  • Arrow stuck right against resistance (or support for sells) from multiple timeframes: No room to the first target.

  • Ranging market: Many small, directionless swings. Minimum leg size and cooldown filters reduce noise, but don't eliminate it.

  • High spread, ADR consumed (>100%), or news times: Dashboard shows spread and ADR used.

  • Dashed leg: It repaints and is not a signal.

8. Configuration

Auto Configuration

  • Style by timeframe: Scalping (up to M5), Intraday (M15 to M30), Intraweek (H1 to H3), Swing (H4+). Also GANN (3-bar swing) and Manual.

  • Asset class by symbol: Forex, Metal, Index, Crypto, Energy, Stock. B3 contracts WIN and WDO are recognized by prefix.

  • Style and class adjust swing sensitivity (reversal in ATR multiples). These values are starting points, not calibrated values: test on your asset.

Higher Timeframes (Institutional Ladder)

Chart TF HTF1 HTF2
M1 M5 M15
M5 M15 H1
M15 H1 H4
H1 H4 D1
H4 D1 W1
D1 W1 4 weeks

Higher candles are built from chart candles (synthetic engine) using server time blocks, maintaining identical results for identical history. Also available: Absolute TF (you choose both) and Fixed Ratio Cascade (x2, x3, x4, or x6).Main Parameters

Parameter Default Purpose
InpStyle / InpClass Auto Style and asset class
InpEngine Smart MA Trend engine (Smart MA, EMA, or conservative)
InpBiasMode Wave Wave (reactive) or Cycle (stricter)
InpMinConf 2 Higher timeframes that must agree (0 to 2)
InpMinLegATR 2.5 Minimum leg size A→B in ATR
InpCooldown 12 Minimum bars between same-direction arrows
InpQuality Standard Strict requires strong confirming bar and close beyond previous bar
InpAvwapLvl 3 Swing level anchoring AVWAP
InpMaxBars 3000 Bars analyzed (fewer bars = lighter)
InpID A Use different IDs when running multiple instances on the same chart

9. Alerts

Popup, sound, and push notifications can be toggled separately. 

Prodotti consigliati
Liquidity Map
Alex Amuyunzu Raymond
Liquidity Map  Overview The Liquidity Map indicator is an advanced visualization tool based on ICT Smart Money Concepts . It automatically identifies daily Buy Zones , Sell Zones , and Liquidity Levels , showing where price is likely to reverse or continue based on institutional order flow. It calculates key levels from the daily session — such as the previous day’s high, low, and midpoint — then derives a premium (sell bias) and discount (buy bias) structure. When price trades into these mapped
Linha PCM Fimathe
Anderson Maicon De Vargas Odorcik
1 (1)
Manual de Instalação e Configuração Para que você tenha a melhor experiência profissional, siga estes passos simples para preparar o seu terminal: 1. Ativação no Terminal (Ajuste de Segurança) Antes de começar, precisamos garantir que o MetaTrader permita que você manipule a ferramenta livremente: Pressione Ctrl + O para abrir as Opções . Vá na aba Gráficos . Marque a opção: "Selecionar objetos com um clique do mouse" . Isso permitirá que você ajuste a régua de medição de forma instantânea. 2. V
Round levels for XAUUSD
Antonio Chrispus Mpanga Ntege
RoundLevels is an XAUUSD indicator designed to display psychological round-number price levels on the chart. These levels can be used as reference points when analyzing price movement, support and resistance, breakouts, retests, and reactions around commonly observed price intervals. The indicator automatically presents selected round levels on the chart, reducing the need to mark these levels manually. Traders can use the displayed levels together with their existing market structure, volatili
SLL Struct
Akarat Premprat
SLL Struct is a market structure and cycle Fibonacci indicator for MetaTrader 5. It is designed to help traders visualize confirmed price swings, identify Bull and Bear market structure, classify breakout behavior, and display cycle-based Fibonacci extension levels directly on the chart. Main features: • Confirmed Swing High and Swing Low structure • Bull and Bear market structure visualization • Complete and Neck Break classification • Divergence-aware structure classification • Candidate c
Moving pivot Average Fibonacci The  indicator compares the selected period with its counterpart from the previous period. The indicator determines the moving Fibonacci levels for the day or any time interval to assess the price movement range from the time average. The indicator helps predict the expected high or low for the day based on historical time data. The pivot line can be considered an average trend line and use it in a variety of trading strategies. If you have any question about the
DM IND Exclusive
Sergio Vidal Prado
Indicador Para Opções Binarias. Indicator for Binary Options Usa dois gales. Instalar em mt5 Esse indicador é para ser usado no tempo de vela de 5 minutos e em M5. Este também funciona em M1, porém é mais eficiente em M5. Só descompactar e copiar os arquivos na pasta de dados do seu MT5. Arquivos indicator na pasta MQL5 - Indicator. Baixe também a Media Movel totalmente gratis: https://www.mql5.com/pt/market/product/50400 Esse Indicador é para a próxima vela. Apareceu a seta, só aguardar a próx
Signal Eskiya, in addition to channel lines, reflects entry signals in the form of arrows. Trading strategies using the channel indicator belong to the classic methods of technical analysis, are easy to execute, and therefore available even to beginners. Price ranges work equally well on any trading assets and timeframes, they can be used both independently and with additional confirmation from oscillators and market volumes. American traders say: “Trend is your friend”, which means “Trend is
Adaptive Math Zones Indicator is a professional MT5 indicator designed to identify high-probability price reaction areas using mathematical price projections and Fibonacci-based channel structures. The indicator automatically builds a reference price channel, highlights neutral zones, and projects future price levels (50%, 100%, and 200%), helping traders visually understand market structure and potential reaction points. This tool is especially effective during ranging and corrective market con
Probability Range Bands
Florian Nuebling
5 (1)
The indicator ‘Probability Range Bands’ gives a prediction of the amount, how much the asset is moving from its current price. The range bands give probabilities, that the candle close will not exceed this certain price level. It is also called the expected move for the current candle close.   This Indicator is based on statistical methods, probabilities and volatility. Asset price is assumed to follow a log-normal distribution. Therefore, log returns are used in this indicator to determine the
CypherNexus
Casey Nkalubo
3 (1)
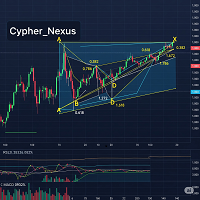
Cypher Pattern Detector A tool for automatic detection of Cypher harmonic patterns (XABCD) in financial charts. Overview The Cypher Pattern Detector identifies both bullish and bearish Cypher harmonic patterns in real time. It applies Fibonacci ratio validation and a quality scoring system to highlight patterns that closely match the defined structure. This helps traders observe and analyze potential market structures more consistently, without the need for manual drawing. Main Features Pattern
FREE
TTB ABC Trend Structure is a clean, practical price-action indicator designed to help traders spot trend alignment, market structure swings, and high-probability entry points without chart clutter. MAIN FEATURES: 1. ATR TREND LINE:    - A single, smooth dynamic trendline that filters macro market direction.    - Sky Blue line = Bullish trend.    - Crimson Red line = Bearish trend.    - Keeps your chart clean and free of noisy indicators. 2. POINT C SIGNAL ARROWS & TRIGGER STRIPE:    - Clear si
FREE
CYP Trade Manager Pro MT5: The Trader's Edge in Position Management Transform How You Manage Trades - Focus on What Matters Why Most Traders Fail - And How CYP Trade Manager Pro Solves It Many traders have solid entry strategies but lack proper trade management - the key difference between professionals and amateurs. CYP Trade Manager Pro handles the critical "after entry" phase of trading that most EAs ignore, giving you the edge that institutional traders use every day. Who Is It For Manual
HTF Open Markers + ICT Silver Bullet Zones — Usage & Strategy Guide What it draws Session 1 / Session 2 lines : vertical lines at the open of every bar on two independently configurable higher timeframes (defaults: H4 and D1), including a projected line for the rest of today's not-yet-opened bars on sub-daily timeframes, so you can see where the next candle will open before it happens. ICT Silver Bullet zones : shaded rectangles over the three classic ICT kill-zone windows, converted from New Yo
FREE
Send me a message so I can send you the setfile Robot robusto con diverse configurazioni disponibili, Da utilizzare con BTC su un intervallo di tempo di 10 minuti con le impostazioni nello screenshot qui sotto. Acquistando il robot esperto, hai il diritto di richiedere modifiche per continuare a migliorare il bot. Caratteristiche principali Strategia di crossover della media mobile: L'EA utilizza due medie mobili (MA1 e MA2) per generare segnali di trading. Un incrocio della MA più veloce
MultiSymbolsWpr Indice x IBOV
Israel Goncalves Moraes De Souza
O Indicador identifica relação do Índice com a soma dos principais ativos, funciona para qualquer mercado do mund o, possui um oscilador WPR com a soma dos principais ativos escolhidos, indicando a antecipação do movimento em relação ao Índice. Características WPR com a soma dos papéis escolhidos - branco WPR do papel atual - vermelho Canal de Tendência O indicador pode indicar movimento de entradas, sendo: cruzamento das linhas cruzamento da linha Multi Symbols no -50 cruzamento entre os canai
FREE
Fibonacci Retracement EA
Choawana Malaikitsanachalee
Fibonacci Retracement EA for MetaTrader 5 Fibonacci Retracement EA is an Expert Advisor that shows Fibonacci-based trading logic directly on your chart. It builds a Fibonacci box from recent candles, shows where it is waiting to enter, and manages each trade with break-even and trailing stop rules. It was built to help traders learn and test a rule-based approach. Please test it on a demo account before using real money. How It Works 1. Fibonacci box: the EA finds the high and low of recent
TM Price Stretch Map mostra un canale di prezzo per individuare una candela che chiude oltre una banda e il ritorno della candela chiusa successiva all'interno del canale. Le bande continue utilizzano un calcolo gaussiano causale basato soltanto sui prezzi disponibili in quel momento. Un punto rosso segnala una chiusura sopra la banda superiore; un punto turchese segnala una chiusura sotto quella inferiore. Se la candela chiusa successiva torna tra entrambe le bande, compare una freccia verso il
FREE
ApexForge MA Trend Strength Professional is the flagship edition of the ApexForge product line, delivering the most complete feature set for traders who demand professional-grade market analysis. Built for serious traders, it combines powerful trend evaluation with extensive customization, providing a flexible solution for scalping, intraday trading, swing trading, and multi-timeframe analysis. The indicator automatically evaluates moving average slopes and converts them into five intuitive tren
Adaptive SR Zones – Breakout Edition Adaptive SR Zones is a next-generation MetaTrader 5 indicator that automatically maps support and resistance zones and tracks breakout activity in real time. Designed for traders who rely on market structure and zone confluence, it combines multi-timeframe analysis , breakout confirmation logic , and customizable alerts into one powerful tool. No repainting. Core Features Dynamic Support & Resistance Mapping Detects zones from swing highs/lows and reaction po
Alphabet AI MT5
Sergei Pomytkin
3.43 (7)
Alphabet AI è un consulente che opera secondo la strategia di mean reversion, ovvero sfrutta la proprietà naturale dei mercati di tornare ai loro valori medi dopo forti deviazioni. L'algoritmo analizza costantemente il prezzo attuale dell'asset, confrontandolo con i livelli medi calcolati. Quando il prezzo si discosta significativamente dal suo valore medio, il consulente lo interpreta come un segnale d'azione: quando il limite superiore viene superato, apre posizioni corte, aspettandosi un cal
Automatically plots the 'Golden Fibonacci Ratio’ between the High and Low of the previous day... ...Highs and Lows are great Support and Resistance zones. Breakouts of Fibonacci levels are key points for entry and exit of trades. Pink lines indicate that the previous day's Candle closed lower. Blue colored lines indicate that the previous day's Candle closed higher.
Adaptive Trend Projection è un indicatore per MetaTrader 5 progettato per aiutare i trader a visualizzare la possibile continuazione dell’attuale struttura di mercato. L’indicatore analizza il comportamento recente del prezzo utilizzando due finestre di regressione ponderata: una più lunga per comprendere la direzione generale e una più breve per catturare il movimento più recente. Successivamente combina la pendenza del trend, l’accelerazione recente, la volatilità e i limiti basati sull’ATR pe
Auto Trend Doug Scalper – Linhas Automáticas de Tendência O Auto Trend Doug Scalper é um indicador desenvolvido para MetaTrader 5 (MT5) que identifica e desenha automaticamente linhas de tendência, suporte e resistência diretamente no gráfico. Seu objetivo é facilitar a análise técnica, permitindo que o trader visualize regiões relevantes de preço, acompanhe a estrutura do mercado e identifique possíveis áreas de reação, continuidade ou rompimento. Principais funcionalidades Linhas automáticas:
FREE
Midpoint Bands
Emanuel Cavalcante Amorim Filho
Midpoint Bands   is a   channel-like   indicator that draws two lines on the chart - an upper band and a lower band, pointing out possible reversal levels. This is one of the indicators used in the Sapphire Strat Maker - EA Builder. Sapphire Strat Maker - EA Builder:  https://www.mql5.com/en/market/product/113907 The bands are simply calculated like this: Upper Band   = (HighestHigh[N-Periods] + LowestHigh[N-Periods])/2  Lower Band   = (LowestLow[N-Periods] + HighestLow[N-Periods])/2 Middl
FREE
Questo indicatore multi time frame e multi simbolo identifica quando la linea del segnale stocastico attraversa la linea principale stocastica. In alternativa può anche avvisare quando lo stocastico sta lasciando (senza che la linea di segnale attraversi la linea principale) un'area di ipercomprato/ipervenduto. Come bonus può anche eseguire la scansione delle bande di Bollinger e degli incroci RSI ipercomprato/ipervenduto. Combinato con le tue regole e tecniche, questo indicatore ti permetterà d
XAUUSD AMNESIA PROTOCOL AI     Amnesia Protocol - Exploiting the chaotic moments when the market forgets all technical analysis.    XAUUSD Amnesia Protocol AI is a breakthrough trading system based on "The Market Amnesia Hypothesis". When high-impact news hits or panic ensues, the market experiences temporary "Amnesia". Support and resistance levels become meaningless, and chaos takes over. This EA is specifically designed to remain dormant during normal market conditions and instantly awaken th
Smart Pivot Points per MetaTrader 5: Livelli chiari per un trading intelligente Smart Pivot Points è un indicatore professionale per MetaTrader 5 che calcola e visualizza automaticamente un set completo di livelli di trading chiave sul grafico. Trasforma il caos dell'andamento dei prezzi in una mappa chiara e strutturata, evidenziando supporto, resistenza, equilibrio dei prezzi e potenziali zone target. Progettato per i trader che apprezzano la chiarezza, lo strumento funziona su qualsiasi merc
Five Point Turn
Brighton Mufaro Mudzingwa
FiveZero Spike & Trend Engine  The Ultimate Non-Repainting Multi-Asset Signal & Pattern System Take control of the markets with an elite, precision-engineered trading indicator designed to capture explosive market moves with extreme accuracy. Built on the powerful 5-0 Harmonic Pattern Structure (0-X-A-B-C) combined with a real-time Bollinger/Structure Block Engine and Reciprocal Ratio Validation, this tool gives you non-repaint buy and sell signals right at the candle open . Whether you trade Fo
SessionRange-MT5-Ind   is an indicator for MetaTrader 5 that builds a High/Low/Middle channel based on the given trading session. Indicator : Defines the session range   - builds a channel based on a given high/low window Draws three lines : SessionTop (blue) —   maximum session SessionMiddle (grey) — channel center SessionBottom (orange) —   minumum session Session mode (Mode) : `Previous Day` —   for classical PDH/PDL (previous day range) `Current Day` —   to display the current day’s session
FREE
Previous Day Close
Vincent Kipleting Burugo
5 (1)
The indicator is a line right at yesterday's closing price. With the indicator, there is no need for adding or deleting previous day close lines each new day. T he line gives you an instant visual reference point for support, resistance, and market sentiment.   Whether you are day trading or swing trading, this line helps you quickly gauge where the market closed last session and how current price action relates to that level. It works seamlessly across all timeframes - from 1-minute charts to d
FREE
Gli utenti di questo prodotto hanno anche acquistato
Trend Sniper X
Sarvarbek Abduvoxobov
4.87 (46)
Trend Sniper X è un indicatore trend-following multi-timeframe per MetaTrader 5 che aiuta i trader a identificare la direzione del trend e i potenziali punti di inversione con chiarezza e precisione. per MT4: https://www.mql5.com/en/market/product/193245 Informazioni sul prezzo: Il prezzo attuale è promozionale ed è soggetto a modifiche con il rilascio di futuri aggiornamenti e nuove funzionalità. Offerta Bonus: Per ricevere GRATIS l'Auto-Trade Assistant EA per questo indicatore, invia un messa
Un nuovo Re in città - Indicatore + Gestione ordini (TP1 + TP2 + TP3) + Invio opzionale di segnali Telegram INCLUSO (GRATIS) (SISTEMA COMPLETO DI TRADING e SEGNALI) Il nostro miglior EA per l’Oro: Gold Slayer Questo indicatore include una strategia avanzata, un sistema di trading con gestione ordini personalizzabile e un sistema mean reversion che combina estensioni di envelope, supportato da molteplici filtri intelligenti di conferma come RSI per individuare ingressi di inversione ad alta proba
Entry Points Pro vi mostra dove entrare, dove mettere lo stop e con quale lotto operare — prima di piazzare l'ordine. PREZZO Ora 199 USD: 4 copie a questo prezzo, poi 249 USD. Il prezzo finale è di 349 USD. Guadagno facendo trading sui mercati e lo dimostro, quindi non ho bisogno di vendere questo indicatore a tutti. È uno strumento per trader che ragionano con la propria testa, non un pulsante magico. Nessuna rottura, nessun trade. Una freccia grigia è un segnale annullato: il prezzo non ha ro
SuperScalp Pro
Van Minh Nguyen
4.5 (38)
SuperScalp Pro - Professional Multi-Layer Confluence Scalping System SuperScalp Pro è un indicatore di scalping avanzato che potenzia il Supertrend classico con diversi filtri intelligenti di conferma. Aiuta a individuare opportunità di trading Buy/Sell con una maggiore probabilità di successo, riducendo significativamente i falsi segnali. Le frecce Buy e Sell vengono visualizzate chiaramente direttamente sul grafico, insieme ai livelli di Stop Loss e Take Profit basati sull’ATR, calcolati autom
Gann Made Easy è un sistema di trading Forex professionale e facile da usare che si basa sui migliori principi del trading utilizzando la teoria di mr. WD Gann. L'indicatore fornisce segnali ACQUISTA e VENDI accurati, inclusi i livelli di Stop Loss e Take Profit. Puoi fare trading anche in movimento utilizzando le notifiche PUSH. CONTATTAMI DOPO L'ACQUISTO PER RICEVERE GRATUITAMENTE LE ISTRUZIONI DI TRADING E OTTIMI INDICATORI EXTRA! Probabilmente hai già sentito parlare molte volte dei metodi d
Ultra Indicator
Ihor Otkydach
5 (1)
ULTRA è un indicatore tecnico che funziona secondo un approccio “tutto in uno”: analizza autonomamente il mercato, genera segnali di trading, visualizza i livelli per l’impostazione degli ordini stop-loss e suggerisce quando chiudere le operazioni per realizzare profitti o ridurre al minimo le perdite. In altre parole, non importa se non sai come analizzare il mercato, determinare i livelli — dove impostare lo stop-loss — o se hai difficoltà con la gestione del capitale. ULTRA farà tutto questo
Currency Strength Wizard   è un indicatore molto potente che ti fornisce una soluzione all-in-one per un trading di successo. L'indicatore calcola la potenza di questa o quella coppia forex utilizzando i dati di tutte le valute su più intervalli di tempo. Questi dati sono rappresentati in una forma di indice di valuta facile da usare e linee elettriche di valuta che puoi utilizzare per vedere il potere di questa o quella valuta. Tutto ciò di cui hai bisogno è collegare l'indicatore al grafico ch
Auto Optimized SpeedAngle è un sistema di vettorizzazione del momento di livello istituzionale che elimina l'overfitting ( curve-fitting ) attraverso l'ottimizzazione continua Walk-Forward (WFO). Invece di affidarsi a input statici che si degradano quando i regimi di mercato cambiano, l'indicatore recalibra dinamicamente i suoi parametri utilizzando la validazione Out-of-Sample (OOS), assicurando che i segnali visualizzati rappresentino reali vantaggi statistici anziché anomalie storiche. Quadro
Boba Analysis Suite
Trade Ready Solutions LLC
5 (2)
Boba Analysis Suite Boba Analysis Suite è un indicatore di analisi per MetaTrader 5. Riunisce la struttura del mercato, le zone di prezzo rilevanti e il contesto generale del mercato in un’unica visualizzazione del grafico. Sviluppato sulla base dell’esperienza pratica come trader e formatore di trading, supporta un processo di analisi strutturato: valutare la direzione del mercato, individuare livelli importanti e analizzare congiuntamente più intervalli temporali. Analisi nel contesto del merc
FX Power MT5 NG
Daniel Stein
5 (33)
FX Power: Analizza la Forza delle Valute per Decisioni di Trading Più Intelligenti Panoramica FX Power è lo strumento essenziale per comprendere la reale forza delle principali valute e dell'oro in qualsiasi condizione di mercato. Identificando le valute forti da comprare e quelle deboli da vendere, FX Power semplifica le decisioni di trading e rivela opportunità ad alta probabilità. Che tu segua le tendenze o anticipi inversioni utilizzando valori estremi di Delta, questo strumento si adatta
Indicatore multi-valuta di forza e momentum MT5 Dynamic Forex28 Navigator è l'evoluzione dei nostri indicatori popolari da lunga data, che riunisce la potenza di cinque in uno: Advanced Currency Strength28 Indicator (700 recensioni) Advanced Currency IMPULSE with ALERT (530 recensioni) Currency Strength EXOTICS GOLD Impulse with Alert CS28 Combo Signals (bonus attuale) Non serve acquistare quattro indicatori e impilarli sui grafici. Tutto è riunito in un solo indicatore potente: la forza delle 2
M1 Sniper MT5
Oleg Rodin
5 (7)
M1 SNIPER   è un sistema di indicatori di trading facile da usare. Si tratta di un indicatore a freccia progettato per l'intervallo temporale M1. L'indicatore può essere utilizzato come sistema autonomo per lo scalping sull'intervallo temporale M1 e come parte del tuo sistema di trading esistente. Sebbene questo sistema di trading sia stato progettato specificamente per il trading sull'intervallo temporale M1, può comunque essere utilizzato anche con altri intervalli temporali. Inizialmente ho p
Azimuth Pro
Ottaviano De Cicco
5 (7)
Azimuth Pro V2: Synthetic Fractal Structure and Confirmed Entries for MT5 Overview Azimuth Pro is a multi-level swing structure indicator by Merkava Labs . Four nested swing layers, swing-anchored VWAP, ABC pattern detection, three-timeframe structural filtering, and closed-bar confirmed entries — one chart, one workflow from micro-swings to macro-cycles. This is not a blind signal product. It is a structure-first workflow for traders who care about location, context, and timing. 1. What Change
Apex Patterns PRO Acquista l'indicatore - Ottieni GRATUITAMENTE l'Expert Advisor basato su di esso. Intelligenza auto-ottimizzante per pattern grafici e breakout Gli scanner di pattern tradizionali si basano su input fissi, registrando spesso prestazioni inferiori quando la volatilità e le strutture del mercato cambiano. Apex Patterns PRO è progettato per adattarsi alle mutevoli condizioni di mercato combinando il riconoscimento dei pattern grafici strutturali, il filtraggio del momentum e l'au
Prossimo aggiornamento — Versione 2.52 in arrivo! [NOVITÀ] Preparati a 4 nuove funzionalità principali progettate per migliorare la tua analisi di mercato e il tuo flusso di lavoro nel trading Portiamo l’analisi di mercato a un livello superiore con 4 nuove funzionalità progettate per soddisfare le tue esigenze di trading. Ecco le novità: 1. TRADE OVERVIEW DASHBOARD 2. CONFLUENCE AT ZONE 3. STRONG & WEAK HIGH/LOW 4. OTE 1. TRADE OVERVIEW DASHBOARD Una dashboard che ti aiuta a comprendere più fa
Divergence Bomber
Ihor Otkydach
4.89 (94)
Ogni acquirente dell’indicatore riceverà inoltre gratuitamente: L’utilità esclusiva “Bomber Utility”, che gestisce automaticamente ogni operazione, imposta i livelli di Stop Loss e Take Profit e chiude le posizioni secondo le regole della strategia I file di configurazione (set file) per adattare l’indicatore a diversi asset I set file per configurare il Bomber Utility in tre modalità: “Rischio Minimo”, “Rischio Bilanciato” e “Strategia di Attesa” Una guida video passo-passo per installare, con
Power Candles MT5
Daniel Stein
4.58 (12)
Power Candles V3 - Indicatore di forza ad ottimizzazione automatica Power Candles V3 trasforma la forza delle valute e degli strumenti in un piano di trading attuabile su ogni grafico a cui è collegato. Invece di limitarsi a colorare le candele, esegue un'auto-ottimizzazione in tempo reale in background e ti fornisce i migliori valori di Stop Loss, Take Profit e soglia di segnale per il simbolo che hai davanti. Basta un clic per adottarlo nel trading live: i raggi di ingresso, Stop Loss e Take P
Gold Sniper Scalper Pro
Ich Khiem Nguyen
3.9 (10)
Gold Sniper Scalper Pro è un indicatore per MetaTrader 5 costruito specificamente per rilevare pattern di falsa rottura (false breakout) su XAUUSD. Identifica la struttura trappola a 4 barre dove il prezzo supera il confine di un range, attira i trader di rottura e poi inverte — confermando che il movimento era una falsa rottura. L'indicatore valuta ogni setup secondo 17 fattori di qualità, lo elabora attraverso un pipeline di confluenza a 4 livelli, lo verifica contro un motore di consenso di
Naked Forex Tweezer Pro Indicator Tweezer Pro Indicator is a pattern recognition indicator for Forex, Stocks, Indices, Futures, Commodities and Cryptos. The standard Tweezer is a two bar pattern. Our enhanced version is a multi-bar pattern. We filter the patterns for you so that you only get the     best and most effective patterns   and ignore the noise. The Tweezer pattern is a simple and effective pattern to trade. The strategy that comes with the Tweezer is based on price action. The Twe
Adaptive Price Action Engine Acquista un indicatore, ricevi l'EA gratis Analisi Auto-Ottimizzata del Trend e dei Pattern Candlestick Multi-Timeframe I mercati cambiano continuamente e non tutti i pattern di Price Action hanno lo stesso valore in ogni condizione di mercato. Adaptive Price Action Engine è progettato per adattarsi alle condizioni di mercato in continua evoluzione, combinando struttura del trend, analisi Multi-Timeframe, pattern Candlestick e ottimizzazione statistica in un unico fr
Crystal Heikin Ashi Signals
Muhammad Jawad Shabir
5 (5)
Crystal Heikin Ashi Signals—Professional Trend & Signal Detection Indicator Advanced Heikin Ashi Visualization with Intelligent Signal System for Manual & Automated Trading Final Price: $149 ---------> Price goes up $10 after every 10 sales . Limited slots available — act fast . Overview User Guide PDF Crystal Heikin Ashi Signals is a professional-grade MetaTrader 5 indicator that combines pure Heikin Ashi candle visualization with an advanced momentum-shift detection system. Designed for both m
Fx Levels Premium Indicator Support and Resistance are important concepts in trading. Fx Levels Premium was created to easily draw important levels of support and resistance for the active trader. The indicator will give you all important levels (support/resistance) to watch for a wide range of assets. Trading without these levels on your chart is like driving a car for a long journey without a roadmap. You would be confused and blind. Support and resistance levels should be used as guideline
OrderFlux – Indicatore Orderflow Footprint Chart, Volume Profile e Market Profile per MetaTrader 5 OrderFlux è un indicatore Footprint di Order Flow per MetaTrader 5 che permette di osservare direttamente cosa accade all’interno di ogni candela. Mostra il volume scambiato a ogni livello di prezzo, distinguendo gli acquirenti aggressivi dai venditori aggressivi. A partire dai tick, costruisce in tempo reale un grafico Footprint completo con delta, squilibri, assorbimento, Volume Profile, Market P
Meridian Pro
Ottaviano De Cicco
4 (3)
Meridian Pro 2.00: Professional Multi-Timeframe Trend Matrix for MT5 Meridian Pro 2.00 is a professional adaptive trend matrix for MetaTrader 5. It combines the original Meridian trend engine, a clean chart ribbon, closed-bar signal arrows, an 8-timeframe dashboard, Fuel momentum, weighted consensus, synthetic HTF processing and chart-native higher-timeframe context lines. The goal is simple: read current trend, multi-timeframe structure, strength, momentum and EA-ready state from one discipline
Apollo SR Master è un indicatore di Supporto/Resistenza con caratteristiche speciali che rendono il trading con le zone di Supporto/Resistenza più semplice e affidabile. L'indicatore calcola le zone di Supporto/Resistenza in tempo reale senza alcun ritardo, rilevando i massimi e i minimi dei prezzi locali. Quindi, per confermare la nuova area SR formata, l'indicatore mostra un segnale speciale che segnala che la zona SR può essere presa in considerazione e utilizzata come un vero e proprio segna
FX Trend MT5 NG
Daniel Stein
5 (6)
FX Trend NG: La Nuova Generazione di Intelligenza di Trend Multi-Mercato Panoramica FX Trend NG è uno strumento professionale di analisi del trend multi-timeframe e monitoraggio dei mercati. Ti consente di comprendere la struttura completa del mercato in pochi secondi. Invece di passare tra numerosi grafici, puoi identificare immediatamente quali strumenti sono in trend, dove il momentum sta diminuendo e dove esiste un forte allineamento tra i timeframe. Offerta di Lancio – Ottieni FX Trend NG
Astral Volume
Ottaviano De Cicco
Astral Volume Leggi il momentum ponderato per volume nel contesto. Offerta di lancio — $78 · Risparmia il 35% · $120 dopo il lancio. Un movimento locale intenso può apparire diverso su un timeframe superiore. Per chi affianca il volume al prezzo, Astral Volume riunisce la lettura locale e il quadro più ampio prima di valutare un cambio di direzione. Inquadra il movimento. Osserva il momentum ponderato per tick volume e confronta la sua intensità con la storia recente. Individua accordi e diverge
Advanced Supply Demand MT5
Bernhard Schweigert
4.53 (15)
La migliore soluzione per qualsiasi principiante o trader esperto! Questo indicatore è uno strumento di trading unico, di alta qualità e conveniente perché abbiamo incorporato una serie di funzionalità proprietarie e una nuova formula. Con questo aggiornamento, sarai in grado di mostrare fusi orari doppi. Non solo potrai mostrare una TF più alta, ma anche entrambe, la TF del grafico, PIÙ la TF più alta: SHOWING NESTED ZONES. Tutti i trader di domanda di offerta lo adoreranno. :) Informazioni imp
Neuro Poseidon MT5
Daria Rezueva
4.68 (53)
Neuro Poseidon is a new indicator by Daria Rezueva. It combines precise trading signals with adaptive TP/SL levels - creating best possible trades as a result! Message me and get  Neuro Poseidon Assistant  as a gift to automize your trading process! What makes it stand out? 1. Proven profitability on all assets and timeframes 2. Only confirmed BUY and SELL signals present on the chart 3. Adaptive TP & SL levels generated by the software for each trade 4. Easy to understand - suitable for al
Trend Lines PRO MT5
Roman Podpora
5 (1)
LINEE DI TENDENZA PRO       Aiuta a capire dove il mercato sta realmente cambiando direzione. L'indicatore mostra reali inversioni di tendenza e punti in cui i principali attori rientrano. Vedi  Linee BOS   Cambiamenti di tendenza e livelli chiave su timeframe più ampi, senza impostazioni complesse o rumore inutile. I segnali non vengono ridisegnati e rimangono sul grafico dopo la chiusura della barra. VERSIONE MT 4     -      Svela il suo massimo potenziale se abbinato all'indicatore   RFI LEVE
Altri dall’autore
SMC Visual indicator MT4
Gabriel Balbino De Oliveira
SMC Visual Indicator – Trade Like Smart Money Most traders spend hours trying to identify market structure, liquidity zones, Fair Value Gaps, and potential reversals. By the time they finish their analysis, the market has already moved. SMC Visual Indicator v6 does the hard work for you. Built around advanced Smart Money Concepts (SMC) and ICT methodologies, this indicator automatically identifies the key areas where institutional traders leave their footprints. Imagine opening your chart and in
Price Action Alpha Pro
Gabriel Balbino De Oliveira
PRICE ACTION PRO v4. 90 — The Smart Chart Pattern Scanner for MetaTrader 4 Transform how you analyze the market with Price Action Pro v4. 90, the most advanced version of this powerful indicator that automatically detects key chart patterns and trend reversal or continuation signals in real time. Forget spending hours analyzing charts manually. Price Action Pro continuously scans the market and highlights high-probability opportunities directly on your chart — now featuring context validation
Price Action Alpha Pro MT4
Gabriel Balbino De Oliveira
PRICE ACTION PRO v4. 90 — The Smart Chart Pattern Scanner for MetaTrader 4 Transform how you analyze the market with Price Action Pro v4. 90, the most advanced version of this powerful indicator that automatically detects key chart patterns and trend reversal or continuation signals in real time. Forget spending hours analyzing charts manually. Price Action Pro continuously scans the market and highlights high-probability opportunities directly on your chart — now featuring context validation
AlphaTrend Pullback Pro mt4
Gabriel Balbino De Oliveira
AlphaTrend Pullback Pro MT4 Trend-following pullback signals, economic news filter, and professional dashboard — all in one indicator. AlphaTrend Pullback Pro transforms trend and correction analysis into clear, actionable visual signals. It identifies the macro market direction on a higher timeframe, waits for a pullback to the moving average, confirms rejection with a trend-aligned close, and triggers the entry point. No repainting on closed bars, no noise, no complexity. Why AlphaTrend Pullba
Correlation Radar pro MT4
Gabriel Balbino De Oliveira
Correlation Radar PRO — Multi-Asset Correlation Dashboard for MetaTrader 4 Short Description: Eliminate market noise and spot price divergences in seconds. Correlation Radar PRO calculates historical, monthly, weekly, and real-time correlations across multiple assets and lets you overlay candles directly on your chart without switching your main symbol. Full Description: Manually switching charts to understand inter-market relationships wastes precious time and leads to missed setups. Correlatio
NexusFlow MTF Pro MT4
Gabriel Balbino De Oliveira
NexusFlow MTF Pro MT4 — The Ultimate Multi-Timeframe Power for MetaTrader 4 Tired of trading on the M5 or M15 timeframe only to realize too late that the H1 or H4 trend was completely against your entry? Lost count of how many times you had to open multiple windows, constantly switch charts, or clutter your screen with confusing indicators just to align the market direction? NexusFlow MTF Pro MT4 was engineered specifically to eliminate this operational friction and elevate your flow and trend a
TriSync MT4
Gabriel Balbino De Oliveira
TriSync User Manual Market Structure Indicator for MetaTrader 4 · Version 0.40 1. What It Is TriSync shows market structure in layers on a single chart: four nested swing levels, VWAP anchored to swing highs and lows, Daily VWAP, higher-timeframe support and resistance, three-timeframe bias, and confirmed entry arrows on closed bars. The core idea is a reading order: Location first. Context second. Timing last. The arrow is step 3, never step 1. What it is not: it is not a robot, not a blind sig
QuantVortex Gold Alpha V13
Gabriel Balbino De Oliveira
QUANT VORTEX ELITE V13 — The XAUUSD (Gold) Specialist QuantVortex Elite V13 is a high-performance algorithmic trading framework specifically engineered for XAUUSD (Gold) on the M30 (Highly Optimized) and H1 timeframes. Developed for professional traders, asset managers, and prop firm evaluators, this advanced automated system combines the precision of multi-period momentum analysis with a proprietary structural filtering architecture named the Luminus Engine . Unlike common grid or martingale
Luminus Gold Pro
Gabriel Balbino De Oliveira
Luminus PRO – High-Performance Quantitative Algorithm Luminus PRO is a fully automated Expert Advisor (EA) engineered for traders and investors seeking institutional consistency and mathematical precision in global financial markets. By combining macro trend tracking with dynamic volatility layers, this EA executes trades surgically, maximizing profit potential while keeping risk under strict control. Forget strategies that rely on luck. Luminus PRO is built purely on statistical data and ra
Luminus Market Regime PRO
Gabriel Balbino De Oliveira
Luminus Market Regime PRO — Know WHAT the Market Is Before You Trade Stop trading setups in the wrong context. The Luminus Market Regime PRO tells you exactly what the market is doing — before you place a single order. The Problem Every Trader Faces Most indicators answer "where is price going?" The Luminus Market Regime PRO answers the more important question: "Is it worth trading right now?" Losses come not from bad signals — but from trading a good signal in the wrong market environment.
Nexus Prime AIO
Gabriel Balbino De Oliveira
Nexus Quantum AIO – Your Ultimate Trading GPS Tired of messy charts and confusing signals? Most traders fail because they operate in the dark, guessing where the price will go. Nexus Quantum AIO is a complete visual decision-making system. It takes complex institutional calculations and translates them into simple colors and signals on your screen. What does it do for you? The Market Traffic Light: It colors your candles and background. Green (Strong Uptrend), Red (Strong Downtrend), and Gray (S
SupResAI Market Pro
Gabriel Balbino De Oliveira
Elevate your trading to an institutional level. SupRes AI v7 is the ultimate all-in-one indicator for MetaTrader 5, engineered to map the market in real-time with mathematical precision. Say goodbye to time-consuming manual analysis; this dashboard centralizes everything you need for fast, profitable execution directly on your chart. Key Features: Dynamic Support & Resistance: Advanced algorithm that identifies and clusters high-relevance price zones, featuring a retest counter (level strength
SMC Visual indicator
Gabriel Balbino De Oliveira
SMC Visual Indicator v6 – Trade Like Smart Money Most traders spend hours trying to identify market structure, liquidity zones, Fair Value Gaps, and potential reversals. By the time they finish their analysis, the market has already moved. SMC Visual Indicator v6 does the hard work for you. Built around advanced Smart Money Concepts (SMC) and ICT methodologies, this indicator automatically identifies the key areas where institutional traders leave their footprints. Imagine opening your chart and
UpPulse
Gabriel Balbino De Oliveira
UpPulse Gaussian Signal – Master Trends with Mathematical Precision Are you tired of false breakouts and lagging indicators that get you into trades when the move is already over? Discover UpPulse Gaussian Signal , a high-performance indicator for MetaTrader 5 (MT5) engineered for traders who demand surgical precision and statistical validation before risking capital. UpPulse combines the advanced smoothing power of a Gaussian Filter (ALMA Core) with the institutional momentum tracking of the AD
AngleMeter Pro
Gabriel Balbino De Oliveira
Turn market slope into your greatest trading advantage! Tired of lagging and subjective indicators? AngleMeter Pro is here to revolutionize your chart analysis in MetaTrader 5. Powered by advanced trigonometry and statistical linear regression, it measures the exact trend angle in real time using a striking visual protractor with a continuous color gradient. Featuring dual-timeframe support for macro context analysis, dynamic bisection channels, an embedded normalized mini-chart, and an interact
AlphaTrend Pullback Pro
Gabriel Balbino De Oliveira
AlphaTrend Pullback Pro Trend-following pullback signals, economic news filter, and professional dashboard — all in one indicator. AlphaTrend Pullback Pro transforms trend and correction analysis into clear, actionable visual signals. It identifies the macro market direction on a higher timeframe, waits for a pullback to the moving average, confirms rejection with a trend-aligned close, and triggers the entry point. No repainting on closed bars, no noise, no complexity. Why AlphaTrend Pullbac
CorrelationRadarPRO
Gabriel Balbino De Oliveira
Correlation Radar PRO — Multi-Asset Correlation Dashboard for MetaTrader 5 Short Description: Eliminate market noise and spot price divergences in seconds. Correlation Radar PRO calculates historical, monthly, weekly, and real-time correlations across multiple assets and lets you overlay candles directly on your chart without switching your main symbol. Full Description: Manually switching charts to understand inter-market relationships wastes precious time and leads to missed setups. Correlatio
NexusFlow MTF Pro
Gabriel Balbino De Oliveira
[MT5] NexusFlow MTF Pro | Display up to 50 moving averages from higher time frames without switching time frames. Supports crossover alerts. NexusFlow MTF Pro is an MT5 indicator that allows you to overlay moving averages from any time frame—such as “daily,” “4-hour,” or “1-hour”—on your current chart. For example, while viewing a 30-minute chart, you can simultaneously check the 20-period MA on the daily chart or the 50-period MA on the 4-hour chart. This eliminates the need to open and compar
Sidus Pro
Gabriel Balbino De Oliveira
Sidus Pro for MetaTrader 5: The Ultimate Evolution of the Classic Sidus Method Turn your trend analysis into a true statistical edge. Sidus Pro reinvents the renowned moving average crossover and volatility channel method, combining mechanical precision, visual automation, and macroeconomic intelligence into a single professional interface. Forget amateur indicators that repaint past data or generate blind noise in sideways markets. Sidus Pro is engineered under rigorous MQL5 standards to delive
Puria Pro
Gabriel Balbino De Oliveira
PURIA METHOD PRO MT5 — The Ultimate Evolution of the Classic Puria Strategy Tired of lagging indicators, repainting arrows, or false signals that drain your account? Puria Method Pro was engineered for serious traders looking for surgical precision, visual automation, and robust trading logic. Built upon the world-renowned Puria Method (EMA 5 crossing the dual LWMA 75/85 Low channel) combined with a fast MACD (15, 26, 1) filter , this PRO edition turns a classic institutional strategy into a
TriConfluence Pro
Gabriel Balbino De Oliveira
TriConfluence Pro: The End of False Breakouts and Blind Speculation Tired of losing money to fake signals, lagging indicators, and choppy sideways markets? Most traders fail because they trade market noise instead of true price structure. TriConfluence Pro is built upon a rigorous triple-confluence methodology. It eliminates guesswork by combining three of the market's most powerful and respected tools— Bollinger Bands, RSI, and ADX —into a smart, automated dashboard right on your MetaTrader cha
Filtro:
Nessuna recensione
Rispondi alla recensione