TriSync MT4

TriSync User Manual

Market Structure Indicator for MetaTrader 4 · Version 0.40

1. What It Is

TriSync shows market structure in layers on a single chart: four nested swing levels, VWAP anchored to swing highs and lows, Daily VWAP, higher-timeframe support and resistance, three-timeframe bias, and confirmed entry arrows on closed bars.

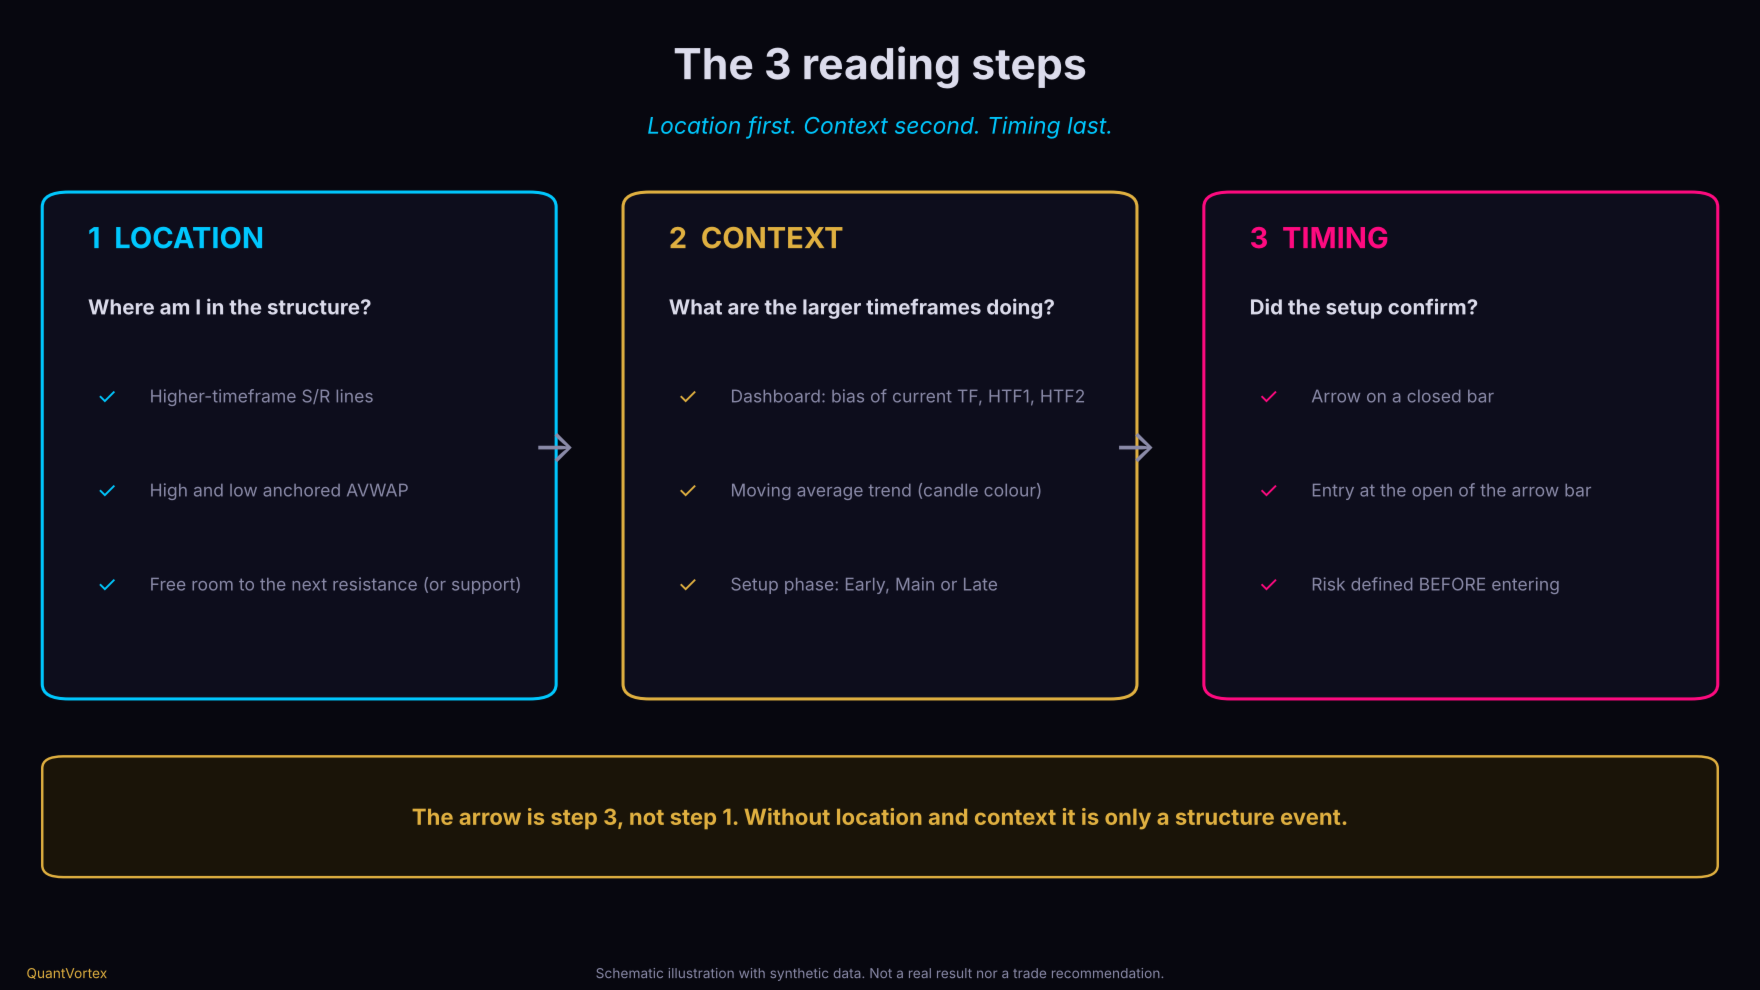
The core idea is a reading order: Location first. Context second. Timing last. The arrow is step 3, never step 1.

What it is not: it is not a robot, not a blind signal service, it does not send stop loss or take profit, and it does not promise results. It is a market-reading tool: it organizes the information, while the decision and risk remain entirely yours.2. The 3 Reading Steps (Figure 4)

  • Step 1 — Location. Where is price relative to structure? Look at higher-timeframe support and resistance lines, AVWAP, and the last swing high or low. A buy near support, with clear room to the next resistance, is very different from a buy stuck right against resistance.

  • Step 2 — Context. What are the higher timeframes doing? Read the dashboard: current TF bias, HTF1 and HTF2, the moving average trend color, and the setup phase (Early, Main, or Late).

  • Step 3 — Timing. Only after the first two steps, the arrow confirms that the setup has formed and a bar has closed in favor of the direction.

If steps 1 and 2 are not in favor, the arrow alone is not a reason to enter.

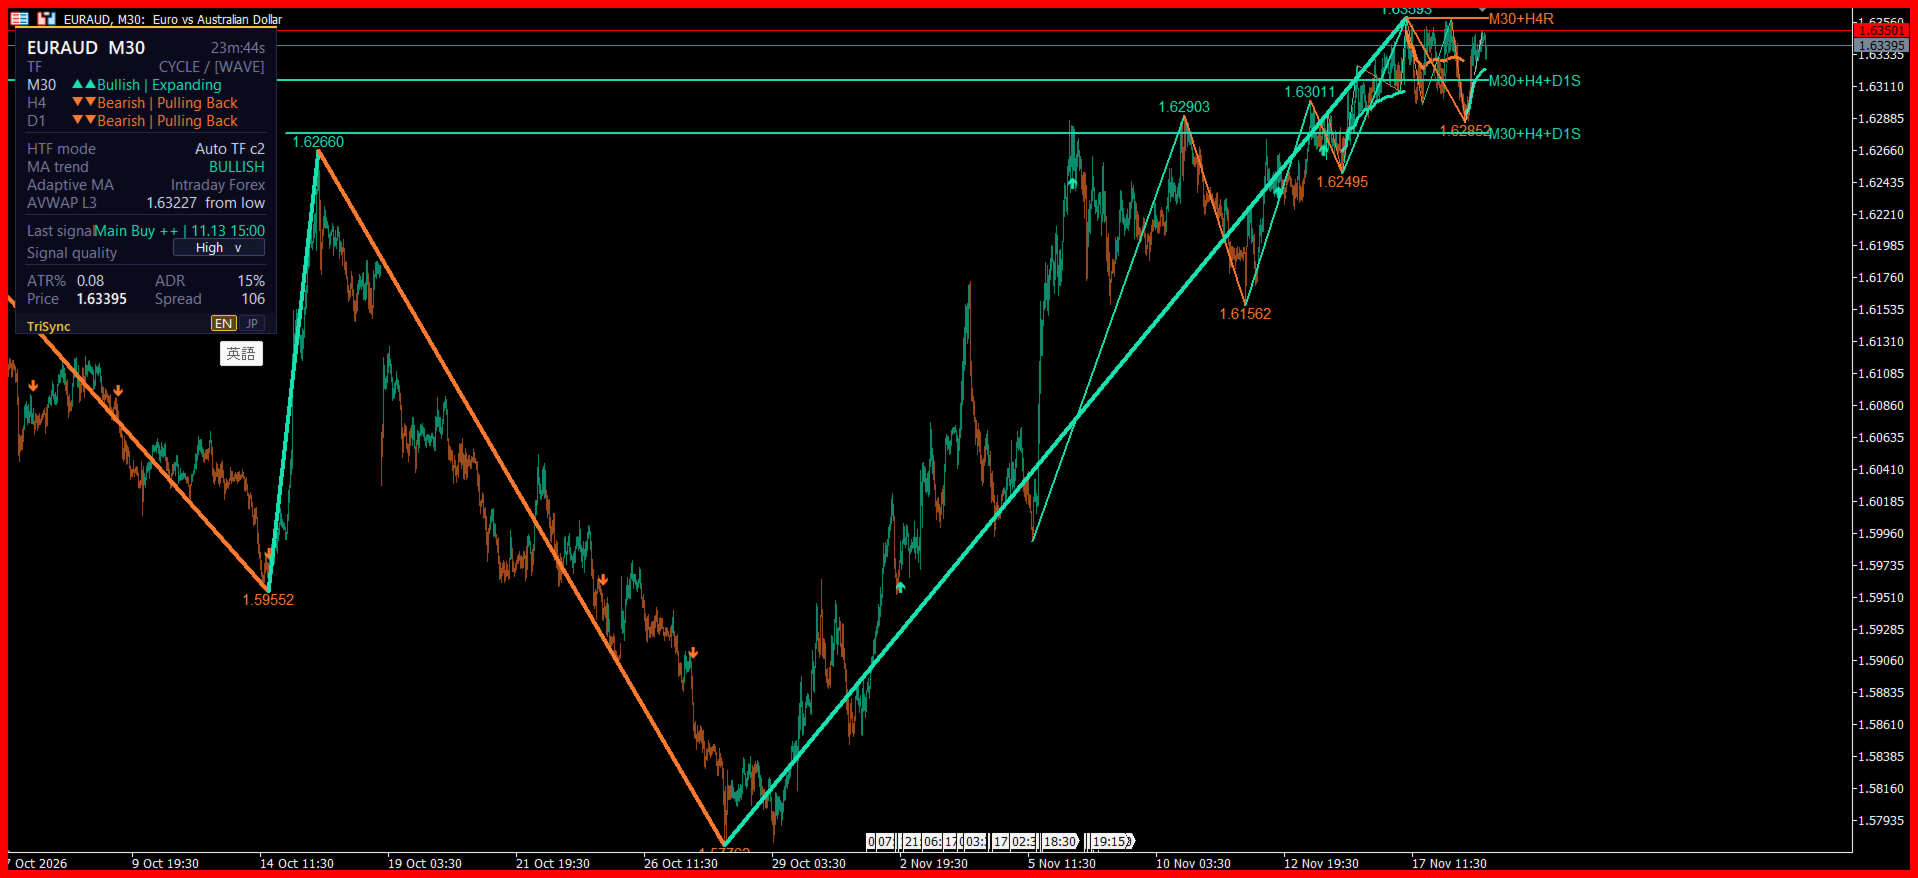
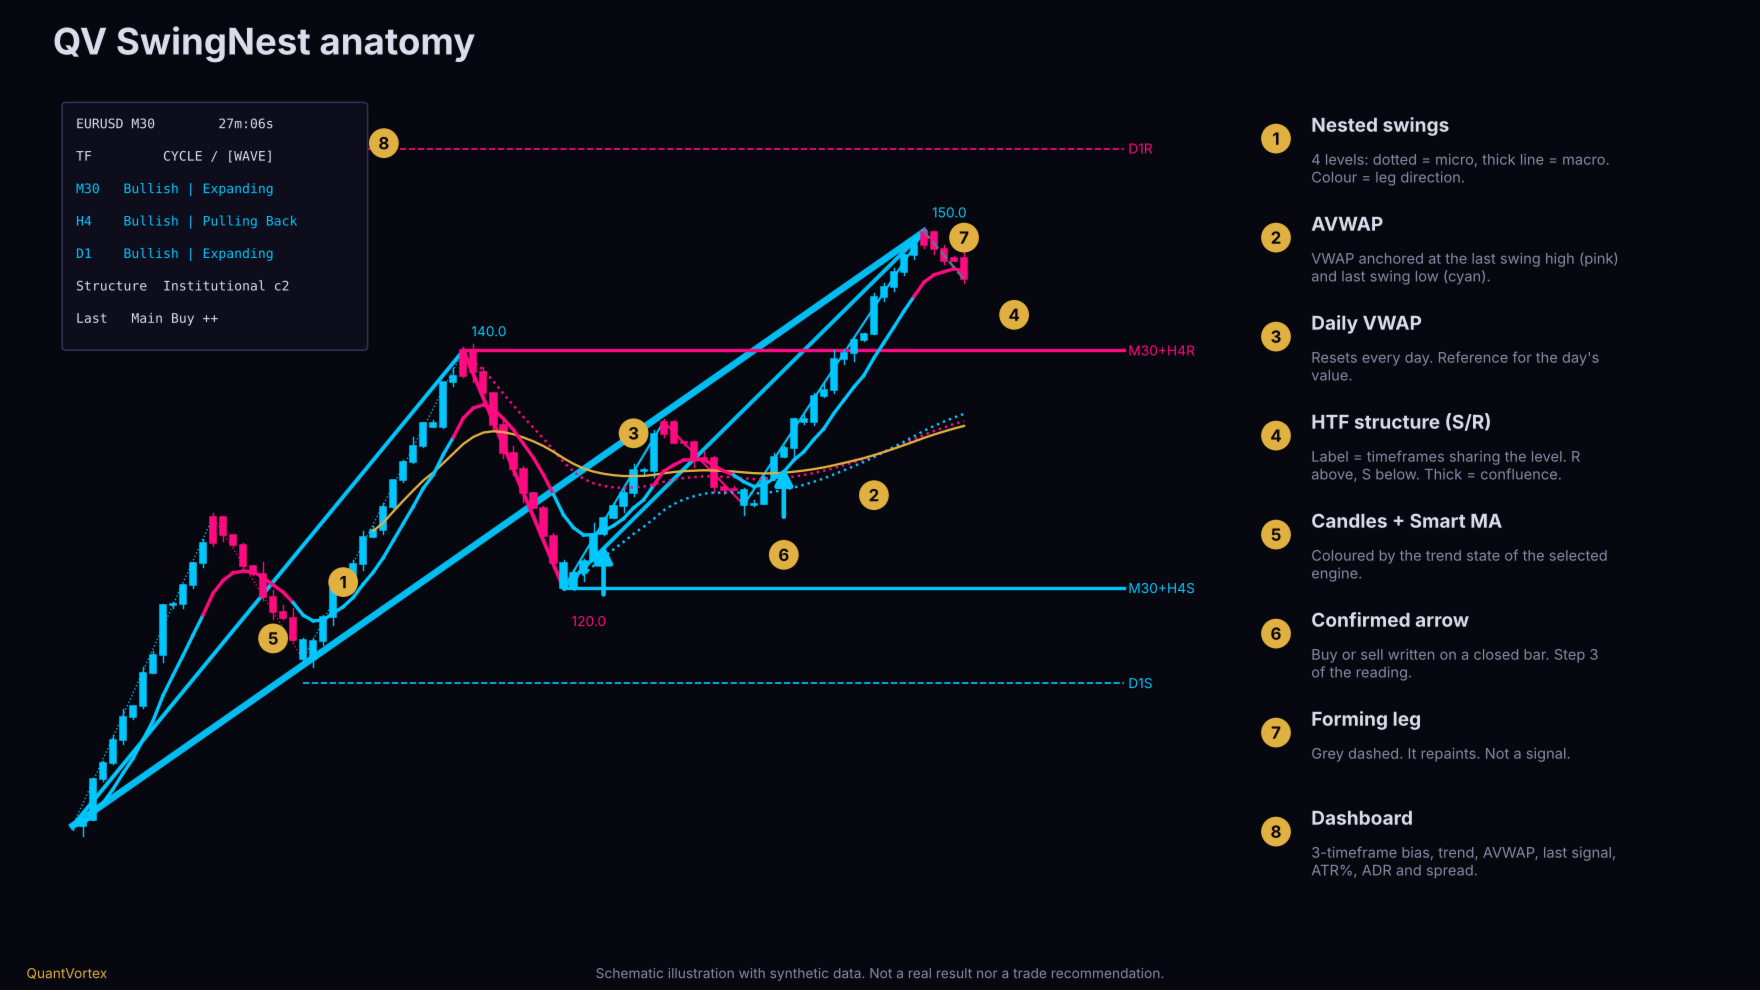
3. What You See on the Chart (Figure 1)

  • Nested Swings (4 levels): Level 1 is the minor structure (thin dotted line); levels 2, 3, and 4 move up to the macro (thicker lines). Levels 3 and 4 show the pivot price. Color indicates leg direction: cyan goes up, pink goes down (default theme).

  • Gray Dashed Leg: The forming leg, still unconfirmed. It moves with price and repaints. It is not a signal.

  • AVWAP (two dotted lines): One anchored to the last swing high (pink) and another to the last swing low (cyan), at the chosen level (default: level 3). Use as a value reference: where volume-weighted average price is since that pivot. Not a trigger.

  • Daily VWAP (gold line): VWAP that resets every day based on server time.

  • Higher-Timeframe Structure Lines: Horizontals labeled like M30+H4S : the timeframes sharing that level, followed by R (level above price, resistance) or S (level below price, support). Solid and thick lines mean confluence of 2 or more timeframes; dashed and thin means one. Nearby zones are automatically merged.

  • Colored Candles and Smart MA Line: Colored by the trend state of the chosen engine (cyan bullish, pink bearish, gray neutral).

  • Arrows: Up arrow below the candle: buy. Down arrow above the candle: sell.

4. Reading the Dashboard (Figure 5)

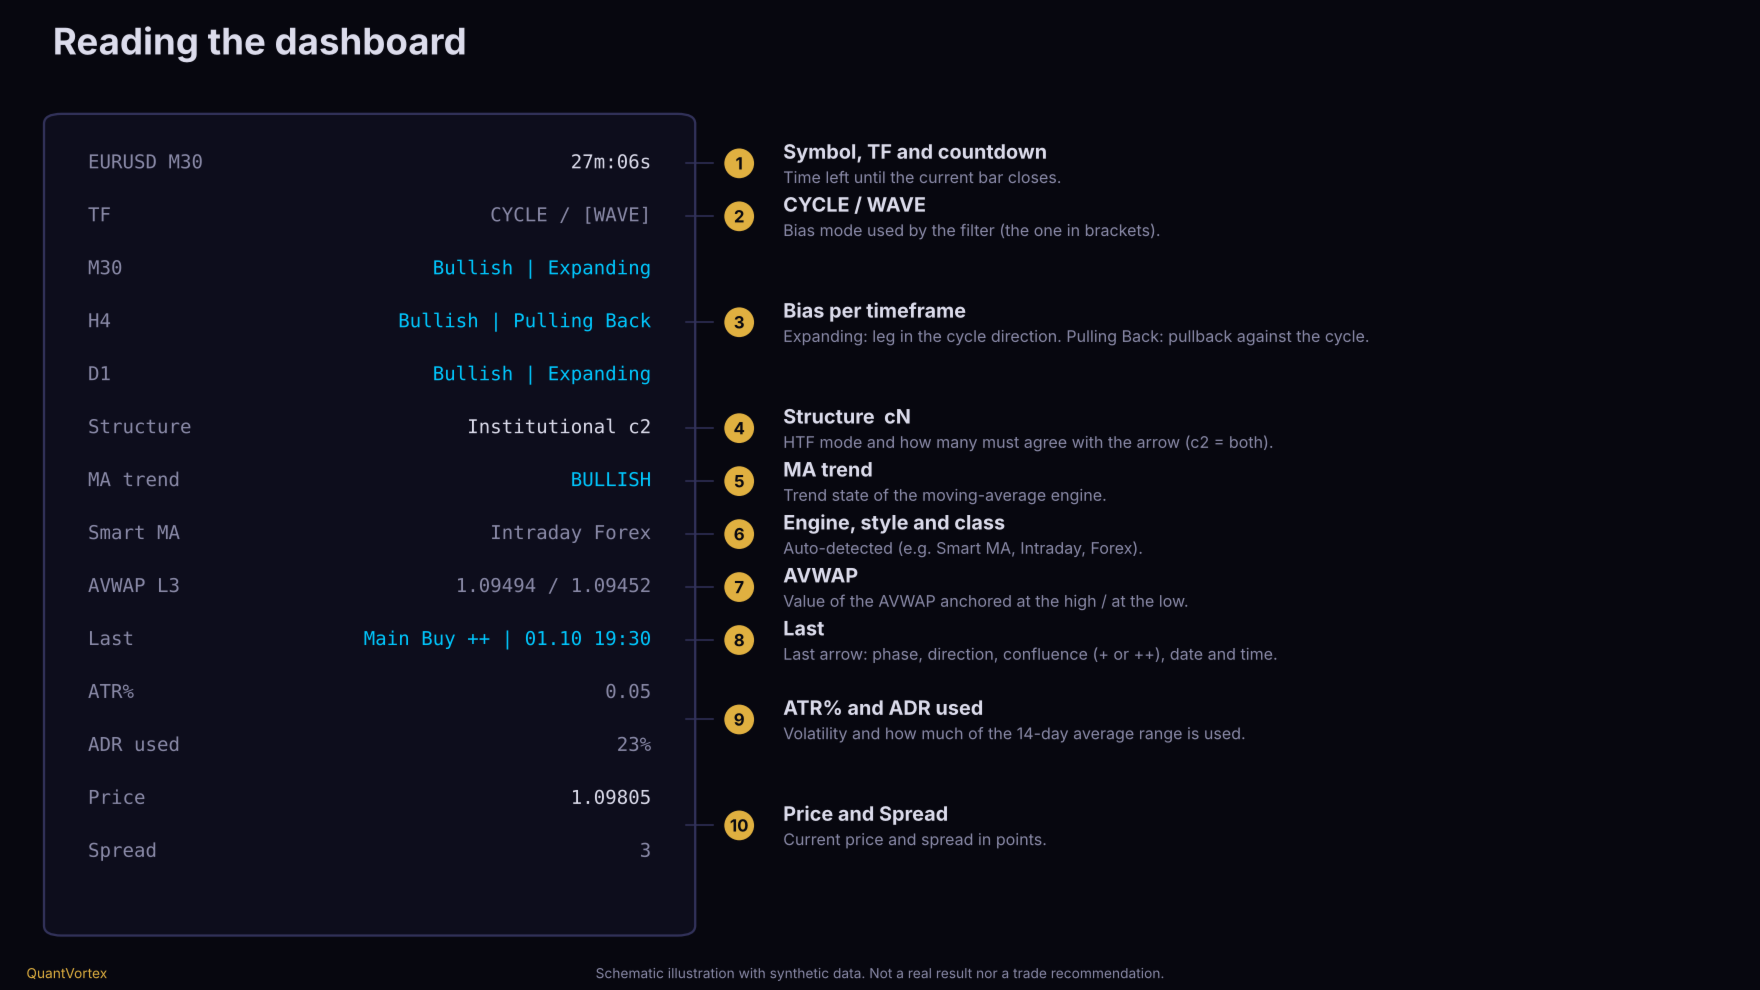
  • Symbol, timeframe, and countdown to the current bar close.

  • TF — CYCLE / WAVE: Shows which bias mode the filter uses (in brackets). Wave is reactive (last leg direction); Cycle is stricter (higher highs and higher lows, or lower lows and lower highs).

  • Current TF, HTF1, and HTF2 lines: Cycle bias and current leg state. Expanding: the current leg moves in the cycle direction. Pulling Back: the current leg is a correction against the cycle. Example: Bullish | Pulling Back is an uptrend in correction.

  • Structure: Higher-timeframe resolution mode and how many HTFs must agree with the arrow (e.g., c2 means both must agree).

  • MA trend: Trend state of the chosen moving average engine.

  • Engine line: Name of the engine, style, and detected asset class (e.g., Smart MA, Intraday, Forex).

  • AVWAP: Values of AVWAP anchored at the top and bottom.

  • Last: Last signal: phase, direction, confluence (+ or ++), and timestamp.

  • ATR%: ATR divided by price, in %. ADR used: How much of the 14-day average daily range today's range has consumed. Price and Spread.

5. How to Trade (Figure 2)

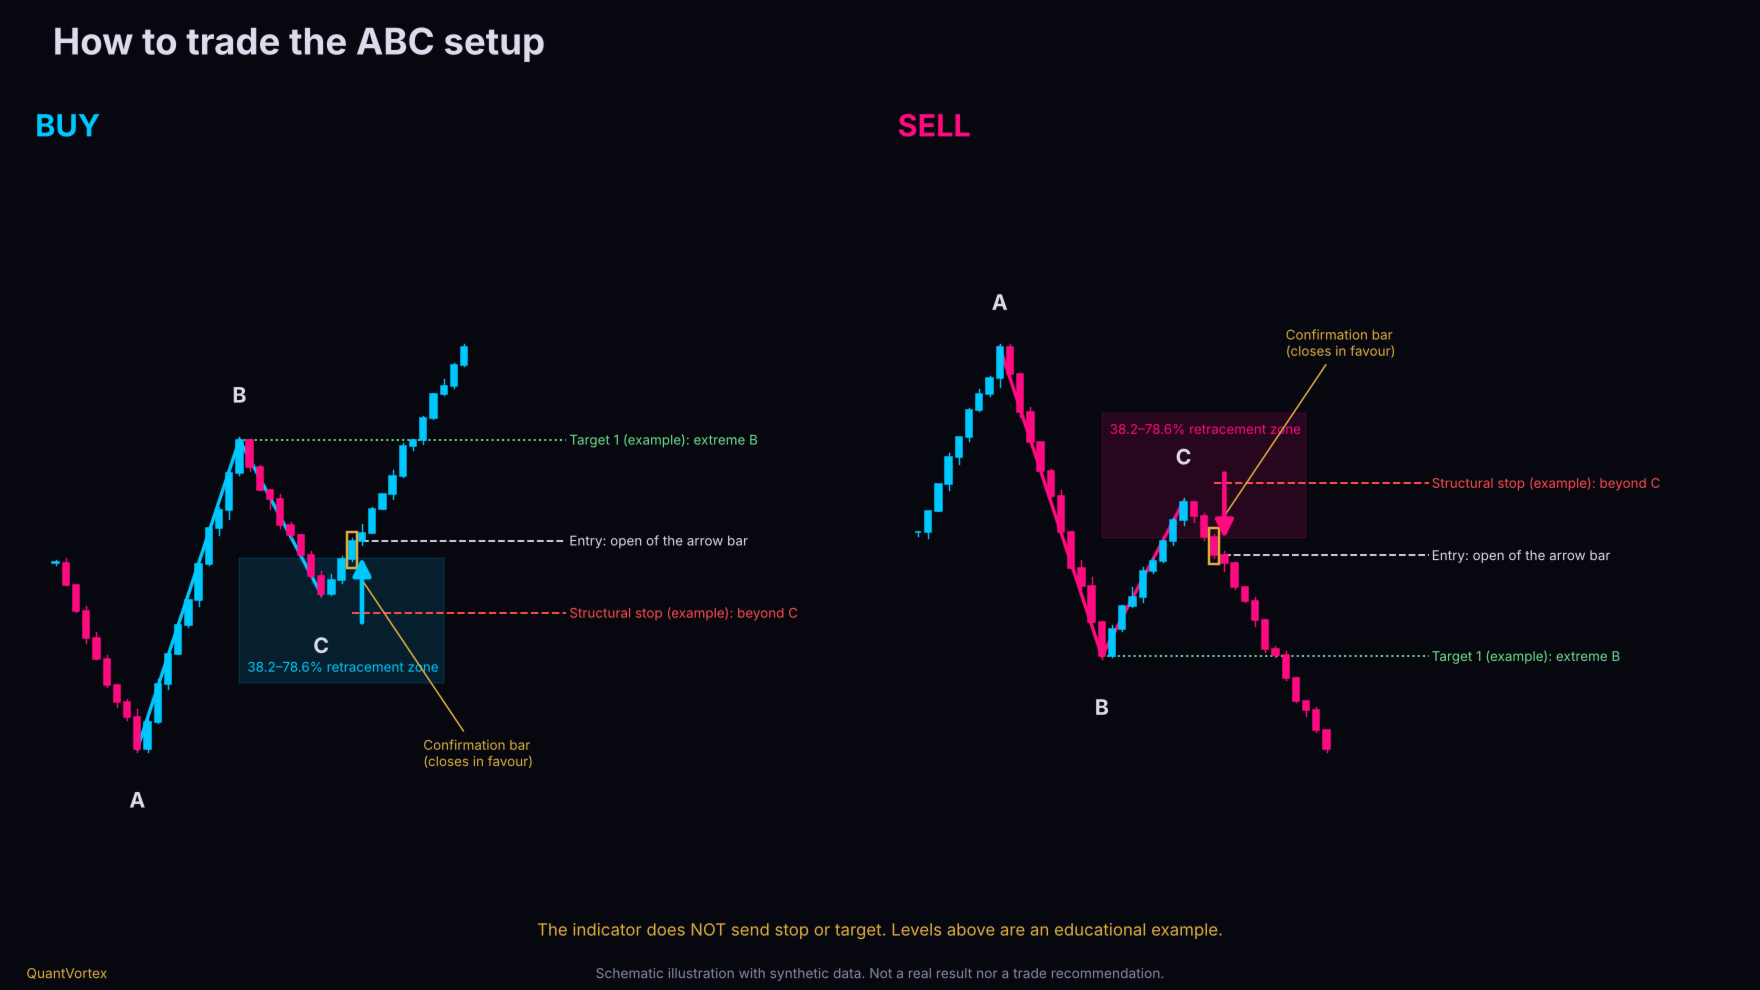
The setup is an ABC pullback pattern: A is a pivot, B is the next pivot (leg A→B), and C is the pullback. The setup is only valid if C retraced between 38.2% and 78.6% of leg A→B, C did not lose the level of A, and leg A→B has at least 2.5 ATR. The arrow only appears after price reverses from C enough to confirm the pivot, and is printed at the open of the next bar.

Buy Checklist

  1. Location: Is price near support (label ending in S) or bottom AVWAP, with room to the next resistance (R)?

  2. Context: Are HTF1 and HTF2 consistent with the buy? (with c2 , the arrow only appears when both agree). Is the MA trend cyan?

  3. Phase: Early or Main are typical resumption scenarios. Late demands caution (see section 6).

  4. Timing: Up arrow. Entry is at the open of the bar where the arrow was printed.

  5. Risk: Define before entering. A reference example is a stop below the C low (structural stop) and the first target at the B high or nearest higher-timeframe resistance. The indicator does not send stops or targets: the example is educational, and position sizing by fixed risk is your decision.

Sell

Mirrored: down arrow, resistance above price as location, bearish HTFs, stop above the C high.

What to Expect from Entry

You enter after pivot C is confirmed, so you do not catch the exact bottom or top. This is a design choice: it avoids arrows in the middle of movement, but costs part of the leg. How much of the move has already been consumed is a question your own testing must answer (see section 11).

6. Early, Main, and Late Phases (Figure 3)

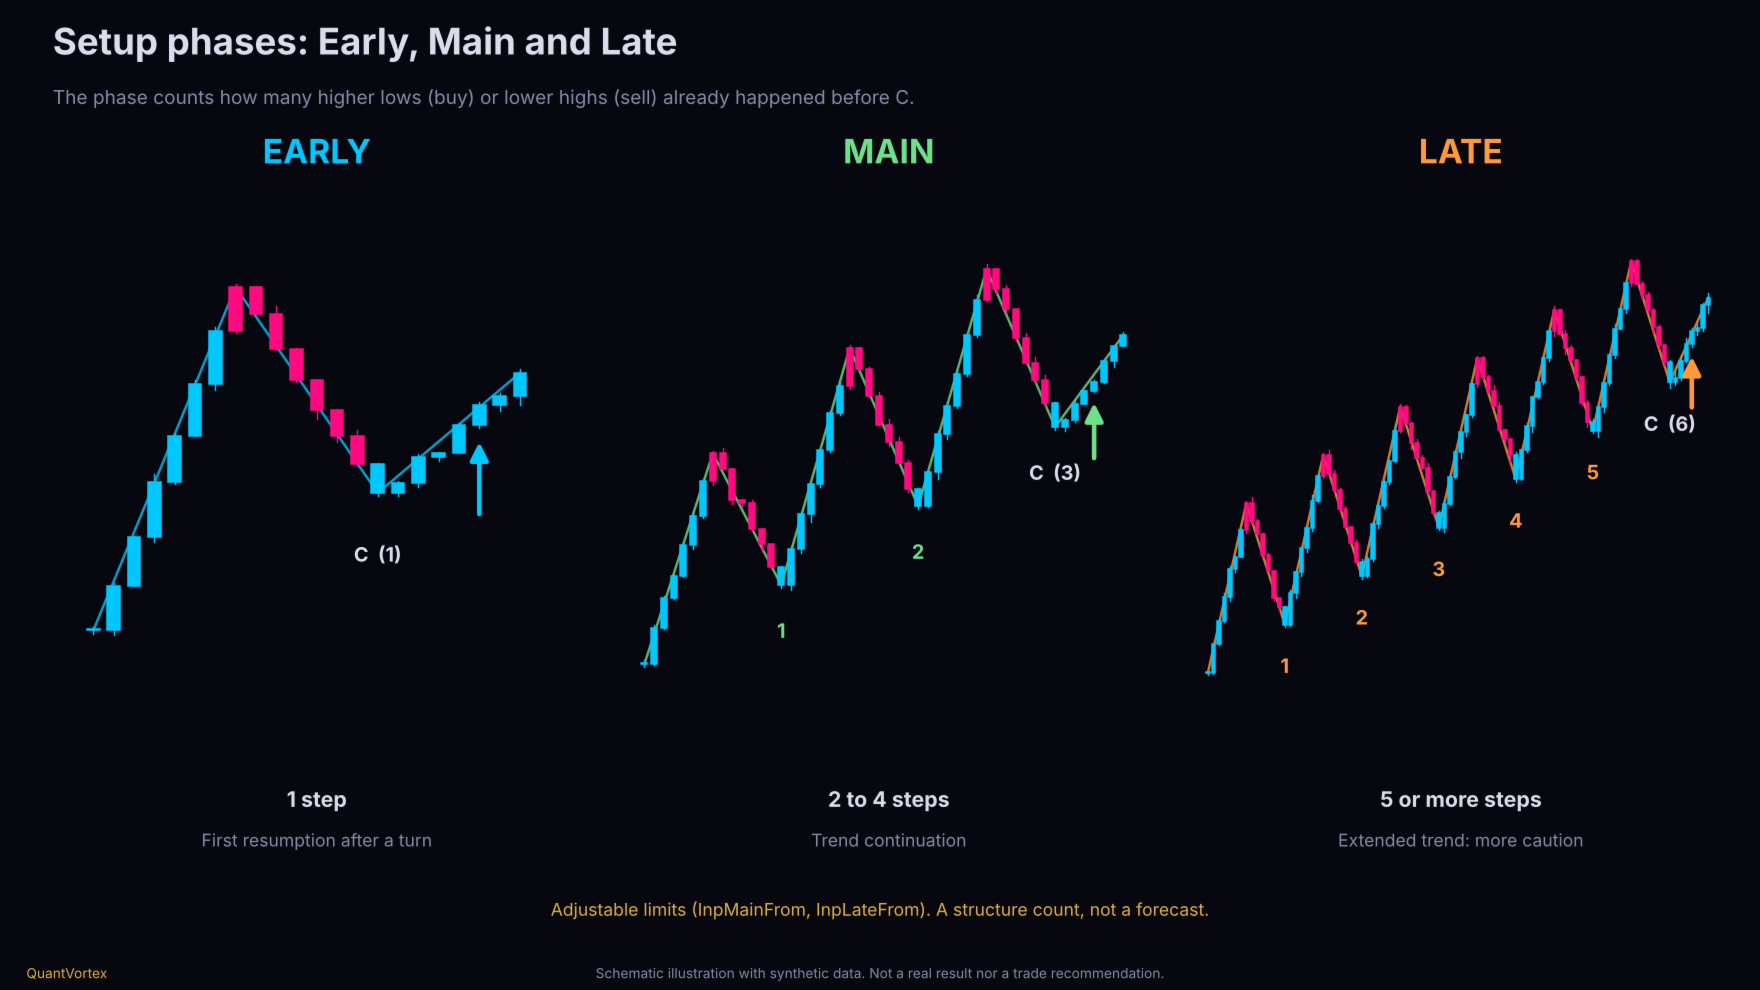
The phase counts how many consecutive trend-aligned highs or lows exist before pivot C (how many impulse steps have occurred):

  • Early: 1 step. First resumption after a turn.

  • Main: 2 to 4 steps. Trend continuation.

  • Late: 5 or more steps. Extended trend, higher exhaustion risk.

Limits are adjustable (InpMainFrom and InpLateFrom ), and each phase can be disabled. It is a structural count classification, not a prediction. Verify with your data whether it makes a difference on your asset.

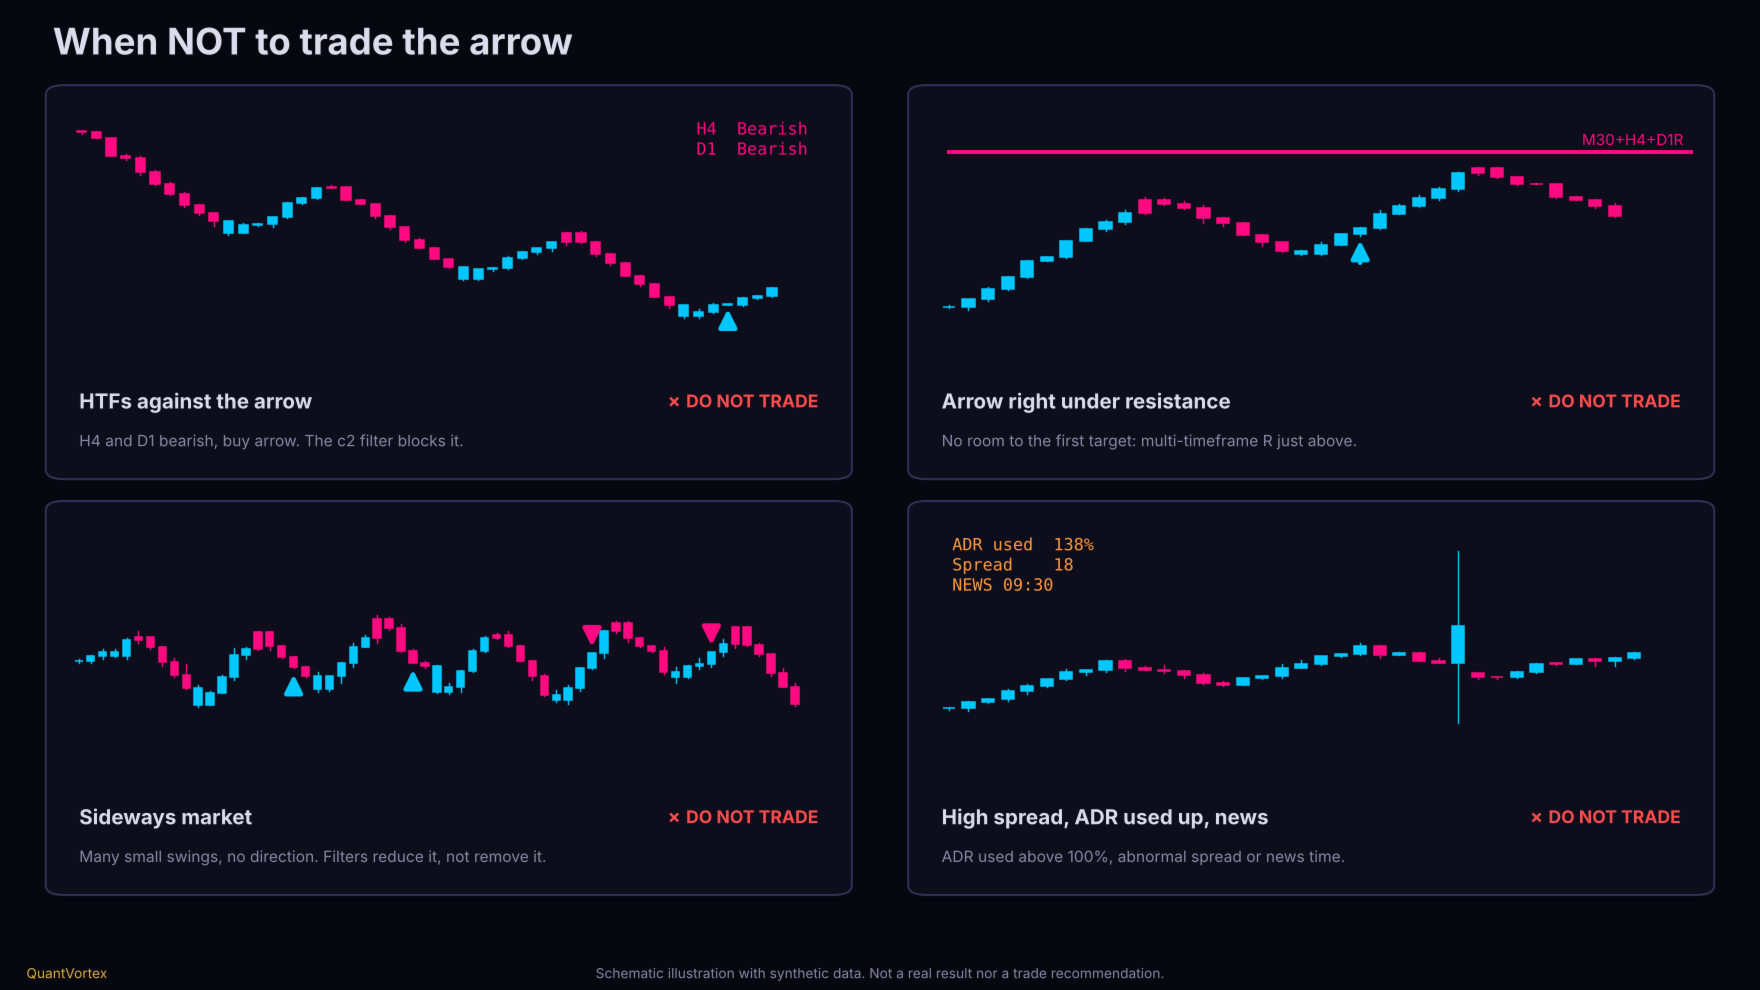
7. When Not to Trade (Figure 6)

  • Higher timeframes against the arrow: The default filter (c2 ) blocks these. If relaxed, know you are trading against context.

  • Arrow stuck right against resistance (or support for sells) from multiple timeframes: No room to the first target.

  • Ranging market: Many small, directionless swings. Minimum leg size and cooldown filters reduce noise, but don't eliminate it.

  • High spread, ADR consumed (>100%), or news times: Dashboard shows spread and ADR used.

  • Dashed leg: It repaints and is not a signal.

8. Configuration

Auto Configuration

  • Style by timeframe: Scalping (up to M5), Intraday (M15 to M30), Intraweek (H1 to H3), Swing (H4+). Also GANN (3-bar swing) and Manual.

  • Asset class by symbol: Forex, Metal, Index, Crypto, Energy, Stock. B3 contracts WIN and WDO are recognized by prefix.

  • Style and class adjust swing sensitivity (reversal in ATR multiples). These values are starting points, not calibrated values: test on your asset.

Higher Timeframes (Institutional Ladder)

Chart TF HTF1 HTF2
M1 M5 M15
M5 M15 H1
M15 H1 H4
H1 H4 D1
H4 D1 W1
D1 W1 4 weeks

Higher candles are built from chart candles (synthetic engine) using server time blocks, maintaining identical results for identical history. Also available: Absolute TF (you choose both) and Fixed Ratio Cascade (x2, x3, x4, or x6).Main Parameters

Parameter Default Purpose
InpStyle / InpClass Auto Style and asset class
InpEngine Smart MA Trend engine (Smart MA, EMA, or conservative)
InpBiasMode Wave Wave (reactive) or Cycle (stricter)
InpMinConf 2 Higher timeframes that must agree (0 to 2)
InpMinLegATR 2.5 Minimum leg size A→B in ATR
InpCooldown 12 Minimum bars between same-direction arrows
InpQuality Standard Strict requires strong confirming bar and close beyond previous bar
InpAvwapLvl 3 Swing level anchoring AVWAP
InpMaxBars 3000 Bars analyzed (fewer bars = lighter)
InpID A Use different IDs when running multiple instances on the same chart

9. Alerts

Popup, sound, and push notifications can be toggled separately. 

추천 제품
Fibonacci Trend Marker
Grigoriy Malychenko
Fibonacci Trend Marker   — is a trend indicator that analyzes the behavior of the current candle relative to the High-Low (HL) range of previous candles using Fibonacci retracement levels. It visually tracks trend strength, signaling potential weakening or reversal through a change in candle color. Features: Designed for trend-focused traders, it helps quickly identify trend changes based on Fibonacci levels. Effective on any timeframe with sufficient market volatility, when a sequence of 3–5 c
XFibo Auto Fibonacci
Welinton Dos Reis Goncalves
5 (1)
Use with disciplined risk management. Fibonacci entry system based on the golden zone 38.2 - 61.8 where the entry is confirmed at 23.6 with indications of Take Profit 3:1. Automatically plotted Fibonacci contains retracement and expansion Fibonacci in a single indicator. Up to 77% win rate with this system. FTMO challenge pass with 0.50% risk and 1.50% R:R.
Moving pivot Average Fibonacci The  indicator compares the selected period with its counterpart from the previous period. The indicator determines the moving Fibonacci levels for the day or any time interval to assess the price movement range from the time average. The indicator helps predict the expected high or low for the day based on historical time data. The pivot line can be considered an average trend line and use it in a variety of trading strategies. If you have any question about the
Signal Eskiya
Vitalii Zakharuk
Signal Eskiya, in addition to channel lines, reflects entry signals in the form of arrows. Trading strategies using the channel indicator belong to the classic methods of technical analysis, are easy to execute, and therefore available even to beginners. Price ranges work equally well on any trading assets and timeframes, they can be used both independently and with additional confirmation from oscillators and market volumes. American traders say: “Trend is your friend”, which means “Trend is
I will support only my client. สำหรับลูกค้า Parameters General Trade Settings Money Management  Lot : Fixed (can change) Strategies  - H4 Strategies it is fixed with MA, Bollinger band, Candlestick Levels Close Functions  - H4 Strategies MagicNumber  - individual magic number. The EA will only manage position of the chart symbol with this magic number. NextOpenTradeAfterMinutes  - 15 minutes is default, can change it MaxSpread  - upto currency pairs, MaxSlippage  - upto currency pairs, Push No
Indicador de Fibonacci Semanal para MT4 Maximize suas operações no mercado financeiro com o Indicador de Fibonacci Semanal para MetaTrader 4 (MT4) , a ferramenta essencial para traders que buscam identificar pontos estratégicos de suporte e resistência com base na ação do preço da última semana. Principais Recursos: Atualização Automática : O indicador recalcula os níveis de Fibonacci automaticamente a cada novo candle semanal. Níveis Personalizados : Traça apenas os níveis essenciais de Fibonac
FREE
B Clode
Hong Ling Mu
Trading XAUUSD is a double-edged sword. Its massive volatility offers incredible profit potential, but it also carries significant risk for those without a disciplined strategy. Today, I am excited to introduce my latest automated trading system: B Clode . Built specifically for the XAUUSD H1 timeframe , B Clode was engineered to harmonize high-frequency grid trading with intelligent risk management. 1. Why B Clode for XAUUSD? Gold is notorious for its "noise." By focusing on the H1 timeframe
FREE
Transition Trend
Tatiana Savkevych
The Transition Trend indicator shows the points of potential market reversal. The indicator's smart algorithm detects the trend, filters out market noise and generates entry signals and exit levels. Simple, visual and efficient trend detection. Uses just one parameter for settings. The indicator does not redraw and does not lag. You can set up message alerts as sound or email. Works on all currency pairs and all timeframes. Ready-made trading system.
Master Phi
Chantal Sala
Master Phi is an indicator based on Fibonacci numbers. It analyzes the percentage values returning the proportion of the Golden Section. You can customize values and set custom levels so you will create your personal Trading. The attention on the minimums and the maximums of timeframes allows accurate analysis in order to intercept very precisely the trading levels after the various impulse movements. Input Values Time_Frame to analyze LEVELS SETTINGS 9 levels (in percentage) 9 colors LINE SETT
Fibo label
Damir Satridinov
5 (2)
Индикатор рисует уровни Фибоначчи с выделенными Ценовыми метками.При установке индикатора на график необходимо создать трендовую линию с именем указанным в поле" Unique name of trend line to place fib on ". По умолчанию имя=" Unique name of trend line to place fib on"  =     "+"    .В индикаторе можно заменить уровни фибоначчи по своему усмотрению.Также меняются цвет,стиль,толщина линий и т. д.
FREE
Dear Trader It is my pleasure to introduce to you my tool called the " Forex Sniper Indicator" . The major aim of this tool is to help serious traders and investors in all type of Financial Markets to catch price next movement right at the moment the price direction is about to change. This tool can be used to snipe the price direction in both down trend, uptrend and ranging markets. This tool can be used as the stand alone tool though it may be combined with other tools as well. My goal is to h
Alphabet AI MT4
Sergei Pomytkin
알파벳 AI는 평균 회귀 전략을 기반으로 하는 어드바이저입니다. 즉, 시장의 자연스러운 특성인 큰 변동 후 평균값으로 회귀하는 특성을 활용합니다. 이 알고리즘은 자산의 현재 가격을 지속적으로 분석하여 계산된 평균값과 비교합니다. 가격이 평균값에서 크게 벗어나면 어드바이저는 이를 행동 신호로 해석합니다. 상한선을 초과하면 가격 하락을 예상하여 숏 포지션을, 하한선 아래로 떨어지면 가격 상승을 예상하여 롱 포지션을 취합니다. 저희 어드바이저의 특징은 채널 경계를 파악하고 잘못된 신호를 걸러내는 적응형 접근 방식으로, 중간 정도의 추세에서도 효과적으로 작동한다는 것입니다. 특히 가격 채널 내에서 급격한 변동을 보이는 통화쌍에서 탁월한 성과를 보입니다. Advisor는 20년 넘게 데이터 테스트를 거쳤으며 그 기간 동안 가장 불안정한 기간도 견딜 수 있습니다. 컴퓨터를 연중무휴 24시간 실행할 수 없다면 VPS 서버 서비스를 이용하는 것이 좋습니다. 고문은 12개월 이상 낮은 손실률로 안
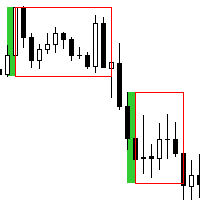
OBTE = Order Block Type I OBTI Indicator MT4 is the most accurate and customizable indicator on the market. It was developed to facilitate the analysis of operations based on candlestick patterns and supply-demand zones. These zones are possible movement reversal points. For this indicator is generated by the order block of smart money concept. Input parameters: 1. Multiple timeframes : M1 M5 M15 M30 H1 H4 D1 W1 MN1 2. Default input: H1 H4 D1 W1 MN1 3. Notifications / Send Emails / Notification
MetaTrader 4용 스마트 피벗 포인트 - 스마트 트레이딩을 위한 명확한 레벨 스마트 피벗 포인트는 MetaTrader 4용 전문 지표로, 차트에 주요 트레이딩 레벨을 자동으로 계산하여 표시해 줍니다. 복잡한 가격 움직임을 명확하고 구조화된 지도로 변환하여 지지선, 저항선, 가격 균형점, 그리고 잠재적 목표가를 강조합니다. 명확성을 중시하는 트레이더를 위해 설계된 이 도구는 외환, 암호화폐(비트코인, 이더리움), 주가지수, 주식, 원자재(XAUUSD) 등 모든 시장에서 활용 가능합니다. 이 지표는 계산 시간을 절약하고 분석에 객관성을 더하는 믿음직한 분석 도우미입니다. 시장 신호를 제공하거나 트레이딩 결정을 대신해 주는 것이 아니라, 트레이더 스스로 정보에 기반한 트레이딩 결정을 내릴 수 있도록 고품질의 정보를 제공합니다. 주요 기능 및 이점 바로 사용 가능한 가격 좌표 시스템: 더 이상 레벨을 수동으로 그릴 필요가 없습니다. 중심 레벨(균형점), 지지선, 저항선, 매수
LIGHTHOUSE — 시장 구조를 한눈에. 리페인트 없음. LIGHTHOUSE는 확정된 스윙 고점과 저점으로 가격 구조를 읽고, 차트에 깔끔하게 표시합니다. 재량 트레이더가 진입 전에 묻는 세 가지 질문에 답합니다. 상위 시간 프레임은 어느 방향인가? 현재 차트는 어느 방향인가? 중요한 가격대는 어디인가? 판단을 돕는 도구로, 거래를 하거나 가격을 예측하지 않습니다. 왜 "LIGHTHOUSE"(등대)인가? 등대는 배에 길을 알려 주고 암초를 경고하지만, 키를 잡는 것은 선장입니다. LIGHTHOUSE도 차트에서 시장의 방향과 가격이 반응하기 쉬운 구간을 보여 줍니다. 결정은 여러분의 몫입니다. 작동 방식 스윙 고점·저점은 봉이 마감된 뒤에만 확정됩니다. 한 번 표시된 라벨은 움직이거나 사라지지 않습니다. 구조 돌파는 꼬리가 아니라 종가로 판단합니다. 방향은 마지막 구조 돌파의 방향과 최근 두 고점·저점의 배열(다우 이론)로 정합니다. 같은 로직을 상위 시간 프레임(기본 H1)에도
This is a simple and efficient indicator based on market logic. The indicator creates a range chosen by a trader. Trader selects only two parameters. The first one is the number of candles that define the frame. The second one is the number of candles needed for confirmation frame. The indicator shows all situations in history and works with the actual movement of the market. The indicator works on all timeframes . You are not limited by use of different timeframes, the indicator is able to adap
Multicurrency and multitimeframe indicator of the Standard Deviation Channel. Displays the current direction of the market. On the panel, you can see breakouts and touches (by price) of the levels of the linear regression channel. In the parameters, you can specify any desired currencies and timeframes. Also, the indicator can send notifications when levels are touched. By clicking on a cell, this symbol and period will be opened. This is MTF Scanner. The key to hide the dashboard from the char
자동 지지 및 저항 OSW - 자동 주요 레벨 Automatic Support and Resistance OSW는 차트에서 가장 관련성 높은 지지 및 저항 레벨을 즉시 식별하고 그리기 위해 설계된 자동 기술 지표입니다. 상위 타임프레임(H1, 일간, 주간, 월간)의 고점과 저점을 지능적으로 계산하여 주요 유동성 영역을 표시할 때의 주관성을 제거하고, 트레이더가 가격 작용과 전략적 의사 결정에 집중할 수 있도록 합니다. 구성 매개변수 가이드 S&R Color: 차트에 투영되는 가로 지지 및 저항선의 시각적 색상을 정의합니다. S&R Style: 선의 시각적 그리기 스타일(실선, 점선, 대시선 등)을 선택합니다. S&R Width: 화면 기본 설정에 맞춰 시인성을 조정하기 위해 레벨 선의 시각적 두께를 조정합니다. 차트 시각적 해석 이 지표는 캔들이나 수동 분석을 방해하지 않도록 차트 배경에 자동 가로선을 그립니다. 레벨은 작업 중인 타임프레임에 따라 동적으로 계산됩니다: 1~
Apache MHL Moving Average
Paulo Roberto Da Costa
Product for MetaTrader 4:   https://www.mql5.com/pt/market/product/159627 Product for MetaTrader 5:   https://www.mql5.com/pt/market/product/160313 The Apache MHL Moving Average Expert Advisor, or simply "Apache MHL," is a robot that operates on the GOLD/XAUSD asset using strategies based on moving averages and risk management with Martingale. The user has RSI adjustment to confirm the asset's strength. It combines multiple moving averages to identify potential breakout points in the market.
MonexScalp
Behzad Shadfar
Monex Scalp is an intelligent trading robot designed for 1-minute time frames, offering simplicity and efficiency for traders. Key Features: •   User-Friendly Settings:   Monex Scalp offers straightforward settings, making it accessible for traders of all experience levels. •   Session Scheduling:   Customize trading sessions to align with various market hours, enhancing strategy execution. •   Adjustable Stop-Loss:   Set personalized stop-loss levels to effectively manage risk according to yo
It could help to calculate Risk-Reward easily before placing a BUY-SELL position. TradeSizeCalculator is a Multi-Tasking Calculator. It will calculate the others when we define the value in one of the columns. Stoploss, risk percentage, risk-money, lot size, take-profit , reward-money, and reward-ratio. Depending on which value is changed. All values in the columns are editable. Also, we can get those calculation results by drag-drop the stop-loss/take-profit line. Parameter: The inputs below ar
A Fibonacci indicator is best used with other indicators like Pivots, Support/Resistance etc. Price tends to use Fibo levels as Support or Resistance lines. So, this indicator is very useful to know when price might reverse or if a level is crossed, price might continue the trend. Also, to find the best Take Profit and StopLoss lines. Don't use Fibo Indicator alone for trading as it might not always be accurate. Use it to make your strategies better as a supporting indicator. Settings: Auto Fib
FREE
EPriceJPY
Ngo Yung Lau
EPriceJPY is a auto-trading EA focused on USDJPY. Trading Concept The operation concept of EPriceJPY is based on an algorithm that tries to determine the Trend. To be more specific, EPriceJPY works with its own calculation logic based on simulation. It is trying to find out the Top or Bottom in a Trend, and open the Short or Long Position accordingly. Don't expect EPriceJPY to open the trade on the highest or lowest level, because EPriceJPY will trade only when the Top/Bottom can be confirmed.
Neo Prescience
Mohd Hakim Johari
NeoPrescience NeoPrescience is a closed-bar confluence indicator for MetaTrader 4. It scans the market for structured setups, filters weak conditions and calculates Entry, Stop Loss and Take Profit levels directly on the chart. The indicator does not rely on a single signal condition. Each setup is evaluated using several market factors before it is accepted. Signal Engine NeoPrescience analyses: Price action patterns EMA trend direction and slope Higher-timeframe trend alignment Recent swing s
대화형 구조 대시보드 (Interactive Structure Dashboard): 최고의 멀티 타임프레임 스마트 머니 컨셉 (SMC) 지표 스마트 머니 컨셉 (Smart Money Concepts, SMC), 구조 파쇄 (Break of Structure, BOS), 공정 가치 갭 (Fair Value Gaps, FVG)은 현대 개인 및 기관 트레이더들이 시장 메커니즘을 바라보는 방식을 완전히 혁신했습니다. 단순한 소액 트레이더용 지지와 저항선에 의존하던 시대는 지났습니다. 현대 트레이딩의 핵심 우위는 은행의 흔적, 기관의 유동성, 그리고 구조적 변화를 추적하는 데 있습니다. InteractiveStructureDashboard MQL4 지표는 수동으로 여러 타임프레임을 확인하는 번거로움과 완전 자동화된 기관 추적 시스템 간의 간극을 메워줍니다. MetaTrader 4 터미널 내부에서 올인원 커맨드 센터 역할을 하며, 승률 높은 세팅을 찾아 여러 자산과 타임프레임을 동시에 스
NIGHTCrusher
Christian Opperskalski
4 (1)
NIGHTCRUSHER is a fully automated expert advisor, designed for scalping on quite market situation. you can also run different strategies like swing trading or grid different Trade Entry Signals different Exit Strategies included (MA Cut / Signal Change / Trailing TP) clever Risk & Money management - Balance based - Longrun trades tracking You can also use a Grid function or Lot multipier, if needed News Feature included - to protect you of miss trades in news times Important: Get informed about
NQX Structure Break Pullback MT4
Marcel De Oliveira Farias
NQX Structure Break Pullback MT4은(는) MetaTrader 4용 시그널 인디케이터입니다: 시장 구조 돌파 후 첫 번째 되돌림. 시장 구조 돌파를 표시하고 유지되는 첫 번째 되돌림에서 시그널을 내는 NQX 독자 로직입니다. 제안 진입가, 짧은 손절, 먼 목표가(3:1, 5:1, 10:1)를 표시하며, 결정은 당신이 합니다. 차트에 표시되는 내용 - 확정된 시그널 캔들에 화살표 표시(확정된 시그널은 절대 리페인트되지 않습니다). - 제안 진입가, 짧은 손절, 먼 제안 목표가(기본값: 리스크의 6배), 그리고 3 x 1, 5 x 1, 10 x 1 참조선. - 레벨에 도달하면 차트에 라벨(목표가 또는 손절)이 표시됩니다. - 마지막 시그널과 표시된 히스토리에 나타난 시그널 수를 보여주는 패널. - 새 시그널 발생 시 팝업 및 푸시 알림(선택 사항). NQX 전용 로직: 다른 어떤 NQX 인디케이터도 이와 동일한 진입 시그널과 시장 필터 조합을 사용하지 않으므로,
Fibonacci strategies EA trades Fibonacci levels. You can choose whether the EA should trade a manually plotted fibonacci or whether it should automatically plot a fibonacci. In automatic fibonacci drawing mode, the EA automatically plots a fibonacci retracement based on the number of bars you select on the BarsToScan setting in the indicator. The fibonacci is automatically updated in real time as new highest and lowest values appears amongst the selected bars. You can select which level values
DailyLossProtector EA — Smart Risk Control for Safer Trading. Protect your capital with precision. DailyLossProtector is a minimalist, high-utility Expert Advisor designed for traders who prioritize capital preservation and disciplined risk control . This EA monitors your open trades and will automatically close them when a predefined floating loss threshold is reached , helping you avoid emotional decisions and unexpected drawdowns. Key Features Daily Loss Guard: Automatically closes
FREE
BID Wave Volume 2
Mostefa Mammeri
Product Title: BID Wave Volume 1 - Smart Institutional Liquidity Tracker Short Description: Uncover institutional footprints! A powerful dual-timeframe volume indicator that detects real market turns by checking M1 volume order flow at current timeframe reversal zones. Full Description:  BID Wave Volume 2 is a revolutionary, advanced volume indicator designed for pro-scalpers and day traders. It bridges the gap between raw price action and institutional order flow. Unlike traditional indicators,
이 제품의 구매자들이 또한 구매함
Currency Strength Wizard
Oleg Rodin
4.85 (61)
통화 강도 마법사는 성공적인 거래를 위한 올인원 솔루션을 제공하는 매우 강력한 지표입니다. 표시기는 여러 시간 프레임의 모든 통화 데이터를 사용하여 이 또는 해당 외환 쌍의 힘을 계산합니다. 이 데이터는 특정 통화의 힘을 확인하는 데 사용할 수 있는 사용하기 쉬운 통화 지수 및 통화 전력선의 형태로 표시됩니다. 필요한 것은 거래하려는 차트에 표시기를 부착하는 것뿐입니다. 표시기는 거래하는 통화의 실제 강세를 보여줍니다. 지표는 또한 추세와 거래할 때 유리하게 사용할 수 있는 구매 및 판매 거래량 압력의 극한값을 보여줍니다. 지표는 또한 피보나치에 기반한 가능한 대상을 보여줍니다. 표시기는 PUSH 알림을 포함한 모든 유형의 알림을 제공합니다. 구매 후 연락주세요. 나는 당신과 거래 팁을 공유하고 당신에게 무료로 훌륭한 보너스 지표를 줄 것입니다! 나는 당신에게 행복하고 유익한 거래를 기원합니다!
Trend SniperX MT4
Sarvarbek Abduvoxobov
5 (6)
Trend Sniper X 는 트레이더가 명확하고 정확하게 트렌드 방향과 잠재적 반전 지점을 포착할 수 있도록 돕는 MetaTrader 5 전용 멀티 타임프레임 추세 추종 지표입니다. MT5 버전 링크: https://www.mql5.com/en/market/product/181101 가격 안내: 현재 가격은 프로모션 할인가이며, 향후 업데이트 및 새 기능 출시 시 인상될 수 있습니다. Code2Profit 채널 멀티 타임프레임 분석으로 시장을 정복하세요! Trend Sniper X로 승률을 극대화하는 방법: 핵심 규칙 및 세션 팁 기술 사양 플랫폼 MetaTrader 5 지표 유형 멀티 타임프레임 추세 지표 작동 타임프레임 모든 차트 타임프레임 (상위 타임프레임 M1–MN1 독립 선택 가능) 주요 종목 외환(Forex), 골드(XAUUSD) 및 기타 CFD 추천 계좌 모든 계좌 유형 시각화 컬러 추세 캔들 (매수/매도/약세/변화) + 매수/매도 화살표 추가 모듈 세션 마켓 박스 (
M1 Sniper
Oleg Rodin
4.97 (30)
M1 SNIPER 는 사용하기 쉬운 거래 지표 시스템입니다. M1 시간대에 맞춰 설계된 화살표 지표입니다. 이 지표는 M1 시간대 스캘핑을 위한 단독 시스템으로 사용할 수 있으며, 기존 거래 시스템의 일부로도 사용할 수 있습니다. 이 거래 시스템은 M1 시간대 거래용으로 특별히 설계되었지만, 다른 시간대에도 사용할 수 있습니다. 원래는 XAUUSD와 BTCUSD 거래를 위해 이 방법을 설계했지만, 다른 시장 거래에도 유용하다는 것을 알게 되었습니다. 이 지표의 신호는 추세 방향과 반대로 거래될 수 있습니다. 저는 지표의 신호를 활용하여 양방향으로 거래할 수 있도록 돕는 특별한 거래 기법을 알려드립니다. 이 방법은 특별한 동적 지지선과 저항선 가격 영역을 활용하는 것을 기반으로 합니다. 구매하시면 M1 SNIPER 화살표 지표를 바로 다운로드하실 수 있습니다. 또한, 아래 스크린샷에 표시된 Apollo Dynamic SR 지표는 M1 SNIPER 도구를 사용하는 모든 사용자에게 무료로
SIO Oscillator: 자기 최적화 세미분산 불균형 오실레이터 지표를 구매하시면 이를 기반으로 한 전문가 어드바이저(EA)를 무료로 받으실 수 있습니다. 대부분의 오실레이터는 모든 가격 움직임을 똑같이 취급합니다. SIO는 상승 압력과 하락 압력을 분리하여 둘 사이의 불균형을 측정하고, 매수자와 매도자 중 어느 쪽이 실제로 시장을 주도하고 있는지 보여줍니다. 불균형이 극단에 도달하면 SIO는 진입가, 손절(Stop Loss), 익절(Take Profit) 수준이 포함된 명확한 신호를 표시합니다. SIO의 차별점은 고정된 설정에 의존하지 않는다는 것입니다. 내장된 자기 최적화 엔진이 현재 종목과 시간 프레임에 맞는 파라미터를 지속적으로 탐색하고, 사용하기 전에 검증합니다. 두 가지 신호 모드 평균 회귀(Mean Reversion): 불균형의 극단에서 거래하며 균형으로의 복귀를 노립니다. 추세 추종(Trend Following): 지속적이고 우세한 불균형의 방향으로 거래합니다. 자
Advanced Supply Demand
Bernhard Schweigert
4.91 (302)
현재 30% 할인! 초보자나 전문 트레이더를 위한 최고의 솔루션! 이 보조지표는 우리가 다수의 독창적 기능과 새로운 공식을 통합한 독특하고 고품질이며 저렴한 거래 도구입니다. 이 업데이트를 통해 이중 시간대를 표시할 수 있습니다. 더 높은 TF를 표시할 수 있을 뿐만 아니라 차트 TF와 더 높은 TF 모두를 표시할 수 있습니다: 중첩 영역 표시. 모든 Supply Demand 트레이더들이 좋아할 것입니다. :) 중요한 정보 공개 Advanced Supply Demand의 잠재력을 극대화하려면 다음을 방문하십시오. https://www.mql5.com/ko/blogs/post/720245   진입 또는 목표의 명확한 트리거 포인트를 정확히 찾아냄으로 해서 거래가 어떻게 개선될지 상상해 보십시오. 새로운 알고리즘을 기반으로 매수자와 매도자 간의 잠재적인 불균형을 훨씬 더 쉽게 분간할 수 있습니다. 왜냐하면 가장 강한 공급영역과 가장 강한 수요 영역과 과거에 어떻게 진행 되었는지를(이전
Non repaint MT4
Yan Zhen Du
5 (2)
This is a professional chart indicator designed for traders focused on stability and clear price action. It helps filter market noise and provides clear visual entry and exit zones for your trading decisions. Price Information: The current price is promotional and is subject to change as upcoming updates and new features are released. MQL5 public channel:  CLICK HERE for MT5:  Non-repainting MT5 version Core Features: Strictly Non-Repainting: The system is built with strict non-repaint logic. W
Gann Made Easy
Oleg Rodin
4.84 (174)
Gann Made Easy 는 mr.의 이론을 사용하여 최고의 거래 원칙을 기반으로 하는 전문적이고 사용하기 쉬운 Forex 거래 시스템입니다. W.D. 간. 이 표시기는 Stop Loss 및 Take Profit Levels를 포함하여 정확한 BUY 및 SELL 신호를 제공합니다. PUSH 알림을 사용하여 이동 중에도 거래할 수 있습니다. 구매 후 거래 방법 안내 및 유용한 추가 지표를 무료로 받으시려면 저에게 연락주세요! 아마도 Gann 거래 방법에 대해 이미 여러 번 들었을 것입니다. 일반적으로 Gann의 이론은 초보자 거래자뿐만 아니라 이미 거래 경험이 있는 사람들에게도 매우 복잡한 것입니다. Gann의 거래 방식은 이론적으로 적용하기 쉽지 않기 때문입니다. 나는 그 지식을 연마하고 Forex 지표에 최고의 원칙을 적용하기 위해 몇 년을 보냈습니다. 표시기는 적용하기가 매우 쉽습니다. 차트에 첨부하고 간단한 거래 권장 사항을 따르기만 하면 됩니다. 지표는 지속적으로 시장 분석
이 지표는 실제 거래에 완벽한 자동 파동 분석 지표입니다! 사례... 참고:   웨이브 그레이딩에 서양식 이름을 사용하는 데 익숙하지 않습니다. Tang Lun(Tang Zhong Shuo Zen)의 명명 규칙의 영향으로 기본 웨이브를   펜   으로 명명하고 2차 웨이브 밴드를   세그먼트   로 명명했습니다. 동시에, 세그먼트에는 추세 방향이 있습니다.   주요 추세 세그먼트에는   이름이 지정되지만(이 이름 지정 방법은 향후 노트에서 사용됩니다. 먼저 말씀드리겠습니다.) 알고리즘은 굴곡 이론과 거의 관련이 없으므로 그렇게 해서는 안 됩니다. 이는 나의 시장 분석을   통해 요약된 끊임없이 변화하고 복잡한 운영 규칙을   반영합니다. 밴드는 더 이상 사람마다 다르지 않도록 표준화되고 정의되었습니다. 인위적인 간섭의 드로잉 방법은 시장 진입을 엄격하게 분석하는 데 핵심적인 역할을 합니다. 이 지표를 사용하는 것은 거래 인터페이스의 미학을 개선하고 원래의 K-line 거래를
현재 30% 할인 ! 초보자 또는 전문가 트레이더를 위한 최고의 솔루션! 이 대시보드 소프트웨어는 28개의 통화 쌍에서 작동합니다. 2가지 주요 지표(Advanced Currency Strength 28 및 Advanced Currency Impulse)를 기반으로 합니다. 전체 Forex 시장에 대한 훌륭한 개요를 제공합니다. 고급 통화 강도 값, 통화 이동 속도 및 모든(9) 시간대의 28 Forex 쌍에 대한 신호를 보여줍니다. 추세 및/또는 스캘핑 기회를 정확히 파악하기 위해 차트의 단일 지표를 사용하여 전체 시장을 볼 수 있을 때 거래가 어떻게 개선될지 상상해 보십시오! 잠재적인 거래를 식별하고 확인하면서 강력한 통화와 약한 통화를 더욱 쉽게 식별할 수 있도록 이 지표에 기능을 내장했습니다. 이 표시기는 통화의 강세 또는 약세가 증가 또는 감소하는지 여부와 모든 시간대에서 수행되는 방식을 그래픽으로 보여줍니다. 추가된 새로운 기능은 현재 시장 조건 변화에 적응하는
Scalper Vault
Oleg Rodin
4.9 (41)
Scalper Vault는 당일 매매(intraday trading)에서 일관된 성과를 내고자 하는 트레이더를 위해 설계된, 강력하고 모든 기능을 갖춘 트레이딩 시스템입니다. 이 고정밀 지표는 외환(Forex) 및 바이너리 옵션 트레이더 모두에게 기관급 분석을 제공하는 독립적인 종합 트레이딩 시스템 역할을 합니다. 구매 후 저에게 연락해 주시면, 트레이딩 팁과 함께 특별한 보너스를 제공해 드립니다! Scalper Vault는 추측에 의존하거나 복잡한 수동 분석을 할 필요를 없애주며, 사용하기 쉬운 트레이딩 기법을 통해 오직 매매 실행에만 집중할 수 있도록 돕습니다. 정확한 추세 추종 신호: 핵심 알고리즘이 시장 구조를 분석하여, 지배적인 시장 추세 방향과 일치하는 고확률 신호만을 제공함으로써 잘못된 진입을 획기적으로 줄여줍니다. 정밀한 고점 및 저점 탐지: 시장의 움직임이 소진되는 지점을 스캔하여 잠재적인 반전 구간을 식별합니다. 간(Gann) 이론 기반의 매수/매도 구간: 수학적
ON Trade Waves Patterns Harmonic Elliot Wolfe를 소개합니다. 이는 수동 및 자동 방법을 사용하여 다양한 시장 패턴을 감지하기 위해 개발된 고급 지표입니다. 다음은 그 작동 방식입니다: 조화적 패턴: 이 지표는 차트에 나타나는 조화적 패턴을 식별할 수 있습니다. 이러한 패턴은 Scott Carney의 "Harmonic Trading vol 1 및 2"에서 설명한 것처럼 조화적 거래 이론을 연습하는 트레이더에게 중요합니다. 수동으로 그리든 자동 감지를 사용하든 ON Trade Waves Patterns가 도움을 줄 것입니다. 컨트롤 패널: 이 지표에는 사용자 친화적인 컨트롤 패널이 있습니다. 차트 및 시간 프레임 설정을 저장하여 다양한 구성 간에 쉽게 전환할 수 있습니다. 차트 공간을 최대화하려면 최소화할 수도 있습니다. 다른 분석 도구를 사용하는 것을 선호하는 경우 닫기 버튼을 클릭하여 모든 지표 데이터를 숨길 수 있습니다. 템플릿 저장: 설정을 사
RFI levels PRO
Roman Podpora
5 (2)
이 지표는 추세 반전 지점과 가격 반등 영역을 정확하게 보여줍니다.       주요 투자자들   . 새로운 트렌드가 형성되는 곳을 파악하고 최대한 정확하게 의사결정을 내리며 모든 거래를 완벽하게 통제합니다. TREND LINES PRO   지표와 함께 사용할 때 최대의 잠재력을 발휘합니다.  VERSION MT5 지표가 보여주는 내용: 새로운 추세의 시작 시 활성화되는 반전 구조 및 반전 수준. 최소한의 위험 대비 수익률을 갖는 이익 실현   (TAKE PROFIT)   및   손절매(STOP LOSS)   레벨 표시       RR 1:2   . 지능형 손실 감소 로직이 적용된 손절매 기능. 지정된 지표에서 두 가지 추세 유형에 대한 반전 패턴을 표시합니다. 지표: 트렌드를 따라   트렌드 라인 프로   (글로벌 트렌드 변화) 트렌드 프로   (빠른 트렌드 변화) 간단하고 효과적입니다       스캐너       실시간 추세 (신규). 다중 시간 프레임 도구 필터링. 표시하다  
ShapeRadar MT4
Evgeniy Zhdan
ShapeRadar - 클래식 차트 패턴 인디케이터 ShapeRadar는 기술적 분석의 대표적인 패턴을 차트에서 자동으로 찾아 줍니다. 더블 탑/바텀, 트리플 탑/바텀, 헤드앤숄더와 역헤드앤숄더, 상승 및 하락 쐐기형, 직사각형, 삼각형, 플래그, 페넌트를 지원합니다. 가격이 패턴 경계 밖에서 마감하면 인디케이터가 패턴, 진입 지점, 손절 수준, 목표가를 그려 주며, 정보 패널이 감지된 모든 패턴을 요약해 보여 줍니다. MetaTrader 5 버전:  https://www.mql5.com/en/market/product/208462 모든 심볼과 시간 프레임에서 작동합니다. 신호는 캔들이 마감될 때만 확정되므로, 이미 그려진 표시가 사라지거나 현재 봉에서 다시 그려지지 않습니다. 차트에서 패턴의 위치, 돌파 지점, 진입·손절·목표가를 확인할 수 있고, 패널이 모든 정보를 한곳에 모아 줍니다. 제 채널을 구독해 주세요: https://www.mql5.com/en/channels/algo
PRO Renko System
Oleg Rodin
5 (31)
PRO Renko System 은 RENKO 차트 거래를 위해 특별히 고안된 매우 정확한 거래 시스템입니다. 이것은 다양한 거래 상품에 적용될 수있는 보편적 인 시스템입니다. 체계는 효과적으로 당신에게 정확한 반전 신호에 접근을 주는 소위 시장 소음을 중화합니다. 이 표시기는 사용하기가 매우 쉽고 신호 생성을 담당하는 매개 변수가 하나만 있습니다. 당신은 쉽게 당신의 선택의 어떤 무역 계기에 공구를 적응시킬 수 있고 renko 막대기의 크기. 나는 항상 당신이 내 소프트웨어로 수익성있게 거래 할 수 있도록 추가 지원을 제공 할 준비가되어 있습니다! 나는 당신에게 행복하고 수익성있는 거래를 기원합니다! 구매 후 저에게 연락하십시오! 내 렌코 차트 생성기를 보내드립니다. 또한 내 개인 권장 사항 및 시스템의 다른 모듈을 무료로 공유 할 것입니다!
SR Liquidity
Oleg Rodin
5 (3)
SR Liquidity 는 시장 유동성이 집중되고 가격이 가장 강력하게 반응하는 숨겨진 구간을 포착하도록 설계된 트레이딩 지표입니다. 이러한 특수 유동성 구간은 강력한 지지 및 저항선 역할을 하며, 시장 반전 가능성이 가장 높은 지점을 명확하게 보여주는 지도가 되어 줍니다. SR Liquidity는 일반적인 지지 및 저항선을 단순히 그리는 대신, 실제 가격 움직임을 분석하여 매수 및 매도 압력이 집중되는 구간을 포착합니다. 이러한 구간은 실질적인 시장의 흐름을 주도하는 유동성 풀(liquidity pools)에 해당합니다. 이 지표는 해당 구간을 차트에 직접 시각화하여, 가격 반응이 실제로 나타나기 전에 이를 미리 예측할 수 있도록 돕습니다. 즉, 가격 추세가 전환될 가능성을 사전에 파악하게 해주는 것입니다. 결과적으로 이 지표는 가공되지 않은 가격 움직임(price action)을 시장의 핵심 가격대, 다시 말해 추세 전환점이 될 수 있는 지점들을 보여주는 명확하고 실용적인 로드맵
Auto Optimized SpeedAngle 은 지속적인 워크포워드 최적화(Walk-Forward Optimization, WFO)를 통해 곡선 적합(curve-fitting)을 제거한 기관 수준의 모멘텀 벡터화 시스템입니다. 시장 체제가 바뀔 때 성능이 떨어지는 정적 입력에 의존하는 대신, 이 지표는 표본 외(Out-of-Sample, OOS) 검증을 사용하여 매개변수를 동적으로 재보정하며, 표시되는 신호가 과거의 우연이 아닌 진정한 통계적 우위를 나타내도록 보장합니다. 핵심 기관용 프레임워크 워크포워드 최적화 엔진: 핵심 알고리즘은 수천 가지의 룩백(lookback) 및 임계값 조합을 지속적으로 스캔하며, 데이터를 인샘플(in-sample)과 표본 외(out-of-sample) 세트로 엄격하게 분리합니다. 미지의 데이터 환경에서 수학적 우수성이 증명된 경우에만 새로운 매개변수 구성을 채택합니다. 정량적 목적 함수: 순수한 총이익을 쫓는 대신, 최적화 엔진은 기관 수준의 안정성
Route Lines Prices
Vitalyi Belyh
3 (1)
Route Lines Prices - 은 가격 방향을 찾는 데 사용되는 지표입니다. 간단한 인터페이스에는 가격 움직임 및 미래 방향 계산을 위한 다양한 알고리즘이 포함되어 있습니다. 이러한 알고리즘에는 사용된 시간대에 따른 변동성 계산 및 가격 평활화 기능이 있습니다. 이 지표는 " Calculating price values " 값을 변경하는 단일 매개변수를 제공합니다. 기본값인 1은 균형 잡힌 자동 계산을 제공하며, 별도의 설정 없이 바로 사용할 수 있습니다. 2에서 500 사이의 값을 수동으로 변경하여 자신만의 거래 시스템에 맞게 지표를 맞춤 설정할 수 있습니다. 이 지표는 M1부터 H4까지의 시간대에서 사용을 권장합니다. 모든 거래 상품에 적용 가능합니다. 신호 화살표는 캔들 종가에 생성되며, 과거 차트에는 다시 그려지지 않습니다. 메인 차트에 동일한 화살표가 표시됩니다. 다양한 유형의 알림을 사용할 수 있으며, 내장된 라인 궤적 카운터는 종가를 기반으로 작동합니다. 이는
Dinapoli Package MT4
Samil Bozuyuk
3 (2)
All in One package includes the  Oscillator Predictor ,  MACD Predictor ,  Thrust Scanner  and  Advanced Fibonacci  indicators which are mandatory for applying  Dinapoli  trade plans.  Please visit below links for detailed explanations of indicators. Advanced Fibonacci Indicator =>  https://www.mql5.com/en/market/product/52834 Thrust Scanner Indicator => https://www.mql5.com/en/market/product/52830 Overbought /Oversold Predictor indicator => https://www.mql5.com/en/market/product/52621 Macd P
Quantum Imbalance Profiles 는 균형과 불균형 국면을 보여주는 지표입니다. 시장이 어느 가격에서 거래량을 소화했는지, 그 구간에서 어느 쪽이 우세했는지, 그리고 이후 가격이 어떤 레벨을 통해 임펄스로 확장했는지를 보여줍니다. 일반적인 거래량 프로파일은 "어디서 거래가 이루어졌는가"라는 한 가지 질문에만 답합니다. 각 가격에서 어느 쪽이 우세했는지, 박스권이 어떻게 끝났는지, 시장이 어느 방향으로 빠져나갔는지는 보여주지 않습니다. Quantum Imbalance Profiles는 프로파일을 Volume Bid/Ask 모드로 구성하며(각 레벨의 거래량을 매도와 매수로 분리), 여기에 독자적인 불균형 프로파일, 즉 임펄스 확장의 가격별 분포를 더합니다. 거래량 프로파일과 델타는 균형 국면을, 불균형 프로파일은 그로부터의 이탈을, 캔들 위의 델타 버블은 종목의 평상 수준 대비 공격성의 급증을 나타냅니다. 균형과 불균형 시장은 두 상태를 번갈아 오갑니다. 균형 상태에서는
Dark Support Resistance  is an Indicator for intraday trading. This Indicator is programmed to identify  Support and Resistance Lines , providing a high level of accuracy and reliability. Key benefits Easily visible lines Only the most important levels will be displayed Automated adjustment for each timeframe and instrument Easy to use even for beginners Never repaints, never backpaints, Not Lag 100% compatible with Expert Advisor development All types of alerts available: Pop-up, Email, Push
Advanced Currency IMPULSE with ALERT
Bernhard Schweigert
4.9 (491)
현재 40% 할인!! 초보자 또는 전문가 트레이더를 위한 최고의 솔루션! 이 지표는 우리가 독점 기능과 비밀 공식을 통합했기 때문에 독특하고 고품질이며 저렴한 거래 도구입니다. 단 하나의 차트로 28개 통화 쌍 모두에 대한 경고를 제공합니다. 새로운 추세 또는 스캘핑 기회의 정확한 트리거 포인트를 정확히 찾아낼 수 있기 때문에 거래가 어떻게 개선될지 상상해 보십시오! 새로운 기본 알고리즘을 기반으로 구축되어 잠재적인 거래를 훨씬 더 쉽게 식별하고 확인할 수 있습니다. 이는 통화의 강세 또는 약세가 가속되는지 여부를 그래픽으로 표시하고 가속 속도를 측정하기 때문입니다. 자동차의 속도계처럼 생각하면 됩니다. 가속화할 때 Forex 시장에서 동일한 일이 분명히 더 빠르게 발생합니다. 즉, 반대 방향으로 가속화되는 통화를 페어링하면 잠재적으로 수익성 있는 거래를 식별한 것입니다. 통화 모멘텀의 수직선과 화살표가 거래를 안내합니다! 역동적인 Market Fibonacci 23 레벨은
Super Signal – Skyblade Edition 전문가용 노리페인트 / 노래그 트렌드 신호 시스템, 뛰어난 승률 제공 | MT4 / MT5용 1분, 5분, 15분과 같은 낮은 타임프레임에서 가장 좋은 성능을 보입니다. 핵심 기능: Super Signal – Skyblade Edition은 추세 매매를 위해 설계된 스마트 신호 시스템입니다. 이 시스템은 다중 필터 로직을 활용하여, 명확한 방향성과 실질적인 모멘텀이 수반된 고품질 추세만을 감지합니다. 이 시스템은 고점 또는 저점을 예측하지 않으며 , 다음 세 가지 조건이 모두 충족될 때만 신호를 발생시킵니다: 명확한 추세 방향 강화되는 모멘텀 건전한 변동성 구조 또한, 시장 세션 기반의 유동성 분석을 통해 신호의 신뢰성과 타이밍을 더욱 향상시킵니다. 신호 특성: 모든 화살표 신호는 100% 리페인트 없음 / 지연 없음 신호가 한 번 발생하면 고정되며, 깜빡이거나 사라지지 않음 차트 상의 시각적 화살표, 정보 패널, 팝업 알
AW Prime Oscillator
AW Trading Software Limited
5 (1)
두 개의 오실레이터의 조합. 첫 번째 항목은 진입점을 표시하고 두 번째 항목은 현재 추세를 표시합니다. 표시기는 두 가지 모드의 화살표로 오실레이터 신호를 표시할 수 있습니다. 모든 빠른 오실레이터 신호 또는 현재 추세 방향의 신호만 표시할 수 있습니다. 다중 시간대 패널과 세 가지 유형의 신호 알림이 있습니다. 이익: 일일 및 스캘핑 거래에 적합 추세 필터링 간단하고 민감한 설정 다중 시간대 패널 Advisor에 통합하는 데 적합합니다. 모든 기호 및 기간에서 작동합니다. 세 가지 유형의 알림 MT5 version ->  HERE  / Problem solving ->  HERE 지표 전략 표시기는 두 개의 서로 다른 오실레이터로 구성됩니다. 느린 추세선(두꺼움) - 지표의 고수준이 위에서 아래로 교차하면 하락세 지표이고, 낮은 수평 수준(지표의 낮은 수준)이 아래에서 위로 교차하면 하락 추세 지표입니다. 상승 경향. 또한, 하단 영역에서 느린 선을 발견하면 현재 추세가 하락세임을
Scalp Arrow Exit Signals (MT4 Indicator) A powerful all‑in‑one MT4 indicator providing precise entries, exits, and re‑entries across any timeframe or trading style. The Scalp Arrow Exit Signals is a complete “black‑box” signal system engineered for MT4 traders who want clarity, speed, and reliability. It generates clean buy/sell arrows along with exit, re‑entry, retracement, and pull‑back entry signals — all supported by flexible alerts and customizable risk settings. Whether you scalp fast ch
PZ Turning Points MT4
PZ TRADING SLU
1 (1)
Identify key turning points with reliable fractal analysis This indicator examines the price structure of fractals of different periods to determine possible reversal points in the market, providing timing to positional traders that already have a fundamental or technical valuation model. Unlike its younger brother, Reversal Fractals , this indicator won't miss reversals because of the period selected, and will find reversal fractals on a zig-zag fashion, ignoring those reversals which do not
Quant Direction
Georgios Kalomoiropoulos
Quant Direction 은 3D 시장 분석 도구입니다. 다양한 매개변수에 걸쳐 정확한 백분율 편차를 계산하면서 완벽하게 객관적인 알고리즘 기반 시장 분석을 제공합니다. 첨단 AI 기반 모델링 도구와 엄격한 테스트를 거쳐 개발된 이 알고리즘은 타의 추종을 불허하는 정확도로 시장을 분석합니다. 플랫폼에서 모든 통화쌍 또는 금융 상품을 분석할 수 있습니다. 단기 거래, 데이 트레이딩, 스윙 트레이딩 등 어떤 유형의 거래를 하든 Quant Direction은 최적의 선택입니다. 운영자가 되는 것의 진정한 이점 퀀트 디렉션의 진정한 장점은 감정, 눈의 피로, 과도한 분석을 완전히 배제한다는 점입니다. 더 이상 수십 개의 차트를 일일이 살펴보며 방향을 찾거나 자신의 판단에 끊임없이 의문을 품을 필요가 없습니다. 이 시스템은 8개의 시간 간격(5개월에서 수개월까지)을 밀리초 단위로 처리합니다. 특정 시점의 주요 시장 참여자를 정확하게 식별하여 항상 성공 확률이 가장 높은 방향으로 거래할
Top Bottom Tracker MT4
Rodrigo Arana Garcia
탑 바텀 트래커는 시장 추세를 분석하고 추세의 고점과 저점을 감지할 수 있는 정교한 알고리즘을 기반으로 하는 지표입니다 / MT5 버전 . 가격은 500$에 도달할 때까지 점진적으로 상승합니다. 다음 가격 --> $99 특징 다시 칠하지 않음 이 표시기는 새 데이터가 도착해도 값을 변경하지 않습니다 거래 쌍 모든 외환 쌍 기간 모든 기간 파라미터 ==== 인디케이터 구성 ==== 구성 매개 변수 // 40 (값이 높을수록 신호가 적지만 더 정확한 신호가 제공됩니다) 상위 레벨 값 // 80 (상단 수평선의 값) 하단 레벨 값 // 20 (하단 수평선 값) 인디케이터 계산 막대 수 // 3000 (인디케이터를 계산할 막대 수). 값 0은 모든 막대에 대해 인디케이터를 계산합니다) ==== 알람 구성 ==== 팝업 알림 // 참(터미널에서 알람) 이메일 알림 // 참(이메일로 알람 전송) 알람 시간 간격 // 10 (분 단위의 알람 간격) 경고
Neuro Poseidon MT4
Daria Rezueva
4.73 (45)
Neuro Poseidon is a new indicator by Daria Rezueva. It combines precise trading signals with adaptive TP/SL levels - creating best possible trades as a result! Message me and get  Neuro Poseidon Assistant  as a gift to automize your trading process! What makes it stand out? 1. Proven profitability on all assets and timeframes 2. Only confirmed BUY and SELL signals present on the chart 3. Adaptive TP & SL levels generated by the software for each trade 4. Easy to understand - suitable for all
CRT Multi-Timeframe Market Structure & Liquidity Sweep Indicator Non-Repainting | Multi-Asset | MT5 Version Available MT5 Version:   https://www.mql5.com/en/market/product/162075 Full User Guide — explains what each feature does and why:   https://www.mql5.com/en/blogs/post/767525 Quick Start User Guide  — explains how to configure and in what order:  https://www.mql5.com/en/blogs/post/767540 Indicator Overview CRT Ghost Candle HTF Fractal is a complete institutional-grade market structure too
Trend Lines PRO
Roman Podpora
5 (2)
트렌드 라인즈 프로       이 지표는 시장이 실제로 어떤 방향으로 전환되는지 파악하는 데 도움이 됩니다. 실제 추세 반전 지점과 주요 시장 참여자들이 다시 진입하는 지점을 보여줍니다. 보시다시피       BOS 라인       복잡한 설정이나 불필요한 노이즈 없이 더 높은 시간대의 추세 변화와 주요 레벨을 확인할 수 있습니다. 신호는 차트에 다시 그려지지 않고 캔들이 마감된 후에도 계속 표시됩니다. VERSION MT 5   -   RFI LEVELS PRO   표시기   와 결합할 때 최대 잠재력을 발휘합니다. 지표가 보여주는 내용: 실제 변화       추세(BOS 라인) 한 번 신호가 나타나면 그 신호는 계속 유효합니다! 이는 신호를 발생시킨 후 변경될 수 있는 리페인팅 방식의 지표와 중요한 차이점입니다. 리페인팅 방식의 지표는 잠재적으로 자금 손실로 이어질 수 있습니다. 이제 더욱 높은 확률과 정확도로 시장에 진입할 수 있습니다. 또한 화살표가 나타난 후 목표가(익절)
제작자의 제품 더 보기
SMC Visual indicator MT4
Gabriel Balbino De Oliveira
SMC Visual Indicator – Trade Like Smart Money Most traders spend hours trying to identify market structure, liquidity zones, Fair Value Gaps, and potential reversals. By the time they finish their analysis, the market has already moved. SMC Visual Indicator v6 does the hard work for you. Built around advanced Smart Money Concepts (SMC) and ICT methodologies, this indicator automatically identifies the key areas where institutional traders leave their footprints. Imagine opening your chart and in
Price Action Alpha Pro MT4
Gabriel Balbino De Oliveira
PRICE ACTION PRO v4. 90 — The Smart Chart Pattern Scanner for MetaTrader 4 Transform how you analyze the market with Price Action Pro v4. 90, the most advanced version of this powerful indicator that automatically detects key chart patterns and trend reversal or continuation signals in real time. Forget spending hours analyzing charts manually. Price Action Pro continuously scans the market and highlights high-probability opportunities directly on your chart — now featuring context validation
AlphaTrend Pullback Pro mt4
Gabriel Balbino De Oliveira
AlphaTrend Pullback Pro MT4 Trend-following pullback signals, economic news filter, and professional dashboard — all in one indicator. AlphaTrend Pullback Pro transforms trend and correction analysis into clear, actionable visual signals. It identifies the macro market direction on a higher timeframe, waits for a pullback to the moving average, confirms rejection with a trend-aligned close, and triggers the entry point. No repainting on closed bars, no noise, no complexity. Why AlphaTrend Pullba
Correlation Radar pro MT4
Gabriel Balbino De Oliveira
Correlation Radar PRO — Multi-Asset Correlation Dashboard for MetaTrader 4 Short Description: Eliminate market noise and spot price divergences in seconds. Correlation Radar PRO calculates historical, monthly, weekly, and real-time correlations across multiple assets and lets you overlay candles directly on your chart without switching your main symbol. Full Description: Manually switching charts to understand inter-market relationships wastes precious time and leads to missed setups. Correlatio
NexusFlow MTF Pro MT4
Gabriel Balbino De Oliveira
NexusFlow MTF Pro MT4 — The Ultimate Multi-Timeframe Power for MetaTrader 4 Tired of trading on the M5 or M15 timeframe only to realize too late that the H1 or H4 trend was completely against your entry? Lost count of how many times you had to open multiple windows, constantly switch charts, or clutter your screen with confusing indicators just to align the market direction? NexusFlow MTF Pro MT4 was engineered specifically to eliminate this operational friction and elevate your flow and trend a
QuantVortex Gold Alpha V13
Gabriel Balbino De Oliveira
QUANT VORTEX ELITE V13 — The XAUUSD (Gold) Specialist QuantVortex Elite V13 is a high-performance algorithmic trading framework specifically engineered for XAUUSD (Gold) on the M30 (Highly Optimized) and H1 timeframes. Developed for professional traders, asset managers, and prop firm evaluators, this advanced automated system combines the precision of multi-period momentum analysis with a proprietary structural filtering architecture named the Luminus Engine . Unlike common grid or martingale
Luminus Gold Pro
Gabriel Balbino De Oliveira
Luminus PRO – High-Performance Quantitative Algorithm Luminus PRO is a fully automated Expert Advisor (EA) engineered for traders and investors seeking institutional consistency and mathematical precision in global financial markets. By combining macro trend tracking with dynamic volatility layers, this EA executes trades surgically, maximizing profit potential while keeping risk under strict control. Forget strategies that rely on luck. Luminus PRO is built purely on statistical data and ra
Luminus Market Regime PRO
Gabriel Balbino De Oliveira
Luminus Market Regime PRO — Know WHAT the Market Is Before You Trade Stop trading setups in the wrong context. The Luminus Market Regime PRO tells you exactly what the market is doing — before you place a single order. The Problem Every Trader Faces Most indicators answer "where is price going?" The Luminus Market Regime PRO answers the more important question: "Is it worth trading right now?" Losses come not from bad signals — but from trading a good signal in the wrong market environment.
Nexus Prime AIO
Gabriel Balbino De Oliveira
Nexus Quantum AIO – Your Ultimate Trading GPS Tired of messy charts and confusing signals? Most traders fail because they operate in the dark, guessing where the price will go. Nexus Quantum AIO is a complete visual decision-making system. It takes complex institutional calculations and translates them into simple colors and signals on your screen. What does it do for you? The Market Traffic Light: It colors your candles and background. Green (Strong Uptrend), Red (Strong Downtrend), and Gray (S
SupResAI Market Pro
Gabriel Balbino De Oliveira
Elevate your trading to an institutional level. SupRes AI v7 is the ultimate all-in-one indicator for MetaTrader 5, engineered to map the market in real-time with mathematical precision. Say goodbye to time-consuming manual analysis; this dashboard centralizes everything you need for fast, profitable execution directly on your chart. Key Features: Dynamic Support & Resistance: Advanced algorithm that identifies and clusters high-relevance price zones, featuring a retest counter (level strength
SMC Visual indicator
Gabriel Balbino De Oliveira
SMC Visual Indicator v6 – Trade Like Smart Money Most traders spend hours trying to identify market structure, liquidity zones, Fair Value Gaps, and potential reversals. By the time they finish their analysis, the market has already moved. SMC Visual Indicator v6 does the hard work for you. Built around advanced Smart Money Concepts (SMC) and ICT methodologies, this indicator automatically identifies the key areas where institutional traders leave their footprints. Imagine opening your chart and
UpPulse
Gabriel Balbino De Oliveira
UpPulse Gaussian Signal – Master Trends with Mathematical Precision Are you tired of false breakouts and lagging indicators that get you into trades when the move is already over? Discover UpPulse Gaussian Signal , a high-performance indicator for MetaTrader 5 (MT5) engineered for traders who demand surgical precision and statistical validation before risking capital. UpPulse combines the advanced smoothing power of a Gaussian Filter (ALMA Core) with the institutional momentum tracking of the AD
Price Action Alpha Pro
Gabriel Balbino De Oliveira
PRICE ACTION PRO v4. 90 — The Smart Chart Pattern Scanner for MetaTrader 4 Transform how you analyze the market with Price Action Pro v4. 90, the most advanced version of this powerful indicator that automatically detects key chart patterns and trend reversal or continuation signals in real time. Forget spending hours analyzing charts manually. Price Action Pro continuously scans the market and highlights high-probability opportunities directly on your chart — now featuring context validation
AngleMeter Pro
Gabriel Balbino De Oliveira
Turn market slope into your greatest trading advantage! Tired of lagging and subjective indicators? AngleMeter Pro is here to revolutionize your chart analysis in MetaTrader 5. Powered by advanced trigonometry and statistical linear regression, it measures the exact trend angle in real time using a striking visual protractor with a continuous color gradient. Featuring dual-timeframe support for macro context analysis, dynamic bisection channels, an embedded normalized mini-chart, and an interact
AlphaTrend Pullback Pro
Gabriel Balbino De Oliveira
AlphaTrend Pullback Pro Trend-following pullback signals, economic news filter, and professional dashboard — all in one indicator. AlphaTrend Pullback Pro transforms trend and correction analysis into clear, actionable visual signals. It identifies the macro market direction on a higher timeframe, waits for a pullback to the moving average, confirms rejection with a trend-aligned close, and triggers the entry point. No repainting on closed bars, no noise, no complexity. Why AlphaTrend Pullbac
CorrelationRadarPRO
Gabriel Balbino De Oliveira
Correlation Radar PRO — Multi-Asset Correlation Dashboard for MetaTrader 5 Short Description: Eliminate market noise and spot price divergences in seconds. Correlation Radar PRO calculates historical, monthly, weekly, and real-time correlations across multiple assets and lets you overlay candles directly on your chart without switching your main symbol. Full Description: Manually switching charts to understand inter-market relationships wastes precious time and leads to missed setups. Correlatio
NexusFlow MTF Pro
Gabriel Balbino De Oliveira
[MT5] NexusFlow MTF Pro | Display up to 50 moving averages from higher time frames without switching time frames. Supports crossover alerts. NexusFlow MTF Pro is an MT5 indicator that allows you to overlay moving averages from any time frame—such as “daily,” “4-hour,” or “1-hour”—on your current chart. For example, while viewing a 30-minute chart, you can simultaneously check the 20-period MA on the daily chart or the 50-period MA on the 4-hour chart. This eliminates the need to open and compar
Sidus Pro
Gabriel Balbino De Oliveira
Sidus Pro for MetaTrader 5: The Ultimate Evolution of the Classic Sidus Method Turn your trend analysis into a true statistical edge. Sidus Pro reinvents the renowned moving average crossover and volatility channel method, combining mechanical precision, visual automation, and macroeconomic intelligence into a single professional interface. Forget amateur indicators that repaint past data or generate blind noise in sideways markets. Sidus Pro is engineered under rigorous MQL5 standards to delive
Puria Pro
Gabriel Balbino De Oliveira
PURIA METHOD PRO MT5 — The Ultimate Evolution of the Classic Puria Strategy Tired of lagging indicators, repainting arrows, or false signals that drain your account? Puria Method Pro was engineered for serious traders looking for surgical precision, visual automation, and robust trading logic. Built upon the world-renowned Puria Method (EMA 5 crossing the dual LWMA 75/85 Low channel) combined with a fast MACD (15, 26, 1) filter , this PRO edition turns a classic institutional strategy into a
TriConfluence Pro
Gabriel Balbino De Oliveira
TriConfluence Pro: The End of False Breakouts and Blind Speculation Tired of losing money to fake signals, lagging indicators, and choppy sideways markets? Most traders fail because they trade market noise instead of true price structure. TriConfluence Pro is built upon a rigorous triple-confluence methodology. It eliminates guesswork by combining three of the market's most powerful and respected tools— Bollinger Bands, RSI, and ADX —into a smart, automated dashboard right on your MetaTrader cha
TriSync
Gabriel Balbino De Oliveira
TriSync User Manual Market Structure Indicator for MetaTrader 5 · Version 0.40 1. What It Is TriSync shows market structure in layers on a single chart: four nested swing levels, VWAP anchored to swing highs and lows, Daily VWAP, higher-timeframe support and resistance, three-timeframe bias, and confirmed entry arrows on closed bars. The core idea is a reading order: Location first. Context second. Timing last. The arrow is step 3, never step 1. What it is not: it is not a robot, not a blind sig
필터:
리뷰 없음
리뷰 답변