WatchCat MACD TV

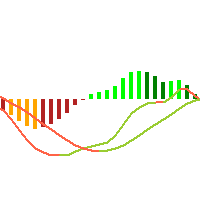
WatchCat MACD TV is a visual MetaTrader 5 oscillator based on classic MACD math. It shows a four-color histogram with tight gutters, a blue MACD line, an orange Signal line, and a blinking bead on the latest near-zero golden or death cross.

The histogram uses canvas drawing so columns stay compact and easy to read. Default calculation is EMA 12 minus EMA 26, with a Signal line of EMA 9. A simple moving average option is also available for the Signal line if you prefer that style.

This product is visual only. It never opens or closes trades, never shows popups, never sends alerts, and does not use a DLL. Add it to a chart when you want a clean MACD picture with a clear near-zero cross highlight.

Features:
Classic MACD: EMA12 minus EMA26, Signal EMA9 (SMA option)
Four-color histogram with tight gutters (canvas)
Blue MACD line plus orange Signal line
Blinking bead on the latest near-zero golden or death cross
Visual only, no popups, no alerts, never trades, no DLL
추천 제품
MA Flow No.2 See the Flow of Bulls & Bears at a Glance, and Keep the Rhythm of the Market in Your Hands Tired of staring at dozens of moving averages until your eyes blur? Unsure when to enter, or where to place your stop? MA Flow No.2 upgrades the humble moving average into a complete trend-trading system. No more scattered lines on your chart — instead, a living "river of bulls and bears". Up to 100 moving averages roll together in real time. On every single bar, you can see at a glance w
Ragoran Delivery Zone SMC
Tanin Sadat Hosseininasab
Ragoran Delivery Zone SMC Ragoran Delivery Zone SMC is a supply and demand zone indicator based on Smart Money Concepts. It displays supply and demand zones on the chart, divided into two classes: Major and Minor. Each zone can show its touch count, its size in pips, its formation date, and, optionally, a suggested trade volume based on the account balance and the risk percentage set by the user. Zones that reach the maximum touch count, or whose far boundary line (L3) is touched, are removed
ATR SuperTrend
Paulo Henrique Faquineli Garcia
A ‘Supertrend’ indicator is one, which can give you precise buy or sell signal in a trending market.  As the name suggests, ‘Supertrend’ is a trend-following indicator just like moving averages and MACD (moving average convergence divergence). It is plotted on prices and their placement indicates the current trend. The Supertrend indicator is a trend following overlay on your trading chart, much like a moving average, that shows you the current trend direction. The indicator works well in a tren
Divergence Matrix Pro for MetaTrader 5 Divergence Matrix Pro is a confirmed multi-oscillator divergence indicator for MetaTrader 5. It detects regular and hidden divergence between price and selected oscillators, then presents the confirmed structure through divergence lines, pivot labels, action markers, an optional current-timeframe Matrix Panel and optional alerts. The indicator is an analysis and confirmation tool. It does not open or close trades, and the signal score is not a win rate or a
Divergence MACD
Alexey Topounov
Divergence MACD indicator shows price and MACD indicator divergence. The indicator is not redrawn! The algorithm for detection of price and MACD extremums has been balanced for the earliest entry allowing you to use the smallest SL order possible. The indicator displays all types of divergences including the hidden one, while having the minimum number of settings. Find out more about the divergence types in Comments tab. Launch settings: Max Bars - number of bars calculated on the chart. Indent
Hi Low Last Day
Igor Vishnevskii
The Hi Low Last Day ( Hi Lo Last Day ) indicator shows the high and low of the last trading day and the second trading day, as well as the minimum and maximum of last week . There are many trading strategies on the daily levels. This indicator is indispensable when using such trading strategies. In fact, everything is simple in trading, you just need to understand and accept it for yourself. There is only price!!! What is price? This is the level on the chart. The level is the price that the buy
The background trend is an indicator that helps us to know the trend that is dragging the market. The indicator has 2 possibilities: 1) If the indicator is   above   zero the trend is   buying   and the indicator will be   green. 2) If the indicator is   below   zero, the trend is   selling   and the indicator will be   red. You can download the demo and test it yourself. The indicator has a text help in the upper right corner, in which it shows whether the indicator has a   bullish   or   b
Smc Trend Heatmap
tradinsolutions
Smc Trend Heatmap The Smc Trend Heatmap is a free multi-timeframe bias dashboard for MetaTrader 5. It scans five timeframes simultaneously - M5, M15, M30, H1, and H4 - and shows the current trend direction on each using a three-condition EMA logic. The dashboard updates continuously in a corner panel and provides an overall bias summary across all active timeframes. The indicator does not draw lines or arrows on the price chart. It operates entirely as a panel and can be placed on any chart rega
FREE
ZamanCyclesPOC
Mahmoud Sabry Mohamed Youssef
Everyone knows how to analyze the market , which level to buy / sell  this is an easy job , which leads to unusual horrible loses , very little few people knows WHEN then enter the market , time is Money , this is the key!!! This version is a Proof of concept limited version of ZamanCYcles founded here: https://www.mql5.com/en/market/product/81883?source=Site +Market+Product+Page This works Only on 3 Minutes Time frame for 45 Candles Get rest of planets and more than 10 other algorithms to pred
FREE
A professional-grade trend detection system built on a proprietary 5-layer SuperTrend engine. Instead of relying on a single indicator, it aggregates five independently tuned SuperTrend members through a weighted voting mechanism — filtering out noise and delivering only high-confidence directional signals. Complete User Guide Core Advantages Non-repainting — signals are locked on bar close, never move Zero lag — fires the moment is reached, no smoothing delay Smart filtering — momentum confirma
MACD Multi-Timeframe Dashboard shows whether MACD is bullish or bearish on four timeframes at once, by comparing the MACD line to its signal line on each timeframe. You read the direction of momentum across the whole market in a single panel instead of switching charts. By default it covers the M15, H1, H4 and D1 timeframes, and the fast, slow and signal settings are configurable. Each timeframe appears in green when momentum is bullish and red when it is bearish, and the histogram value is show
FREE
RED ZONE Monitor Loss-Cut & Break-Even Risk Monitor for Averaging Traders (MT5) RED ZONE Monitor is a risk management indicator for traders who use averaging, scaling-in, or multiple open positions . It visually displays: The loss-cut (liquidation) risk zone The break-even price Based on current open positions, lots, and margin conditions This indicator does not provide entry signals. It does not promise profits. It shows where your account actually fails if price moves against you. What RED ZO
MACD divergence indicator finds divergences between price chart and MACD indicator and informs you with alerts (popup, mobile notification or email) . Its main use is to find trend reversals in the chart. Always use the divergence indicators with other technical assets like support resistance zones, candlestick patterns and price action to have a higher possibility to find trend reversals. Three confirmation type for MACD divergences: MACD line cross zero level Price returns to previous H/L Crea
FREE
Chaikin Volatility Indicator
MetaQuotes Ltd.
4.33 (3)
Chaikin's volatility indicator calculates the spread between the maximum and minimum prices. It judges the value of volatility basing on the amplitude between the maximum and the minimum. Unlike Average True Range , Chaikin's indicator doesn't take gaps into account. According to Chaikin's interpretation, a growth of volume indicator in a relatively short space of time means that the prices approach their minimum (like when the securities are sold in panic), while a decrease of volatility in a l
FREE
TCT BB PANEL - Bollinger Bands Dashboard MASTER VOLATILITY WITH BOLLINGER BANDS The TCT BB PANEL monitors Bollinger Bands, identifying volatility squeezes and price extremes. WHAT YOUR DASHBOARD DISPLAYS Account: Balance, Equity, Profit, Drawdown Positions: Buys, Sells, Total BB: Upper, Middle, and Lower Bands Milestones: Detection, Last Touched, Next
Heiken_Ashi_Bars - MT5용 고급 추세 시각화 도구 개요 Heiken_Ashi_Bars 는 시장의 노이즈를 필터링하고 진정한 기본 추세를 강조하도록 설계된 강력하고 시각적으로 직관적인 사용자 지정 지표입니다. 기존의 캔들스틱 차트는 불규칙하여 거짓 신호와 섣불린 청산을 유발할 수 있습니다. 이 지표는 가격 데이터를 평균화하여 가격 움직임을 부드럽게 만들어 추세 지속, 반전 및 수익성 있는 진입 구간을 훨씬 쉽게 파악할 수 있도록 해줍니다. 주요 기능 및 장점 강력한 노이즈 감소: 사소한 가격 급등 및 횡보 노이즈를 필터링합니다. 명확한 시각적 신호: 색상으로 구분된 막대를 통해 강세 및 약세 모멘텀을 한눈에 파악할 수 있습니다. 리페인트 없음 (No Repaint): 막대가 마감되면 신호가 고정됩니다. 과거 막대를 다시 계산하지 않습니다. 고도로 최적화됨: 터미널 지연이 없도록 깔끔하게 코딩되었습니다. 다양한 활용: 모든 금융 상품(외환, 지수, 금속, 암호화폐)에서
MiniMACD
Kiyoshi Mizu Miyabi Nori
4.8 (10)
This is just a MACD with multi symbols, multi timeframes, and multi colors. features. different symbols and timeframes from the main chart. draw main line, signal line, and histogram. each line can be erased. the ascent and descent can be distinguished.  Due to the above features, this MACD is suitable for multiple lineups in a single chart. This can be used in the same way as MiniCandles.  
FREE
Basic information. To perform its work, the indicator takes data on volumes from a lower timeframe, builds Market Profiles for a higher timeframe and a histogram for the current timeframe. The indicator starts in several stages. In this case, messages like: "Build Source & Target TF. Step: …" are output to the log. The process can be accelerated by changing the input parameter Milliseconds between steps - the initialization speed. The final value of this parameter is always individual and is set
The   Trendlines Oscillator   helps traders identify trends and momentum based on the normalized distances between the current price and the most recently detected bullish and bearish trend lines. The indicator features bullish and bearish momentum, a signal line with crossings, and multiple smoothing options. USAGE The   Trendlines Oscillator   works by systematically: Identifying pivot highs and lows. Connecting pivots to form bullish (support) and bearish (resistance) trendlines. Measuring
IQuantum
Evgeniy Scherbina
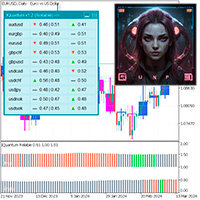
The indicator IQuantum shows trading signals for 10 symbols in the daily chart: AUDCAD, AUDUSD, EURUSD, GBPCAD, GBPCHF, GBPUSD, NZDUSD, USDCAD, USDCHF, and USDJPY. Signals of the indicator are produced by 2 neural models which were trained independently from one another. The inputs for the neural models are normalised prices of the symbols, as well as prices of Gold, Silver and markers of the current day. Each neural model was trained in 2 ways. The Ultimate mode is an overfitted neural model
FREE
Astral Momentum
Ottaviano De Cicco
Astral Momentum Separate the impulse from the momentum picture. Launch Special — $78 · Save 35% · $120 after launch. A fast price impulse and a momentum turn are different readings. For discretionary traders who want to understand their relationship, Astral Momentum separates them visually and brings higher-timeframe context into the same workspace. Understand what is changing. Compare the immediate impulse with the momentum curve's direction instead of treating them as one measurement. Set a co
UT Bot + Kernel Regression Advanced Trend Identification & Volatility Filtering The UT Bot + Kernel Regression indicator is a professional-grade technical analysis tool engineered for precise market timing. By combining the highly popular, volatility-based UT Bot with the institutional-grade smoothing of Nadaraya-Watson Kernel Regression, this tool provides traders with a robust framework for identifying high-probability entry and exit points while drastically reducing false signals in ranging m
KS_RSI_Divergence 이 지표는 MetaTrader 5(MT5)용 RSI 다이버전스 지표입니다. 가격과 RSI 사이의 '정규(Regular)' 및 '히든(Hidden)' 다이버전스를 식별하여, 잠재적인 추세 반전 및 추세 지속 신호를 포착해 줍니다. 이 지표가 마음에 드시거나 실제로 사용하고 계시다면, 앞으로도 더욱 창의적인 트레이딩 컨셉을 개발할 수 있도록 긍정적인 피드백을 남겨주시면 감사하겠습니다. 핵심 목적 가격과 RSI가 서로 동조하지 않고 움직이는 시점을 자동으로 감지하여, 다음 신호들을 강조 표시해 줍니다: 반전 신호 (정규 다이버전스) 추세 지속 신호 (히든 다이버전스) 주요 기능 기능 | 설명 RSI 플롯 | 별도의 창에 표준 레벨(30, 50, 70)과 함께 깔끔한 RSI 라인(기본값 14)을 표시합니다. 정규 강세 다이버전스 | 가격은 저점을 낮추는데 RSI는 저점을 높이는 경우 → 강력한 강세 반전 신호 (녹색) 히든 강세 다이버전스
JAC Trend Color Candle
Eduardo Da Costa Custodio Santos
The indicator "JAC Trend Color Candle" for Meta Trader 5, was created to visually facilitate the trend for the trader. It is based on three parameters, which identifies the uptrend, downtrend and non-trending market. The colors are trader-configurable, and the average trader-configurable as well. trend parameters cannot be configured as they are the indicator's differential.
Fabii Coral Trend
Fabien Georges Andre Guillemaud
Know your trend bias on two timeframes at once — no repaint, signals final on bar close. Any pair, any timeframe, any market. Free demo in the Strategy Tester. >> Get more free and premium indicators here Baseline, volatility, oscillators & more. No repainting. No guessing. Just clean signals. THE PROBLEM You know the chart-timeframe trend. But you do not know whether the higher timeframe agrees — until you flip to it, then flip back, and the moment is gone. Entering with the short-t
FREE
The indicator plots the buying and selling volume on the chart. Two lines are generated corresponding to the average purchase and sale volumes. The crossing of averages, the increase in their distance are good indicators of market movement. Know our products    NOTES : It is recommended to use the default configuration and VPS values.  You need trading information (Time and Sales).   Parameters : Aggression Numbers of days prior to the current one for calculation; Volume Divider e; Enabl
Adapted to MetaTrader 5 cRSI – Cyclic Smoothed Relative Strength Index indicator from an open-source license This useful open-source indicator is available for you to use completely free of charge. This indicator is an adaptation for the MetaTrader 5 (MQL5) platform of WTT_cRSI.mq5 , originally published in 2017 by WhenToTrade and licensed under the Creative Commons Attribution 4.0 International (CC BY 4.0) license. The original work is based on the dominant cycle principles described in the bo
FREE
FOTSI Indicator
Leonardo Daniel Isaia
1 (1)
FOTSI – 외환 진정 강도 지수 개요 각 통화의 진정한 강도를 발견하고 우위를 가지고 거래하세요. FOTSI 지표 는 모든 주요 통화(USD, EUR, GBP, JPY, CHF, AUD, CAD, NZD)의 실제 모멘텀을 모든 통화쌍에서 측정하는 다중 통화 오실레이터 입니다. 단일 차트를 분석하는 대신, FOTSI는 여러 통화쌍의 데이터를 결합하고 움직임을 평활화하며, True Strength Index (TSI) 알고리즘을 적용하여 각 통화의 상대적 강도를 명확하고 안정적이며 지연 없이 제공합니다. 주요 특징 다중 통화 오실레이터: 각 통화의 강도를 독립적으로 측정합니다. 과매수 및 과매도 수준: +50 → 통화 과매수 (조정 확률 높음). –50 → 통화 과매도. ±25 → 중립 영역. 간단한 해석: 0 이상/이하 곡선 = 강도/약점. 리페인트 없음: 모든 계산은 실시간으로 수행되며 안정적입니다. 모든 통화쌍과 시간 프레임에서 호환: 신뢰성을 위해 H1, H4, D1 권장.
Price Alerts Advanced Suite for MetaTrader 5 Take control of your trading execution with the Price Alerts Advanced Suite , a professional-grade technical analysis tool built exclusively for MetaTrader 5. This suite goes far beyond simple horizontal lines; it is a complete analytical ecosystem designed to identify key market levels, monitor price action in real-time, and deliver instant notifications across multiple channels. Whether you are a day trader, swing trader, or algorithmic develope
Supreme Multi TF Pro
Stefania Hellmann
Supreme Multi TF Pro is an advanced indicator for MetaTrader 5 that automatically analyzes multiple timeframes — from M1 to Monthly — using a combination of MA, MACD, and ADX. It clearly displays signals for Buy , Sell , or Hold on each timeframe, and highlights the Best Timeframe to trade . Perfect for traders seeking fast and reliable decisions, with intuitive and color-coded panels. Customize parameters to fit your strategy and trade with greater confidence.
이 제품의 구매자들이 또한 구매함
Trend Sniper X
Sarvarbek Abduvoxobov
4.86 (44)
Trend Sniper X 는 트레이더가 추세 방향과 잠재적 반전 지점을 명확하고 정확하게 포착할 수 있도록 도와주는 MetaTrader 5용 멀티 타임프레임 추세 추종 지표입니다. MT4용: https://www.mql5.com/en/market/product/193245 가격 정보: 현재 가격은 프로모션 할인가이며, 향후 업데이트 및 새로운 기능이 출시됨에 따라 변동될 수 있습니다. 보너스 혜택: 본 지표 전용 무료 자동매매 Assistant EA를 받으시려면 구매 후 작성자에게 메시지를 보내주시기 바랍니다. Code2Profit 채널 멀티 타임프레임 분석으로 시장을 마스터하세요! Trend Sniper X로 승률을 극대화하는 방법: 핵심 규칙 및 세션 팁 기술 사양 플랫폼 MetaTrader 5 지표 유형 멀티 타임프레임 추세 지표 운용 타임프레임 모든 차트 타임프레임 지원, 독립적으로 선택 가능한 상위 타임프레임(M1–MN1) 주요 상품 외환, 금(XAUUSD) 및 기타 C
새로운 왕의 등장 - 인디케이터 + 주문 관리 표시(TP1 + TP2 + TP3) + 선택형 텔레그램 시그널 전송 기능 포함 (무료) (완전한 트레이딩 및 시그널 시스템) 골드를 위한 최고의 EA: Gold Slayer 이 인디케이터는 고급 전략, 사용자 지정 가능한 주문 관리 시스템, 그리고 엔벨로프 확장을 결합한 평균 회귀(mean reversion) 시스템을 포함하고 있습니다. 또한 RSI와 같은 여러 지능형 확인 필터를 통해 높은 확률의 반전 진입 구간을 포착하여 BUY 및 SELL 시그널을 제공합니다. 단순히 거래 방법만 배우는 것이 아니라, 여러 포지션을 효과적으로 관리하고 이전에 수익 중인 오픈 포지션으로 손실 거래를 커버하는 방법까지 익힐 수 있습니다. M5 전용으로 설계 및 최적화되었으며, 유동성이 풍부해 시그널이 더 깔끔하고 신뢰도 높은 BTCUSD와 XAUUSD에서 뛰어난 성능을 발휘합니다. 이 인디케이터는 ATR 기반으로 자동 계산된 진입가, 손절가, 익절가와
Smart Trend Trading System — MetaTrader 5 구매 후 MQL5에서 저에게 메시지를 보내시면 Smart Universal Expert Advisor를 무료로 받으실 수 있으며, 온라인 강좌, PDF 매뉴얼 및 비공개 그룹 이용 권한도 함께 제공됩니다. STTS는 추세 방향, 진입·청산 신호, 반전 구간, 주요 가격 수준을 차트에 모아 보여줍니다. 시스템을 참고해 수동으로 거래하거나, 별도의 호환 EA를 연결하여 선택한 설정에 따라 자동으로 거래를 실행할 수 있습니다. 하나의 시스템, 네 가지 트레이딩 접근법 STTS의 트레이딩 접근법은 크게 네 가지로 나뉩니다. • 스캘핑 — 단기 신호와 시장 움직임을 살펴봅니다. • 추세 매매 — 방향을 평가하고 추세 안에서 기회를 찾습니다. • 반전 매매 — 잠재적인 전환 구간과 방향 변화를 파악합니다. • 거래량 매매 — 거래량 기반 정보로 시장 활동을 평가합니다. 진입·청산 화살표, 추세 정보, 지지·저항 수
Zoryk Gold
Reda El Koutbane
4.78 (18)
ZORYK — MetaTrader 5용 XAUUSD 전문 신호 및 트레이드 플래닝 시스템 이런 경험이 있을 것입니다. 골드를 분석하고 진입을 기다린 뒤 마침내 포지션을 열었지만 가격이 곧바로 반대 방향으로 움직입니다. 너무 일찍 청산하거나 Stop Loss를 옮기거나 몇 초 동안 망설입니다. 그 후 시장은 내가 없이도 처음 예상했던 목표까지 정확히 움직입니다. 문제는 항상 방향이 아니었습니다. 진짜 문제는 불확실성이었습니다. 정확한 진입 위치를 몰랐습니다. 어느 지점에서 원래의 트레이드 아이디어가 무효가 되는지 몰랐습니다. 가까운 수익을 확보해야 할지 더 큰 움직임을 기다려야 할지 판단하기 어려웠습니다. 현재 setup이 정말 강한지 아니면 단지 새로운 거래를 억지로 찾고 있는지도 확신하기 어려웠습니다. 골드는 매우 빠르게 움직입니다. 명확한 계획이 없다면 좋은 분석도 몇 초 만에 나쁜 결정으로 바뀔 수 있습니다. ZORYK는 이 문제를 해결하기 위해 개발되었습니다.
Entry Points Pro for MT5
Yury Orlov
4.52 (152)
Entry Points Pro는 주문을 넣기 전에 어디에서 진입하고, 스탑을 어디에 두고, 어떤 랏으로 거래할지 보여 줍니다. 가격 지금 149 USD이며, 이 가격으로는 마지막 1카피입니다. 이후 가격은 199 USD로 오르고, 최종 가격은 349 USD입니다. 저는 시장에서 트레이딩으로 돈을 벌고 그것을 보여 드립니다. 그래서 이 인디케이터를 모두에게 팔 필요가 없습니다. 스스로 생각하는 트레이더를 위한 도구이지, 마법 버튼이 아닙니다. 화살표는 캔들이 마감될 때 나타나며 리페인팅되지 않습니다. 설정은 두 가지: 예치금과 거래당 리스크. 결제 전에 확인하세요: 무료 데모는 MT5 전략 테스터에서 작동하며 2분이면 됩니다. 구매 후에는 제가 직접 설정을 도와 드리겠습니다. 2019년, 저는 이 지표가 무엇을 할 수 있는지 전 세계에 보여 주었습니다. 실계좌에서 지표의 시그널에 따라 수동으로, 모두가 볼 수 있게 공개적으로 거래했습니다 — 계좌는 Myfxbook에서 모니터링되었고,
M5 Sniper
MeanFX
5 (4)
당신의 트레이딩 우위를 한눈에 확인하세요! M5 Sniper 는 MeanFX의 새로운 지표입니다. 정확한 트레이딩 신호 와 적응형 TP/SL 레벨 을 결합하여, 결과적으로 가능한 최고의 통계적 트레이딩을 만들어냅니다! 5회 구매마다 가격이 인상되며, 다음 가격은 69$입니다. 구매 후 저에게 메시지를 보내주시면 팁/가이드와 보너스 EA를 제공해 드립니다. 무엇이 이 지표를 특별하게 만들까요? Gold XAUUSD에서 검증된 통계적 성과 ( 거의 모든 자산에서 작동 하며, 일관된 결과 없이 모든 것을 다루려고 하기보다는 하나의 타임프레임을 완전히 익히는 데 집중합니다) 각 심볼당 하루 1~8회의 트레이드 와 높은 승률을 제공하며, 모든 통계적 우위를 우리의 편으로 가져갑니다. 차트에는 확인된 BUY 및 SELL 신호만 표시됩니다. 각 트레이드에 대해 지표가 생성하는 적응형 TP 및 SL 레벨 평균 승률 75%+ 평균 Signal Ratio 최소 1.1+ 알람 및 알림이 휴대폰 으로도
SuperScalp Pro
Van Minh Nguyen
4.54 (37)
SuperScalp Pro - Professional Multi-Layer Confluence Scalping System SuperScalp Pro는 기존 Supertrend에 여러 지능형 확인 필터를 추가하여 기능을 강화한 고급 스캘핑 지표입니다. 잘못된 신호를 크게 줄이면서 성공 가능성이 더 높은 Buy/Sell 거래 기회를 식별하는 데 도움을 줍니다. 명확한 Buy 및 Sell 화살표가 차트에 직접 표시되며, ATR 기반 Stop Loss 및 Take Profit 레벨도 실시간으로 자동 계산됩니다. 구매 후 MQL5 메시지로 저에게 연락하시면 SuperScalp Pro Auto Trader EA를 무료로 받으실 수 있으며, 사용자 가이드와 비공개 그룹 이용 권한도 제공됩니다. 권장 설정 파일 다운로드: [Set File] 전체 문서는 제품 블로그에서 확인할 수 있습니다: [User Guide] 업데이트를 받으려면 공식 채널에 참여하세요: [Official Channel]
Gold Trend Coach MT5
Cristhian Alexander Gaibor Cuasquer
4.2 (10)
Gold Trend Coach는 MetaTrader 5용 금(XAUUSD) 추세 지표로, 캔들 마감에 확정되는 매수·매도 신호(리페인트 없음), 손절과 세 개의 익절 목표, 진입부터 TP3까지 안내하는 코치, 멀티 타임프레임 패널, 휴대폰과 텔레그램 알림을 제공합니다. 런던·뉴욕 세션의 M1·M5 스캘핑과 M15 데이 트레이딩용으로 만들었습니다. 보너스: Gold Trend Coach 자동매매 EA 무료 제공. 구매 후 메시지를 주시면 지표 신호로 자동 매매하는 EA와, 모든 신호·진입·손절·도달한 목표를 텔레그램 채팅, 그룹 또는 채널로 보내는 Telegram Alert Bridge를 set 파일과 설치 가이드와 함께 보내 드립니다. 출시 가격 $39는 처음 20개 한정이었고 이미 매진되었습니다. 현재 가격 40개까지 $45, 이후 $59. 예정된 최종 가격 $79. 아마 이미 수십 개의 금 지표를 써 보셨을 겁니다. 대부분은 화살표로 매수·매도 신호만 주고 가장 어려운 부분, 즉
GoldenX Entry MT5
VividMind Digital Solutions
5 (17)
GoldenX Entry는 MT5용 인디케이터로, 적응형 Smart Entry Trend 알고리즘, 신호 스코어링 시스템, 시장 레짐 감지 기능, 그리고 변동성 필터를 포함합니다. 각 신호에는 계산된 진입 레벨, 3개의 익절(TP1, TP2, TP3) 레벨, 그리고 손절(Stop-Loss) 레벨이 포함됩니다. 이 인디케이터는 다양한 시장 환경에 적응하도록 설계된 다중 분석 레이어 구조 위에 구축되어 있으며, 내장 최적화기와 통계 추적 시스템을 결합합니다. 또한 Risk-to-Reward(RR) 지표와 과거 거래 행동 기반의 정량 분석을 제공합니다. 시작은 간단합니다 — 선택한 타임프레임에서 최적화기를 실행한 뒤 차트에서 바로 인디케이터를 사용하면 됩니다. 핵심 기능 GoldenX Entry는 하나의 차트에서 신호 엔진, 트레이드 관리 기능, 그리고 과거 통계 추적을 통합합니다: - 내장 최적화기: 최적화기는 차트에서 원클릭으로 실행됩니다. 200개의 파라미터 조합을 두 단계 탐색
SMC Intraday Formula
VividMind Digital Solutions
5 (26)
먼저 솔직하게 말하겠습니다. 어떤 인디케이터도 단독으로 당신을 수익성 있게 만들어주지 않습니다. 누군가 그렇게 말한다면, 그는 당신에게 꿈을 파는 것입니다. 완벽한 매수/매도 화살표를 보여주는 모든 인디케이터는 완벽하게 보이도록 만들 수 있습니다 — 단지 올바른 과거 구간을 확대하고 승리한 거래만 캡처하면 됩니다. 우리는 그렇게 하지 않습니다.  SMC Intraday Formula는 도구입니다. 시장 구조를 읽고, 가장 높은 확률의 가격 구간을 표시하며, 현재 스마트 머니의 흐름이 어떻게 보이는지 아주 단순한 언어로 보여줍니다. 최종 결정은 여전히 당신이 합니다. 실행도 당신이 합니다. 하지만 이제는 희망이 아니라 정확성으로 거래하게 됩니다. 우리는 이 인디케이터를 지난 약 3년 동안 골드(XAUUSD) 및 주요 외환 통화쌍의 데이 트레이딩 스캘핑에 사용해 왔습니다. M1, M5, M15, M30에서 우리의 핵심 도구입니다. 이 도구는 미래를 예측하려 하지 않습니다 — 지금 형성
Gann Made Easy MT5
Oleg Rodin
5 (13)
Gann Made Easy 는 mr.의 이론을 사용하여 최고의 거래 원칙을 기반으로 하는 전문적이고 사용하기 쉬운 Forex 거래 시스템입니다. W.D. 간. 이 표시기는 Stop Loss 및 Take Profit Levels를 포함하여 정확한 BUY 및 SELL 신호를 제공합니다. PUSH 알림을 사용하여 이동 중에도 거래할 수 있습니다. 구매 후 거래 방법 안내 및 유용한 추가 지표를 무료로 받으시려면 저에게 연락주세요! 아마도 Gann 거래 방법에 대해 이미 여러 번 들었을 것입니다. 일반적으로 Gann의 이론은 초보자 거래자뿐만 아니라 이미 거래 경험이 있는 사람들에게도 매우 복잡한 것입니다. Gann의 거래 방식은 이론적으로 적용하기 쉽지 않기 때문입니다. 나는 그 지식을 연마하고 Forex 지표에 최고의 원칙을 적용하기 위해 몇 년을 보냈습니다. 표시기는 적용하기가 매우 쉽습니다. 차트에 첨부하고 간단한 거래 권장 사항을 따르기만 하면 됩니다. 지표는 지속적으로 시장 분석
Ultra Indicator
Ihor Otkydach
5 (1)
ULTRA는 “올인원” 방식으로 작동하는 기술적 지표로, 시장을 독자적으로 분석하고, 매매 신호를 생성하며, 손절매 주문 설정 수준을 표시하고, 이익을 실현하거나 손실을 최소화하기 위해 포지션을 청산해야 할 시점을 제안합니다. 다시 말해, 시장을 분석하는 법을 모르거나, 가격 수준(손절매를 어디에 설정할지)을 파악하지 못하거나, 자금 관리에 어려움을 겪더라도 상관없습니다. ULTRA가 그 모든 것을 대신 해줄 테니까요! 구매자 특전 : ULTRA 지표를 구매하신 후, 저에게 비공개 메시지를 보내주시면 “ULTRA BOT”을 무료 선물로 드립니다. 이 도구는 해당 지표의 신호를 바탕으로 개설한 거래를 관리하는 데 도움을 주는 특별한 도구입니다(각 거래에 대해 손절매를 설정하고, 최상의 결과를 얻을 수 있도록 전략의 규칙에 따라 거래를 자동으로 청산해 줍니다).  또한 구매자분들께 다양한 자산에 바로 적용할 수 있는 설정값을 제공해 드리고 있으며, 이를 통해 지표가 최대 효율로 작동할
Boba Analysis Suite
Trade Ready Solutions LLC
5 (2)
Boba Analysis Suite Boba Analysis Suite는 MetaTrader 5용 분석 지표입니다. 시장 구조, 주요 가격 영역, 전반적인 시장 상황을 하나의 차트 화면에 통합하여 표시합니다. 트레이더이자 트레이딩 코치로서의 실무 경험을 바탕으로 개발되었으며, 시장 방향 평가, 주요 가격 수준 식별, 여러 시간대의 종합적인 분석 등 체계적인 분석 과정을 지원합니다. 시장 맥락을 고려한 분석 개별 신호의 의미는 시장 상황에 따라 달라집니다. Boba Analysis Suite는 현재 차트 상황을 더 넓은 시장 구조와 연결하고, 사전에 정한 규칙에 따라 매매 아이디어를 검토할 수 있도록 돕습니다. 주요 분석 기능은 다음과 같습니다. 추세 및 시장 구조: 시장 방향과 관련 구조적 맥락을 평가합니다. 주요 가격 영역 및 수준: 추가 분석이 필요한 중요한 영역을 차트에 시각적으로 표시합니다. 여러 시간대: 서로 다른 시간대의 정보를 통합하여 전반적인 시장 상황을 평가합니다.
다음 업데이트 — 버전 2.52 곧 출시! [신규] 시장 분석 및 트레이딩 워크플로를 향상시키기 위해 설계된 4가지 주요 신규 기능을 기대해 주세요. 트레이딩 요구 사항을 충족하도록 설계된 4가지 새로운 기능으로 시장 분석을 한 단계 더 발전시킵니다. 다음 기능을 소개합니다: 1. TRADE OVERVIEW DASHBOARD 2. CONFLUENCE AT ZONE 3. STRONG & WEAK HIGH/LOW 4. OTE 1. TRADE OVERVIEW DASHBOARD 시장 전체 상황을 더 쉽게 파악할 수 있도록 도와주는 대시보드입니다. 트레이딩 의사결정을 지원하는 가이드를 제공하며, 하나의 화면에서 시장을 분석하고 체계적으로 트레이딩을 계획할 수 있도록 도와줍니다. 멀티 타임프레임 시장 개요 (Multi-Timeframe Market Overview) 시장 방향과 가격 구조를 더욱 명확하게 파악 시장 상황을 빠르게 확인 체계적인 시장 분석 및 진입 계획을 위한 가이드 2. CO
M1 Sniper MT5
Oleg Rodin
5 (7)
M1 SNIPER 는 사용하기 쉬운 거래 지표 시스템입니다. M1 시간대에 맞춰 설계된 화살표 지표입니다. 이 지표는 M1 시간대 스캘핑을 위한 단독 시스템으로 사용할 수 있으며, 기존 거래 시스템의 일부로도 사용할 수 있습니다. 이 거래 시스템은 M1 시간대 거래용으로 특별히 설계되었지만, 다른 시간대에도 사용할 수 있습니다. 원래는 XAUUSD와 BTCUSD 거래를 위해 이 방법을 설계했지만, 다른 시장 거래에도 유용하다는 것을 알게 되었습니다. 이 지표의 신호는 추세 방향과 반대로 거래될 수 있습니다. 저는 지표의 신호를 활용하여 양방향으로 거래할 수 있도록 돕는 특별한 거래 기법을 알려드립니다. 이 방법은 특별한 동적 지지선과 저항선 가격 영역을 활용하는 것을 기반으로 합니다. 구매하시면 M1 SNIPER 화살표 지표를 바로 다운로드하실 수 있습니다. 또한, 아래 스크린샷에 표시된 Apollo Dynamic SR 지표는 M1 SNIPER 도구를 사용하는 모든 사용자에게 무료로
FiboSniper Pro
Van Minh Nguyen
5 (4)
FiboSniper Pro – Multi-Filter Fibonacci System with Auto SL/TP and Control Panel FiboSniper Pro는 동적 Fibonacci Envelopes와 여러 확인 필터를 결합하여 선별된 Buy 및 Sell 신호를 생성하는 기술적 지표입니다. Fibonacci 레벨은 Moving Average와 ATR을 기반으로 계산된 후 ADX, EMA, RSI, ATR, Volume, Time 및 Candle 구조를 통해 필터링됩니다. 이 지표는 ATR 기반의 자동 Stop Loss 및 Take Profit 레벨을 차트에 직접 표시하며, 빠른 설정 조정을 위한 인터랙티브 Control Panel을 제공합니다. 구매 후 MQL5 메시지로 저에게 연락하시면 Auto Trader X를 무료로 받으실 수 있으며, 이 지표의 거래 신호를 자동화하는 방법에 대한 안내도 제공됩니다. User Guide 및 Set Files: [Click here
Auto Optimized SpeedAngle 은 지속적인 워크포워드 최적화(Walk-Forward Optimization, WFO)를 통해 곡선 적합(curve-fitting)을 제거한 기관 수준의 모멘텀 벡터화 시스템입니다. 시장 체제가 바뀔 때 성능이 떨어지는 정적 입력에 의존하는 대신, 이 지표는 표본 외(Out-of-Sample, OOS) 검증을 사용하여 매개변수를 동적으로 재보정하며, 표시되는 신호가 과거의 우연이 아닌 진정한 통계적 우위를 나타내도록 보장합니다. 핵심 기관용 프레임워크 워크포워드 최적화 엔진: 핵심 알고리즘은 수천 가지의 룩백(lookback) 및 임계값 조합을 지속적으로 스캔하며, 데이터를 인샘플(in-sample)과 표본 외(out-of-sample) 세트로 엄격하게 분리합니다. 미지의 데이터 환경에서 수학적 우수성이 증명된 경우에만 새로운 매개변수 구성을 채택합니다. 정량적 목적 함수: 순수한 총이익을 쫓는 대신, 최적화 엔진은 기관 수준의 안정성
Adaptive Price Action Engine 지표를 구매하면 EA(자동매매 프로그램)가 무료 멀티 타임프레임 기반 자기 최적화 추세 & 캔들 패턴 분석 시스템 시장은 끊임없이 변화하며, 모든 Price Action 패턴이 모든 시장 환경에서 동일한 가치를 가지는 것은 아닙니다. Adaptive Price Action Engine 은 변화하는 시장 환경에 적응할 수 있도록 설계되었으며, 추세 구조, 멀티 타임프레임 분석, 캔들 패턴 및 통계적 최적화 를 하나의 분석 프레임워크로 결합합니다. 두 가지 적응형 모드 Dual Alpha Trend Mode 낮은 타임프레임과 높은 타임프레임에서 적합한 Alpha Trend 파라미터를 자동으로 탐색하여, 최근 시장 움직임에 맞춰 추세 분석을 조정합니다. Candlestick + Alpha Mode Alpha Trend를 통한 시장 국면 분석과 22개의 상승 및 하락 캔들 패턴 을 결합합니다. 모든 패턴을 동일하게 취급하는 대신, 다양
Crystal Heikin Ashi Signals
Muhammad Jawad Shabir
5 (5)
Crystal Heikin Ashi Signals—Professional Trend & Signal Detection Indicator Advanced Heikin Ashi Visualization with Intelligent Signal System for Manual & Automated Trading Final Price: $149 ---------> Price goes up $10 after every 10 sales . Limited slots available — act fast . Overview User Guide PDF Crystal Heikin Ashi Signals is a professional-grade MetaTrader 5 indicator that combines pure Heikin Ashi candle visualization with an advanced momentum-shift detection system. Designed for both m
Scalper Vault MT5
Oleg Rodin
5 (1)
Scalper Vault는 당일 매매(intraday trading)에서 일관된 성과를 내고자 하는 트레이더를 위해 설계된, 강력하고 모든 기능을 갖춘 트레이딩 시스템입니다. 이 고정밀 지표는 외환(Forex) 및 바이너리 옵션 트레이더 모두에게 기관급 분석을 제공하는 독립적인 종합 트레이딩 시스템 역할을 합니다. 구매 후 저에게 연락해 주시면, 트레이딩 팁과 함께 특별한 보너스를 제공해 드립니다! Scalper Vault는 추측에 의존하거나 복잡한 수동 분석을 할 필요를 없애주며, 사용하기 쉬운 트레이딩 기법을 통해 오직 매매 실행에만 집중할 수 있도록 돕습니다. 정확한 추세 추종 신호: 핵심 알고리즘이 시장 구조를 분석하여, 지배적인 시장 추세 방향과 일치하는 고확률 신호만을 제공함으로써 잘못된 진입을 획기적으로 줄여줍니다. 정밀한 고점 및 저점 탐지: 시장의 움직임이 소진되는 지점을 스캔하여 잠재적인 반전 구간을 식별합니다. 간(Gann) 이론 기반의 매수/매도 구간: 수학적
Trend Catcher ind mt5
Ramil Minniakhmetov
5 (18)
트렌드 캐처 인디케이터 트렌드 캐처 인디케이터는 개발자가 자체 개발한 맞춤형 적응형 트렌드 분석 지표들을 조합하여 시장 가격 움직임을 분석합니다. 단기적인 노이즈를 제거하고 근본적인 모멘텀 강도, 변동성 확대, 가격 구조 움직임에 집중하여 진정한 시장 방향을 파악합니다. 또한 이동 평균, RSI, 변동성 필터와 같은 맞춤형 지표들을 활용하여 가격을 평활화하고 트렌드를 필터링합니다. 실제 운영 모니터링 및 기타 제품은 다음 링크에서 확인하실 수 있습니다:   https://www.mql5.com/en/users/mechanic/seller 텔레그램에서는 EA나 설정 파일을 판매하지 않습니다. 사기이니 주의하세요. 모든 설정 파일은 블로그에서 무료로 제공됩니다. 중요! 구매 후 즉시 연락 주시면 사용 방법 및 보너스를 드립니다!
Atomic Analyst MT5
Issam Kassas
4.5 (64)
Atomic Analyst — MetaTrader 5 구매 후 MQL5에서 저에게 메시지를 보내시면 Smart Universal Expert Advisor를 무료로 받으실 수 있으며, 온라인 강좌, PDF 매뉴얼 및 비공개 그룹 이용 권한도 함께 제공됩니다. Atomic Analyst는 가격 움직임 분석, 추세 방향, 진입·청산 신호, 손절 수준, 여러 익절 수준을 차트에 모아 보여줍니다. 신호를 확인하고 매매 상황을 이해하세요 Atomic Analyst는 분석 결과를 명확한 시각 정보로 정리합니다. • 잠재적인 진입 기회를 확인할 수 있는 매수·매도 화살표. • 거래 계획에 도움이 되는 손절 수준과 여러 익절 수준. • 시장 방향을 평가할 수 있는 추세, 강도, 모멘텀 수치. • 더 넓은 시장 맥락을 비교할 수 있는 여러 시간대 분석. • 변화하는 시장 상황을 따라갈 수 있는 색상별 캔들과 알림. 신호와 보조 분석을 함께 검토한 다음, 해당 매매 상황이 자신의 거래 규칙에
Unix Scalper
Issam Kassas
4 (4)
Unix Scalper — MetaTrader 5 구매 후 MQL5에서 저에게 메시지를 보내시면 Smart Universal Expert Advisor를 무료로 받으실 수 있으며, 온라인 강좌, PDF 매뉴얼 및 비공개 그룹 이용 권한도 함께 제공됩니다. 매매 기회를 찾고, 거래 계획을 확인하고, 실행 방법을 선택하세요. UNIX Scalper는 시장 분석, BUY/SELL/WAIT 판단, Entry, Stop Loss, TP1 및 TP2 가격 수준을 하나의 정돈된 패널에 제공합니다. 신호와 거래 계획을 한눈에 • 명확한 판단: BUY, SELL 또는 WAIT. • 구체적인 가격 수준: Entry, Stop Loss, TP1 및 TP2. • 다중 시간대 개요: 패널의 여러 시간대 신호를 비교하세요. • 판단을 돕는 분석: 추세, 모멘텀, 거래량, 변동성, 지지와 저항, 시장 품질. • 다양한 레이아웃: Minimized, Compact, Standard 또는 Full. 신호와
SIO Oscillator
Davit Beridze
SIO Oscillator: 자기 최적화 세미분산 불균형 오실레이터 지표를 구매하시면 이를 기반으로 한 전문가 어드바이저(EA)를 무료로 받으실 수 있습니다. 대부분의 오실레이터는 모든 가격 움직임을 똑같이 취급합니다. SIO는 상승 압력과 하락 압력을 분리하여 둘 사이의 불균형을 측정하고, 매수자와 매도자 중 어느 쪽이 실제로 시장을 주도하고 있는지 보여줍니다. 불균형이 극단에 도달하면 SIO는 진입가, 손절(Stop Loss), 익절(Take Profit) 수준이 포함된 명확한 신호를 표시합니다. SIO의 차별점은 고정된 설정에 의존하지 않는다는 것입니다. 내장된 자기 최적화 엔진이 현재 종목과 시간 프레임에 맞는 파라미터를 지속적으로 탐색하고, 사용하기 전에 검증합니다. 두 가지 신호 모드 평균 회귀(Mean Reversion): 불균형의 극단에서 거래하며 균형으로의 복귀를 노립니다. 추세 추종(Trend Following): 지속적이고 우세한 불균형의 방향으로 거래합니다. 자
Volatility Master for MetaTrader is a real-time dashboard tool that scans up to  50 symbols  to identify high-volatility , trending markets instantly. With bullish/bearish signals, customizable alerts, and a user-friendly interface, it helps you avoid range-bound conditions and focus on high-probability trades. Clarity leads to confidence. Trade confidently and protect your capital effectively with this powerful dashboard. We don't offer free or bonus indicators in exchange of reviews from you.
Smc Pro ToolKit
Talal N Z Aljarusha
5 (14)
SMC PRO TOOLKIT — SMART MONEY ANALYSIS & STRUCTURED TRADE PLANNING SMC Pro ToolKit is a professional Smart Money Concepts analysis workspace for MetaTrader 5. It combines market structure, multi-timeframe analysis, institutional price zones, setup evaluation, confirmation tools, volume context, alerts, and risk planning inside one organized chart environment. One workspace. Multiple layers of confirmation. One structured trading plan. OPEN COMPLETE USER GUIDE MULTI-CONDITION SETUP ENGINE At
Dynamic Forex28 Navigator MT5
Bernhard Schweigert
5 (1)
다중 통화 강도 및 모멘텀 지표 MT5 Dynamic Forex28 Navigator는 오랫동안 사랑받아 온 저희 지표의 진화 버전으로, 세 가지 기능을 하나로 결합했습니다: Advanced Currency Strength28 Indicator (리뷰 700개) Advanced Currency IMPULSE with ALERT (리뷰 530개) CS28 Combo Signals (최근 보너스) 두 이전 지표는 MQL5 Market에서 합계 1,200개가 넘는 리뷰를 받았으며 2016년부터 MT4 커뮤니티의 필수품이었습니다. Dynamic Forex28 Navigator MT5는 검증된 동일한 로직을 그대로 이어갑니다. MetaTrader 5를 위해 완전히 다시 제작 – MT5의 네이티브 다중 심볼 아키텍처를 최대한 활용하도록 설계되었습니다. 사용 설명서: https://www.mql5.com/en/blogs/post/758844 MT4 버전을 찾고 계신가요? 여기를 클릭하세요: ht
AriFocus
Temirlan Kdyrkhan
AriFocus - Non-Repainting Buy/Sell Signals AriFocus - one clear signal. AriFocus marks buy and sell signals directly on the chart and suggests a stop-loss level for each one. Every signal is confirmed on bar close and never repaints. - Buy/sell arrows, confirmed on bar close - Suggested stop-loss level for every signal - Trend band and candle coloring to show direction at a glance - 10 ready-made presets, or your own settings (14 calculation methods) - Pop-up, push and email alerts with entr
Neuro Poseidon MT5
Daria Rezueva
4.68 (53)
Neuro Poseidon is a new indicator by Daria Rezueva. It combines precise trading signals with adaptive TP/SL levels - creating best possible trades as a result! Message me and get  Neuro Poseidon Assistant  as a gift to automize your trading process! What makes it stand out? 1. Proven profitability on all assets and timeframes 2. Only confirmed BUY and SELL signals present on the chart 3. Adaptive TP & SL levels generated by the software for each trade 4. Easy to understand - suitable for al
PZ Swing Trading MT5
PZ TRADING SLU
5 (5)
Protect against whipsaws: revolutionize your swing trading approach Swing Trading is the first indicator designed to detect swings in the direction of the trend and possible reversal swings. It uses the baseline swing trading approach, widely described in trading literature. The indicator studies several price and time vectors to track the aggregate trend direction and detects situations in which the market is oversold or overbought and ready to correct. [ Installation Guide | Update Guide | Tro
제작자의 제품 더 보기
WatchCat RR
Daping Wang
WatchCat RR Basic — free visual Long/Short position (RR) planner for MetaTrader. • Drag entry, take-profit, stop-loss, and box width • Corner handles + double-click (or press L) to flip Long/Short • Risk-% lot size from Balance or Equity • Mid label: Price, RR, Lots • Auto-fits TP/SL height and box width to the chart on attach / timeframe change • Always visible while the indicator is attached (no show/hide button) • SL/TP labels show price only (no account-currency money amounts) • Entry snaps
FREE
Classic MACD with a four-color histogram, MACD line and Signal line. Filled histogram columns with no gaps. Visual only — no arrows, no alerts, never trades. Features: • Classic MACD: EMA12 − EMA26, Signal EMA9 (SMA option for oscillator/signal) • Four-color histogram: grow/fall above and below zero • Blue MACD line + orange Signal line • Filled histogram columns with no visual gaps (session holes stay filled) • Near-zero histogram still paints a thin column • Separate window with zero level; a
FREE
WatchCat RR Basic — free visual Long/Short position (RR) planner for MetaTrader. • Drag entry, take-profit, stop-loss, and box width • Corner handles + double-click (or press L) to flip Long/Short • Risk-% lot size from Balance or Equity • Mid label: Price, RR, Lots • Auto-fits TP/SL height and box width to the chart on attach / timeframe change • Always visible while the indicator is attached (no show/hide button) • SL/TP labels show price only (no account-currency money amounts) • Entry snaps
FREE
Classic MACD with a four-color histogram, MACD line and Signal line. Filled histogram columns with no gaps. Visual only — no arrows, no alerts, never trades. Features: • Classic MACD: EMA12 − EMA26, Signal EMA9 (SMA option for oscillator/signal) • Four-color histogram: grow/fall above and below zero • Blue MACD line + orange Signal line • Filled histogram columns with no visual gaps (session holes stay filled) • Near-zero histogram still paints a thin column • Separate window with zero level; a
FREE
A Chart-style Long/Short Position tool for MT4. Drag entry, take profit and stop loss directly on the chart, see the risk/reward ratio and the lot size calculated from your risk % instantly. Green TP zone, red SL zone, clean English labels, and a round on-chart button to show or hide the tool. Purely visual - it never opens, modifies or closes orders. Plan trades on MetaTrader 4 visually, directly on the chart. Place the box, drag the levels, and read the price, RR and position size at a glance.
WatchCat TV MACD is a visual MetaTrader 4 oscillator based on classic MACD math. It shows a four-color histogram with tight gutters, a blue MACD line, an orange Signal line, and a blinking bead on the latest near-zero golden or death cross. The histogram uses canvas drawing so columns stay compact and easy to read. Default calculation is EMA 12 minus EMA 26, with a Signal line of EMA 9. A simple moving average option is also available for the oscillator and the Signal line if you prefer that sty
A Chart-style Long/Short Position tool for MT5. Drag entry, take profit and stop loss directly on the chart, see the risk/reward ratio and the lot size calculated from your risk % instantly. Green TP zone, red SL zone, clean English labels, and a round on-chart button to show or hide the tool. Purely visual - it never opens, modifies or closes orders. Plan trades on MetaTrader 5 visually, directly on the chart. Place the box, drag the levels, and read the price, RR and position size at a glance.
필터:
리뷰 없음
리뷰 답변