WZY Whale Fall Structure Map5

WZY Whale Fall Structure Lines for MetaTrader 4

A clearer way to read the chart.

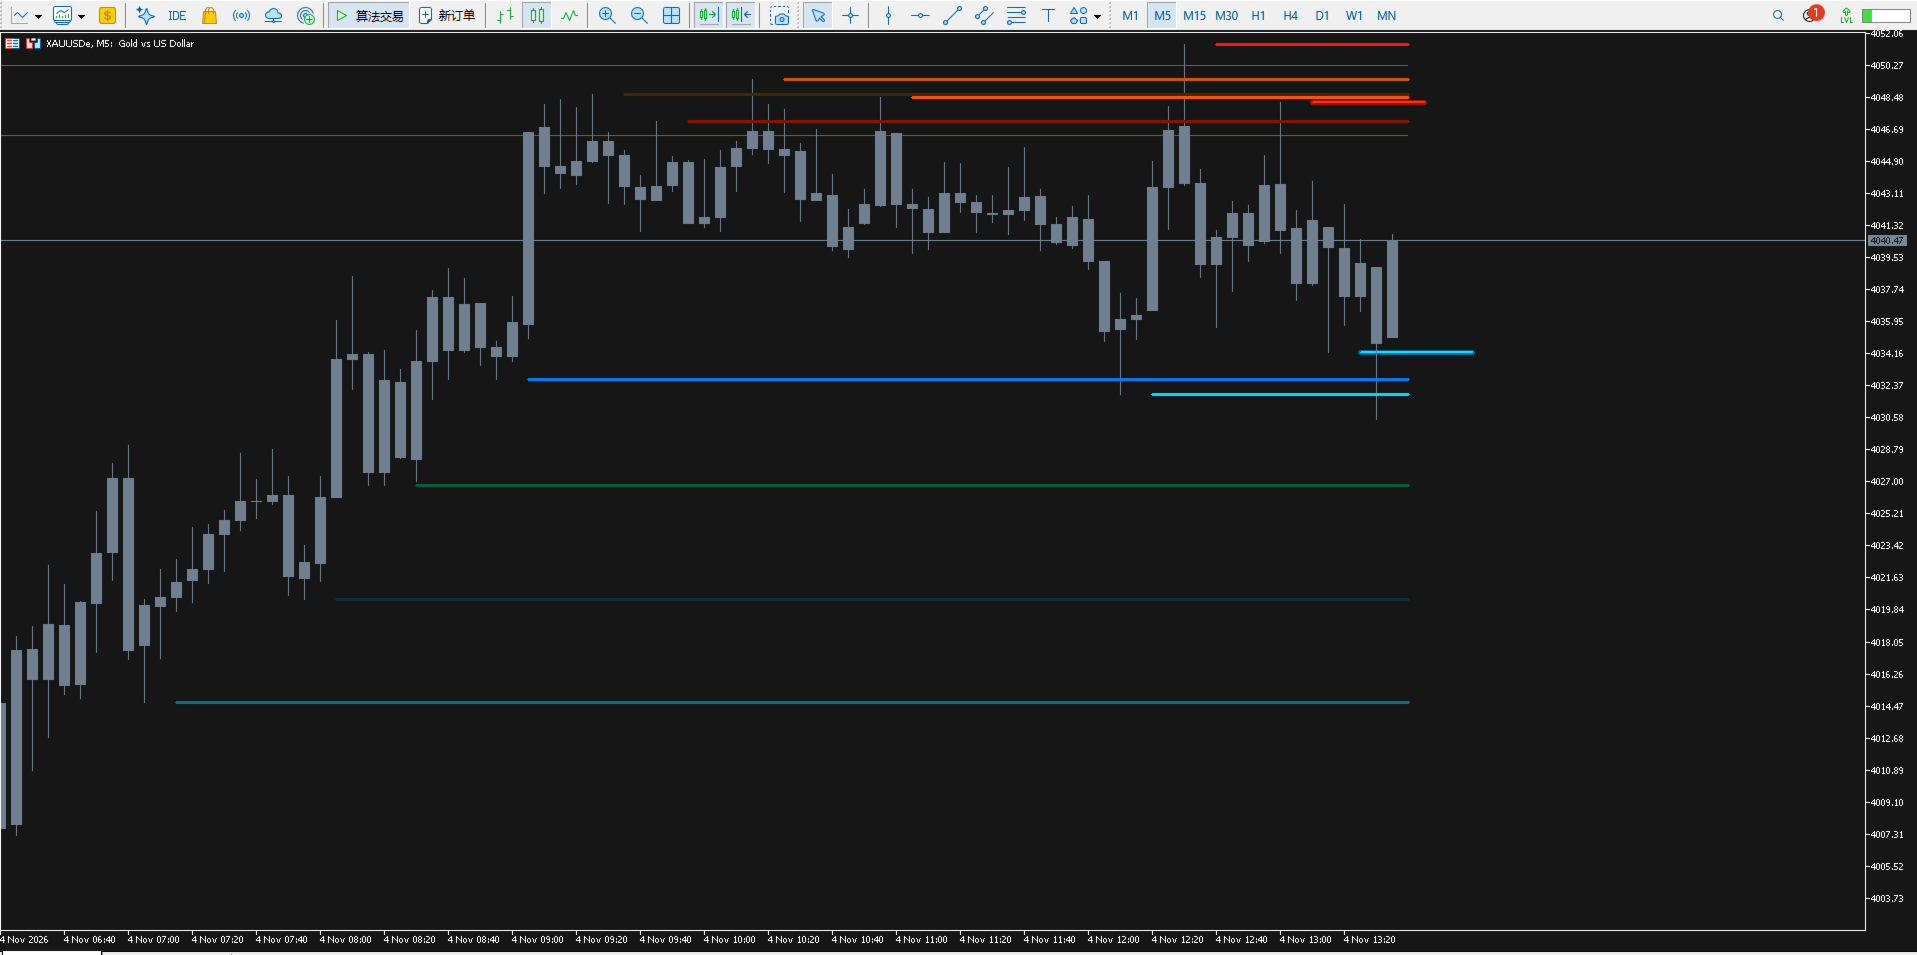
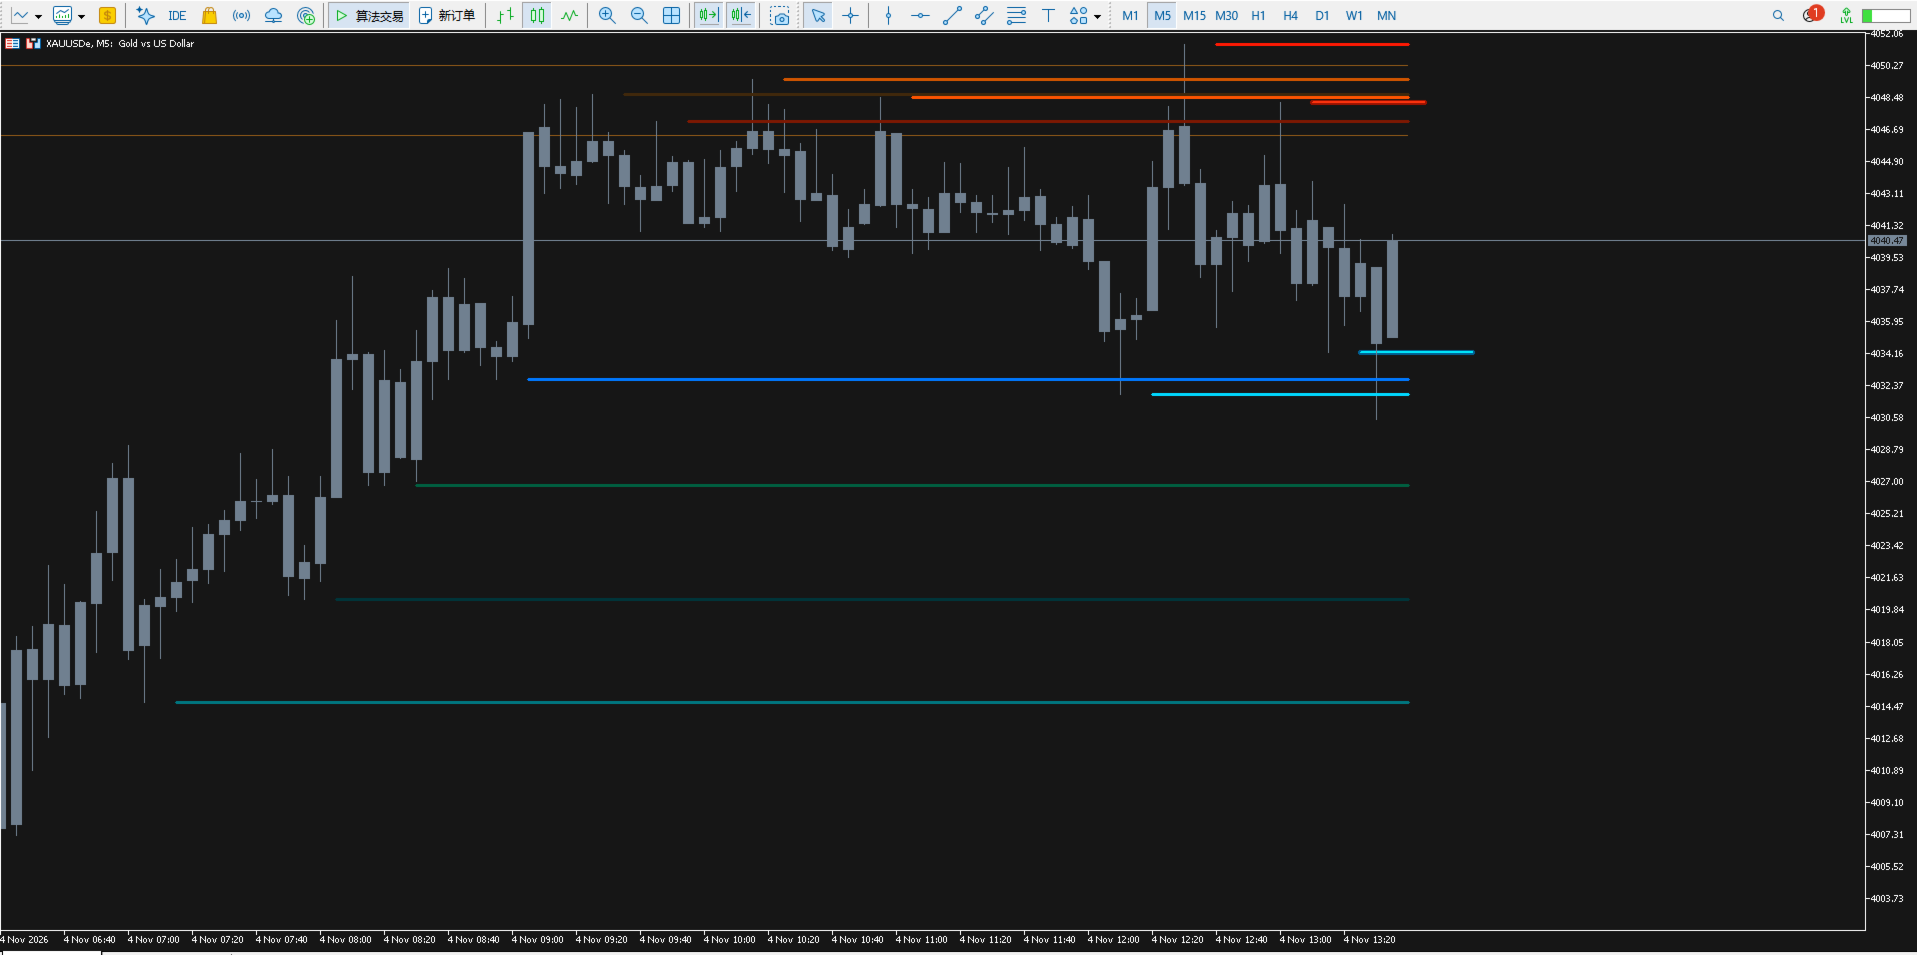
WZY Whale Fall Structure Lines is a visual market-structure companion for traders who want important price areas to stay visible without covering the chart with manual drawings or extra indicator panels. It brings a calm, organized layer of support and resistance context to the main chart, so you can spend more time reading price and less time maintaining annotations.

When the market moves quickly, attention becomes limited. WZY keeps the structure that matters in view. Recent areas stand out with vivid color gradients, established areas remain available as background context, and the overall chart stays clean enough for everyday analysis.

WHAT YOU GET

- A cleaner main-chart workspace: keep price, candles and structure in one focused view.
- Faster visual context: recognize where the market has reacted without scanning a crowded chart.
- Clear priority: newer active areas are easier to separate from older reference areas.
- A presentation that fits your style: use the built-in color moods or tune the look to your workspace.
- A companion for different workflows: use it with price action, swing analysis, breakout planning, trend review or multi-timeframe study.
- Less manual chart maintenance: keep your attention on the market instead of repeatedly drawing and updating levels.

MADE FOR TRADERS WHO

- prefer a visual chart over a dashboard full of separate signals;
- want support and resistance context to remain visible during active sessions;
- compare several symbols or timeframes and need a consistent chart language;
- use their own entry, exit and risk-management process.

HOW IT FITS YOUR WORKFLOW

Attach WZY to a price chart and let the structure map become part of your normal workspace. Use the visual hierarchy to frame the current market, compare fresh areas with established context, and then make decisions with your own analysis and risk rules.

PRODUCT POSITIONING

WZY is a chart-reading tool. It does not place trades, send orders or promise profitable results. It is designed to support independent analysis and to make the chart easier to read.
추천 제품
ApexForge MA Trend Strength Professional is the flagship edition of the ApexForge product line, delivering the most complete feature set for traders who demand professional-grade market analysis. Built for serious traders, it combines powerful trend evaluation with extensive customization, providing a flexible solution for scalping, intraday trading, swing trading, and multi-timeframe analysis. The indicator automatically evaluates moving average slopes and converts them into five intuitive tren
HTF Open Markers + ICT Silver Bullet Zones — Usage & Strategy Guide What it draws Session 1 / Session 2 lines : vertical lines at the open of every bar on two independently configurable higher timeframes (defaults: H4 and D1), including a projected line for the rest of today's not-yet-opened bars on sub-daily timeframes, so you can see where the next candle will open before it happens. ICT Silver Bullet zones : shaded rectangles over the three classic ICT kill-zone windows, converted from New Yo
FREE
ICT Institutional Zones Pro
Celestine Anyango Wabomba
ICT Institutional Zones Pro — Trade with Institutional Precision Stop wasting time manually drawing key ICT levels every day. ICT Institutional Zones Pro is a professional-grade MT5 indicator built for traders who use ICT (Inner Circle Trader) and Smart Money Concepts (SMC) to read market structure with precision. This indicator automatically maps the most important institutional levels directly on your chart, helping you instantly identify where smart money is likely accumulating, distributing
MQL5 블로그 = https://www.mql5.com/en/blogs/post/774983 MT4 버전 = https://www.mql5.com/en/market/product/193085 MT5 버전 = https://www.mql5.com/en/market/product/193086 KELTNER LIQUIDITY [tambangEA]는 켈트너 채널(Keltner Channel)의 추세 프레임워크와 매수 측 유동성(BSL), 매도 측 유동성(SSL), 그리고 확정된 유동성 스윕(liquidity sweep) 신호를 결합한 전문적인 시장 구조 및 유동성 분석 지표입니다. 이 지표는 가격이 스윙 고점(swing high) 위나 스윙 저점(swing low) 아래의 유동성을 확보한 후 잠재적인 반등이나 반전이 발생할 수 있는 구간을 트레이더가 파악할 수 있도록 설계되었습니다. 단일 오실레이터에서 신호를 생성하는 대신, KELTNER LIQUIDITY는 켈트너 채널, 확정된
이 다중 시간 프레임 및 다중 기호 표시기는 핀 막대, 아침/저녁 별, 인글핑, 핀셋, 쓰리 라인 스트라이크, 내부 막대 및 페넌트 및 삼각형을 스캔합니다.   지표는 단일 차트 모드에서도 사용할 수 있습니다. 이 옵션에 대한 자세한 내용은 제품의       블로그   .       고유한 규칙 및 기술과 결합하여 이 표시기를 사용하면 자신만의 강력한 시스템을 생성(또는 강화)할 수 있습니다. 특징 Market Watch 창에 표시되는 모든 기호를 동시에 모니터링할 수 있습니다. 하나의 차트에만 지표를 적용하고 전체 시장을 즉시 모니터링하십시오. M1에서 MN까지 모든 시간대를 모니터링하고 패턴이 식별되면 실시간 경고(팝업, 푸시 또는 메일)를 보냅니다. RSI 및 볼린저 밴드를 핀 바, 아침/저녁 별   , 인글프잉 및 핀셋 형성   에 대한 필터로 사용하여 잠재적 반전을 적절하게 식별할 수 있습니다. 이동 평균을 주요 추세 필터로 사용하고 ADX를 변동성 필터로 사용할 수 있습니
Adaptive Trend Projection is a MetaTrader 5 indicator designed to help traders visualize the possible continuation of the current market structure. The indicator analyzes recent price behavior using two weighted regression windows: a longer lookback to understand the broader direction and a shorter lookback to capture the most recent movement. It then combines trend slope, recent acceleration, volatility, and ATR-based limits to draw a forward projection for the next candles. The central project
Dynamic Trend Moving Average for MT5 Dynamic Trend Moving Average is an intelligent moving average indicator designed to help traders instantly identify the current market trend through a simple and intuitive color-coding system. Unlike traditional moving averages, this indicator automatically changes color according to market conditions: Green – Bullish trend detected Red – Bearish trend detected Yellow – Neutral market or transition phase This visual approach allows traders to quickly
MQL5 블로그: https://www.mql5.com/en/blogs/post/768823 MT4 버전: https://www.mql5.com/en/market/product/171247 MT5 버전: https://www.mql5.com/en/market/product/171248 FIBONACCI PROJECTION [tambangEA]는 시장 구조, 피보나치 투영 목표, 거래량 반응 영역, 추세 지속 영역을 차트에서 직접 파악할 수 있도록 설계된 전문 대시보드 기반 트레이딩 분석 도구입니다. 이 도구는 최신 스윙 구조를 자동으로 감지하고, 피보나치 기반 투영 레벨을 생성하며, POC(Point of Control) 영역을 강조 표시하고, 피보나치 밴드 전반에 걸쳐 델타 정보를 표시합니다. 모든 피보나치 투영을 수동으로 그리지 않고도 시장 움직임을 깔끔하고 체계적이며 시각적인 방식으로 분석하고자 하는 트레이더를 위해 설계되었습니다. 이 도구가 개발된 이유 많은 트레이더들
MQL5 블로그: https://www.mql5.com/en/blogs/post/770443 MT4 버전: https://www.mql5.com/en/market/product/157434 MT5 버전: https://www.mql5.com/en/market/product/178388 RANGE LADDER [tambangEA]는 차트 범위 내 시장 활동을 보다 명확하게 파악하고자 하는 트레이더를 위해 개발된 전문적인 시각 분석 지표입니다. 이 지표는 틱 볼륨 활동이 가격대별로 어떻게 분포되어 있는지 보여주는 프리미엄 레인지 래더 대시보드를 생성합니다. 시장 활동을 다음과 같은 네 가지 범주로 구분합니다. 매수 진입 매도 이탈 매도 진입 매수 이탈 이러한 구조는 트레이더가 특정 가격대가 새로운 매수 활동, 숏 커버링, 새로운 매도 압력 또는 매수 이탈 활동에 의해 지지되고 있는지 이해하는 데 도움을 줍니다. 이 지표는 깔끔한 다크 럭셔리 대시보드, TradingView 스타일의
All in One Multi Indicator
Teerathad Booranawisedkul
Overview Comprehensive technical analysis indicator combining 20+ essential trading tools in a single chart display. Moving Averages EMA (Exponential Moving Average): 9, 21, 50, 200 periods SMA (Simple Moving Average): configurable period Customizable colors and line widths Price position indicators (above/below) Oscillators & Momentum RSI (Relative Strength Index): adjustable overbought/oversold levels MACD (Moving Average Convergence Divergence): customizable fast/slow/signal periods Stochasti
ProfileScope MT5 차트에서 직접 선택한 두 영역의 거래량 분포를 비교하세요. ProfileScope MT5는 선택 영역의 거래량 프로파일, A/B 수치 비교, 프로파일 가격 수준과의 접촉 또는 통과가 확인되었을 때의 알림을 제공합니다. 분석할 영역 선택 Select A 를 선택한 다음 차트에서 드래그하고 마우스 버튼을 놓아 A를 만드세요. 같은 방법으로 Select B 를 사용해 다른 기간과 비교할 수 있습니다. 선택한 캔들의 전체 가격 범위를 사용하려면 Time range 를, 지정한 가격 구간의 추정 거래량만 남기려면 Time + price 를 사용하세요. 경계를 드래그하거나 패널에 정확한 분 단위 시각과 가격을 입력할 수 있습니다. 영역은 직접 수정할 때까지 고정됩니다. 각 프로파일에는 히스토그램, 최대 거래량 가격대인 Point of Control( POC ), 가치 영역 경계( VAH / VAL )가 표시됩니다. 가치 영역이 실제로 포함하는 비율, 유지된 거래량
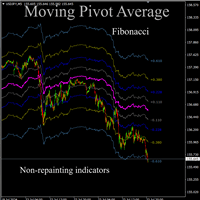
Moving pivot Average Fibonacci The  indicator compares the selected period with its counterpart from the previous period. The indicator determines the moving Fibonacci levels for the day or any time interval to assess the price movement range from the time average. The indicator helps predict the expected high or low for the day based on historical time data. The pivot line can be considered an average trend line and use it in a variety of trading strategies. If you have any question about the
Utilities
Douglas Lucio De Araujo
Indicator with 3 features - Clock : Clock independent of the chart, counting continues even when the market is closed. - Template : After setting up a configuration in any graphic, be it color patterns, indicators, zoom ... The configuration will be copied to all active graphics. - TimeFrame : Set the TimeFrame on a chart, and with just one click all the active charts will be changed to the same TimeFrame.
ENGLISH VERSION (for MQL5 Market) Product Description: RSI Trend & Volatility Dashboard (Multi-Timeframe Filter) This professional dashboard provides traders with an ultimate market overview inside a single chart. It continuously monitors the trend direction across 5 timeframes simultaneously: M5, M15, M30, H1, and D1 [MQL5]. No more tedious chart switching or multi-window clutter – see everything from quick scalping moves to global institutional daily trends in real-time [MQL5]. Key Adva
Santa Trend
Marco Aurelio Cestari
4.4 (5)
Santa Trend Indicator  is an efficient way to forecast and detect the trend in any market. Advantages Generates instant buy and sell signals. Provides an alternate exit strategy to your existing trading system. Never repaints, never backpaints, never recalculates. Works in all symbols and all timeframes. Perfect trend filter for any strategy or expert advisor. Fully compatible with Expert Advisor (EA) development. Does not lag.
FREE
Trend dashboard MT5
Jan Flodin
5 (1)
I recommend you to read the   product's blog  (manual) from start to end so that it is clear from the beginning what the indicactor offers. This multi time frame and multi symbol trend indicator sends an alert when a strong trend or trend reversal has been identified. It can do so by selecting to build up the dashboard using Moving average (single or double (both MA:s aligned and price above/below both)), RSI, Bollinger bands, ADX, Composite index (Constance M. Brown), Awesome (Bill Williams), 
Adaptive Math Zones Indicator is a professional MT5 indicator designed to identify high-probability price reaction areas using mathematical price projections and Fibonacci-based channel structures. The indicator automatically builds a reference price channel, highlights neutral zones, and projects future price levels (50%, 100%, and 200%), helping traders visually understand market structure and potential reaction points. This tool is especially effective during ranging and corrective market con
MQL5 블로그: https://www.mql5.com/en/blogs/post/772035 MT4 버전: https://www.mql5.com/en/market/product/183506 MT5 버전: https://www.mql5.com/en/market/product/183507 LIQUIDITY MAGNET [tambangEA]은 트레이더가 고품질 유동성 영역을 식별하고, 영역의 강도를 모니터링하며, 반대되는 시장 영역 간의 잠재적인 방향성 "자석"을 파악하는 데 도움을 주기 위해 설계된 전문적인 수요 및 공급 시각화 지표입니다. 이 지표는 중요한 일중 수요 및 공급 영역을 차트에 직접 표시하고, 반응 품질에 따라 각 영역에 점수를 매기며, 영역 상태, 가격 범위, 점수, 최신성, 무효화 상태 및 활성 자석 끌어당김 방향을 보여주는 깔끔한 대시보드를 제공합니다. 이 도구는 수동 의사 결정 지원을 위해 설계되었습니다. 거래를 자동으로 시작, 종료 또는 관리하지 않습니다.
Clear BUY and SELL arrows that come with a ready-made Stop Loss, three Take Profit levels and a suggested lot size. How it works A signal needs four conditions on the same closed candle. Price must be on the trend side of the EMA 50 and the EMA must slope in that direction. RSI 14 must have crossed the 50 line within the last few bars. The candle must close beyond the high (for buys) or the low (for sells) of the previous candle. ATR 14 must be above a set share of its own average, so quiet and
FREE
Emotions are a weakness. QHO mathematics is the future of your trading! You know what really truly frustrating?  Information garbage and noise. All those legacy, lagging indicators on the charts look like an attempt to steer a rocket ship with a steam engine. They are useless. They look at the past while the market is already flying forward on next-gen tech. We created QHO. This is not just another indicator. This is pure mathematics crushing market chaos right on your chart. Imagine completely
I recommend you to read the   product's blog  (manual) from start to end so that it is clear from the beginning what the indicactor offers. This multi time frame and multi symbol divergence dashboard indicator sends an alert when one or two different divergences have been identified. It can be used with all time frames from M1 to MN. Maximum 9 time frames can be shown in the dashboard at the same time. It is possible to enable moving average, RSI or Bollinger bands trend filter to filter out on
Dynamic SR Levels Pro
Vinutthapon Bumroong
Title: Dynamic SR Levels Pro Short Description: A next-generation, multi-timeframe Support & Resistance indicator that automatically detects, adapts, and invalidates key price zones based on real-time market volatility. Stop guessing, start seeing. Full Description: Tired of manually drawing support and resistance lines that quickly become outdated? Dynamic SR Levels Pro is the ultimate solution for traders who demand precision, adaptability, and a clean, clutter-free chart. This is not just ano
Professional VWAP Trading System with Advanced Signal Detection Transform your trading with the most comprehensive VWAP indicator available for MetaTrader 5. Magic VWAP Key Levels Pro combines multiple timeframe analysis, intelligent signal detection, and professional-grade visualization to give you the edge in modern markets. CORE FEATURES: Multi-Timeframe VWAP Analysis Session, Weekly, and Monthly VWAP calculations Previous 10-day VWAP support/resistance Dynamic anchor periods (Session/Week/Mo
UTS Trading Stat
Dawid Aaron Zinserling
The UTS Trading Stat indicator, developed by Ultron Trading Solutions, is a customizable tool designed to track and display trading statistics for the current chart's symbol. It presents a visual dashboard on the chart, offering real-time insights into trading performance with a toggleable panel (STAT SHOW/STAT HIDE) for user convenience. Below is a detailed description of its features and functionality: Trading Statistics Displayed : Current Positions : Number of open profit/loss trades and tot
SMC Fibonacci OTE
Tshivhidzo Moss Mbedzi
SMC Fibonacci OTE for MetaTrader 5 Automated chart analysis for traders who use market structure and Fibonacci retracements. This indicator draws analytical levels and alerts; it does not place or manage orders. SMC Fibonacci OTE is a technical indicator for MetaTrader 5 designed for traders following Smart Money Concepts (SMC) . It automates the detection of market structure shifts and maps the Optimal Trade Entry (OTE) zone, providing you with clear entry, stop loss, and multiple take-profit l
Chart Wizard
Jeannot Desire Ofori
5 (1)
이 올인원 지표는 실시간 시장 구조(내부 및 스윙 BOS / CHoCH), 오더 블록, 프리미엄 및 디스카운트 구역, 동일 고점 및 저점 등을 표시하여 트레이더가 널리 사용되는 프라이스 액션 방법론을 차트에 자동으로 표시할 수 있게 해줍니다. Fair Value Gap 스크립트 출시 후 커뮤니티로부터 동일 카테고리의 더 많은 기능을 출시해달라는 요청을 많이 받았습니다. "스마트 머니 컨셉(SMC)"은 프라이스 액션 트레이더 사이에서 비교적 새롭지만 널리 사용되는 용어로, 유동성을 더 정확하게 파악하고 시장에서 더 최적의 관심 지점을 찾는 데 활용됩니다. 기관 시장 참여자들이 주문을 배치한 위치(매수 또는 매도 측 유동성)를 파악하려는 시도는 프라이스 액션을 기반으로 더 실용적인 진입 및 청산 지점을 찾는 매우 합리적인 접근 방식입니다. 이 지표에는 스윙 구조 존재 여부 및 다른 관련 조건에 대한 알림 기능이 포함되어 있습니다. 기능 이 지표에는 SMC와 관련된 많은 기능이
FREE
Mtf Rsi Fusion
Hadi Pourkerman
5 (1)
MTF RSI Fusion은 기본 상대강도지수(RSI)에 최대 2개의 선택적 RSI 소스를 결합하는 MetaTrader 5 오실레이터입니다. 각 소스의 시간대, 계산 기간과 적용 가격을 설정하며 추가 소스에는 개별 가중치와 결합 모드가 있습니다. Fusion RSI 선, 선택적 추세 색상, 평균진폭(ATR) 기반의 적응형 과매수 및 과매도 구간을 표시합니다. 추세 방향은 상위 시간대 캔들, 이동평균 기울기 또는 두 방법으로 판단합니다. 상승 및 하락 다이버전스와 신호 표시는 지표 창과 메인 차트에 나타낼 수 있습니다. 신호 모드는 Pivot Bounce, OB/OS Cross, Both, Trend Pullback입니다. 각각 확인된 피벗, 구간 이탈, 두 조건의 결합, 추세 방향으로 제한된 신호를 사용합니다. 신호는 지표 조건을 나타내며 거래 수익을 의미하지 않습니다. 선택적 거래량 가중 평균 가격(VWAP) 오실레이터는 정규화된 거리를 0부터 100까지 표시합니다. VWAP 필터
KT Auto Fibo MT5
KEENBASE SOFTWARE SOLUTIONS
5 (1)
Auto Fibonacci indicator that draws the Fibonacci retracement on the swing you are looking at, and redraws it the moment you zoom or scroll the chart. Zoom in on a pullback and the levels measure that pullback. Zoom out and they measure the whole trend. There are no anchor points to drag and no levels to redraw after every new high. Key features Measures the highest high and the lowest low on your screen, the current candle included. Follows zoom, scroll and window size at once, even when the ma
Trending or Ranging Dashboard See Every Timeframe's Market Condition at a Glance Stop guessing whether you should be trading breakouts or reversals. The Trending or Ranging Dashboard instantly shows you the market state across all major timeframes - from M1 to Monthly - in one compact, color-coded panel. What Makes This Different Most traders struggle because they use trending strategies in ranging markets, or range-bound strategies when the market is trending. This indicator solves that proble
Fusion Harmonic Intelligence
Juan Antonio Alvarenga Galindo
Fusion Harmonic Intelligence 는 MetaTrader 5 플랫폼에서 작동하도록 설계되었습니다. 이 도구는 하모닉 패턴 분석과 RSI 및 이동 평균과 같은 전통적인 기술 지표를 결합하여 시장에서 정밀한 진입 시점을 식별합니다. 이 소프트웨어는 상당한 손실에 대비한 비상 계획, 통합 뉴스 필터, 자본 보호를 위한 공격적인 헤징 시스템을 포함한 강력한 리스크 관리가 특징입니다. 또한, 동적 트레일링 스톱 엔진과 스마트 그리드(Smart Grid) 전략 활성화 가능성을 통해 운영의 유연성을 제공합니다. 이 프로그램의 주요 목적은 엄격한 보안 파라미터 하에서 드로우다운(Drawdown)을 통제하면서 수익성을 극대화하는 것입니다. 트레이딩에서의 하모닉 패턴 감지 시스템 시스템은 세 가지 특정 유형의 하모닉 패턴을 감지하도록 프로그래밍되어 있습니다: 1. 가틀리(Gartley) 패턴: XABCD 구조 평가를 통해 감지됩니다. 시스템은 B지점이 XA를 기준으로 약 0.61
이 제품의 구매자들이 또한 구매함
Trend Sniper X
Sarvarbek Abduvoxobov
4.86 (43)
Trend Sniper X 는 트레이더가 추세 방향과 잠재적 반전 지점을 명확하고 정확하게 포착할 수 있도록 도와주는 MetaTrader 5용 멀티 타임프레임 추세 추종 지표입니다. MT4용: https://www.mql5.com/en/market/product/193245 가격 정보: 현재 가격은 프로모션 할인가이며, 향후 업데이트 및 새로운 기능이 출시됨에 따라 변동될 수 있습니다. 보너스 혜택: 본 지표 전용 무료 자동매매 Assistant EA를 받으시려면 구매 후 작성자에게 메시지를 보내주시기 바랍니다. Code2Profit 채널 멀티 타임프레임 분석으로 시장을 마스터하세요! Trend Sniper X로 승률을 극대화하는 방법: 핵심 규칙 및 세션 팁 기술 사양 플랫폼 MetaTrader 5 지표 유형 멀티 타임프레임 추세 지표 운용 타임프레임 모든 차트 타임프레임 지원, 독립적으로 선택 가능한 상위 타임프레임(M1–MN1) 주요 상품 외환, 금(XAUUSD) 및 기타 C
새로운 왕의 등장 - 인디케이터 + 주문 관리 표시(TP1 + TP2 + TP3) + 선택형 텔레그램 시그널 전송 기능 포함 (무료) (완전한 트레이딩 및 시그널 시스템) 골드를 위한 최고의 EA: Gold Slayer 이 인디케이터는 고급 전략, 사용자 지정 가능한 주문 관리 시스템, 그리고 엔벨로프 확장을 결합한 평균 회귀(mean reversion) 시스템을 포함하고 있습니다. 또한 RSI와 같은 여러 지능형 확인 필터를 통해 높은 확률의 반전 진입 구간을 포착하여 BUY 및 SELL 시그널을 제공합니다. 단순히 거래 방법만 배우는 것이 아니라, 여러 포지션을 효과적으로 관리하고 이전에 수익 중인 오픈 포지션으로 손실 거래를 커버하는 방법까지 익힐 수 있습니다. M5 전용으로 설계 및 최적화되었으며, 유동성이 풍부해 시그널이 더 깔끔하고 신뢰도 높은 BTCUSD와 XAUUSD에서 뛰어난 성능을 발휘합니다. 이 인디케이터는 ATR 기반으로 자동 계산된 진입가, 손절가, 익절가와
Smart Trend Trading System — MetaTrader 5 구매 후 MQL5에서 저에게 메시지를 보내시면 Smart Universal Expert Advisor를 무료로 받으실 수 있으며, 온라인 강좌, PDF 매뉴얼 및 비공개 그룹 이용 권한도 함께 제공됩니다. STTS는 추세 방향, 진입·청산 신호, 반전 구간, 주요 가격 수준을 차트에 모아 보여줍니다. 시스템을 참고해 수동으로 거래하거나, 별도의 호환 EA를 연결하여 선택한 설정에 따라 자동으로 거래를 실행할 수 있습니다. 하나의 시스템, 네 가지 트레이딩 접근법 STTS의 트레이딩 접근법은 크게 네 가지로 나뉩니다. • 스캘핑 — 단기 신호와 시장 움직임을 살펴봅니다. • 추세 매매 — 방향을 평가하고 추세 안에서 기회를 찾습니다. • 반전 매매 — 잠재적인 전환 구간과 방향 변화를 파악합니다. • 거래량 매매 — 거래량 기반 정보로 시장 활동을 평가합니다. 진입·청산 화살표, 추세 정보, 지지·저항 수
Zoryk Gold
Reda El Koutbane
4.78 (18)
ZORYK — MetaTrader 5용 XAUUSD 전문 신호 및 트레이드 플래닝 시스템 이런 경험이 있을 것입니다. 골드를 분석하고 진입을 기다린 뒤 마침내 포지션을 열었지만 가격이 곧바로 반대 방향으로 움직입니다. 너무 일찍 청산하거나 Stop Loss를 옮기거나 몇 초 동안 망설입니다. 그 후 시장은 내가 없이도 처음 예상했던 목표까지 정확히 움직입니다. 문제는 항상 방향이 아니었습니다. 진짜 문제는 불확실성이었습니다. 정확한 진입 위치를 몰랐습니다. 어느 지점에서 원래의 트레이드 아이디어가 무효가 되는지 몰랐습니다. 가까운 수익을 확보해야 할지 더 큰 움직임을 기다려야 할지 판단하기 어려웠습니다. 현재 setup이 정말 강한지 아니면 단지 새로운 거래를 억지로 찾고 있는지도 확신하기 어려웠습니다. 골드는 매우 빠르게 움직입니다. 명확한 계획이 없다면 좋은 분석도 몇 초 만에 나쁜 결정으로 바뀔 수 있습니다. ZORYK는 이 문제를 해결하기 위해 개발되었습니다.
M5 Sniper
MeanFX
5 (4)
당신의 트레이딩 우위를 한눈에 확인하세요! M5 Sniper 는 MeanFX의 새로운 지표입니다. 정확한 트레이딩 신호 와 적응형 TP/SL 레벨 을 결합하여, 결과적으로 가능한 최고의 통계적 트레이딩을 만들어냅니다! 5회 구매마다 가격이 인상되며, 다음 가격은 69$입니다. 구매 후 저에게 메시지를 보내주시면 팁/가이드와 보너스 EA를 제공해 드립니다. 무엇이 이 지표를 특별하게 만들까요? Gold XAUUSD에서 검증된 통계적 성과 ( 거의 모든 자산에서 작동 하며, 일관된 결과 없이 모든 것을 다루려고 하기보다는 하나의 타임프레임을 완전히 익히는 데 집중합니다) 각 심볼당 하루 1~8회의 트레이드 와 높은 승률을 제공하며, 모든 통계적 우위를 우리의 편으로 가져갑니다. 차트에는 확인된 BUY 및 SELL 신호만 표시됩니다. 각 트레이드에 대해 지표가 생성하는 적응형 TP 및 SL 레벨 평균 승률 75%+ 평균 Signal Ratio 최소 1.1+ 알람 및 알림이 휴대폰 으로도
SuperScalp Pro
Van Minh Nguyen
4.54 (37)
SuperScalp Pro - Professional Multi-Layer Confluence Scalping System SuperScalp Pro는 기존 Supertrend에 여러 지능형 확인 필터를 추가하여 기능을 강화한 고급 스캘핑 지표입니다. 잘못된 신호를 크게 줄이면서 성공 가능성이 더 높은 Buy/Sell 거래 기회를 식별하는 데 도움을 줍니다. 명확한 Buy 및 Sell 화살표가 차트에 직접 표시되며, ATR 기반 Stop Loss 및 Take Profit 레벨도 실시간으로 자동 계산됩니다. 구매 후 MQL5 메시지로 저에게 연락하시면 SuperScalp Pro Auto Trader EA를 무료로 받으실 수 있으며, 사용자 가이드와 비공개 그룹 이용 권한도 제공됩니다. 권장 설정 파일 다운로드: [Set File] 전체 문서는 제품 블로그에서 확인할 수 있습니다: [User Guide] 업데이트를 받으려면 공식 채널에 참여하세요: [Official Channel]
Gold Trend Coach MT5
Cristhian Alexander Gaibor Cuasquer
4.2 (10)
Gold Trend Coach는 MetaTrader 5용 금(XAUUSD) 추세 지표로, 캔들 마감에 확정되는 매수·매도 신호(리페인트 없음), 손절과 세 개의 익절 목표, 진입부터 TP3까지 안내하는 코치, 멀티 타임프레임 패널, 휴대폰과 텔레그램 알림을 제공합니다. 런던·뉴욕 세션의 M1·M5 스캘핑과 M15 데이 트레이딩용으로 만들었습니다. 보너스: Gold Trend Coach 자동매매 EA 무료 제공. 구매 후 메시지를 주시면 지표 신호로 자동 매매하는 EA와, 모든 신호·진입·손절·도달한 목표를 텔레그램 채팅, 그룹 또는 채널로 보내는 Telegram Alert Bridge를 set 파일과 설치 가이드와 함께 보내 드립니다. 출시 가격 $39는 처음 20개 한정이었고 이미 매진되었습니다. 현재 가격 40개까지 $45, 이후 $59. 예정된 최종 가격 $79. 아마 이미 수십 개의 금 지표를 써 보셨을 겁니다. 대부분은 화살표로 매수·매도 신호만 주고 가장 어려운 부분, 즉
Entry Points Pro for MT5
Yury Orlov
4.52 (152)
Entry Points Pro는 주문을 넣기 전에 어디에서 진입하고, 스탑을 어디에 두고, 어떤 랏으로 거래할지 보여 줍니다. 가격 지금 149 USD이며, 이 가격으로는 마지막 1카피입니다. 이후 가격은 199 USD로 오르고, 최종 가격은 349 USD입니다. 저는 시장에서 트레이딩으로 돈을 벌고 그것을 보여 드립니다. 그래서 이 인디케이터를 모두에게 팔 필요가 없습니다. 스스로 생각하는 트레이더를 위한 도구이지, 마법 버튼이 아닙니다. 화살표는 캔들이 마감될 때 나타나며 리페인팅되지 않습니다. 설정은 두 가지: 예치금과 거래당 리스크. 결제 전에 확인하세요: 무료 데모는 MT5 전략 테스터에서 작동하며 2분이면 됩니다. 구매 후에는 제가 직접 설정을 도와 드리겠습니다. 2019년, 저는 이 지표가 무엇을 할 수 있는지 전 세계에 보여 주었습니다. 실계좌에서 지표의 시그널에 따라 수동으로, 모두가 볼 수 있게 공개적으로 거래했습니다 — 계좌는 Myfxbook에서 모니터링되었고,
GoldenX Entry MT5
VividMind Digital Solutions
5 (17)
GoldenX Entry는 MT5용 인디케이터로, 적응형 Smart Entry Trend 알고리즘, 신호 스코어링 시스템, 시장 레짐 감지 기능, 그리고 변동성 필터를 포함합니다. 각 신호에는 계산된 진입 레벨, 3개의 익절(TP1, TP2, TP3) 레벨, 그리고 손절(Stop-Loss) 레벨이 포함됩니다. 이 인디케이터는 다양한 시장 환경에 적응하도록 설계된 다중 분석 레이어 구조 위에 구축되어 있으며, 내장 최적화기와 통계 추적 시스템을 결합합니다. 또한 Risk-to-Reward(RR) 지표와 과거 거래 행동 기반의 정량 분석을 제공합니다. 시작은 간단합니다 — 선택한 타임프레임에서 최적화기를 실행한 뒤 차트에서 바로 인디케이터를 사용하면 됩니다. 핵심 기능 GoldenX Entry는 하나의 차트에서 신호 엔진, 트레이드 관리 기능, 그리고 과거 통계 추적을 통합합니다: - 내장 최적화기: 최적화기는 차트에서 원클릭으로 실행됩니다. 200개의 파라미터 조합을 두 단계 탐색
SMC Intraday Formula
VividMind Digital Solutions
5 (26)
먼저 솔직하게 말하겠습니다. 어떤 인디케이터도 단독으로 당신을 수익성 있게 만들어주지 않습니다. 누군가 그렇게 말한다면, 그는 당신에게 꿈을 파는 것입니다. 완벽한 매수/매도 화살표를 보여주는 모든 인디케이터는 완벽하게 보이도록 만들 수 있습니다 — 단지 올바른 과거 구간을 확대하고 승리한 거래만 캡처하면 됩니다. 우리는 그렇게 하지 않습니다.  SMC Intraday Formula는 도구입니다. 시장 구조를 읽고, 가장 높은 확률의 가격 구간을 표시하며, 현재 스마트 머니의 흐름이 어떻게 보이는지 아주 단순한 언어로 보여줍니다. 최종 결정은 여전히 당신이 합니다. 실행도 당신이 합니다. 하지만 이제는 희망이 아니라 정확성으로 거래하게 됩니다. 우리는 이 인디케이터를 지난 약 3년 동안 골드(XAUUSD) 및 주요 외환 통화쌍의 데이 트레이딩 스캘핑에 사용해 왔습니다. M1, M5, M15, M30에서 우리의 핵심 도구입니다. 이 도구는 미래를 예측하려 하지 않습니다 — 지금 형성
Ultra Indicator
Ihor Otkydach
5 (1)
ULTRA는 “올인원” 방식으로 작동하는 기술적 지표로, 시장을 독자적으로 분석하고, 매매 신호를 생성하며, 손절매 주문 설정 수준을 표시하고, 이익을 실현하거나 손실을 최소화하기 위해 포지션을 청산해야 할 시점을 제안합니다. 다시 말해, 시장을 분석하는 법을 모르거나, 가격 수준(손절매를 어디에 설정할지)을 파악하지 못하거나, 자금 관리에 어려움을 겪더라도 상관없습니다. ULTRA가 그 모든 것을 대신 해줄 테니까요! 구매자 특전 : ULTRA 지표를 구매하신 후, 저에게 비공개 메시지를 보내주시면 “ULTRA BOT”을 무료 선물로 드립니다. 이 도구는 해당 지표의 신호를 바탕으로 개설한 거래를 관리하는 데 도움을 주는 특별한 도구입니다(각 거래에 대해 손절매를 설정하고, 최상의 결과를 얻을 수 있도록 전략의 규칙에 따라 거래를 자동으로 청산해 줍니다).  또한 구매자분들께 다양한 자산에 바로 적용할 수 있는 설정값을 제공해 드리고 있으며, 이를 통해 지표가 최대 효율로 작동할
Gann Made Easy MT5
Oleg Rodin
5 (13)
Gann Made Easy 는 mr.의 이론을 사용하여 최고의 거래 원칙을 기반으로 하는 전문적이고 사용하기 쉬운 Forex 거래 시스템입니다. W.D. 간. 이 표시기는 Stop Loss 및 Take Profit Levels를 포함하여 정확한 BUY 및 SELL 신호를 제공합니다. PUSH 알림을 사용하여 이동 중에도 거래할 수 있습니다. 구매 후 거래 방법 안내 및 유용한 추가 지표를 무료로 받으시려면 저에게 연락주세요! 아마도 Gann 거래 방법에 대해 이미 여러 번 들었을 것입니다. 일반적으로 Gann의 이론은 초보자 거래자뿐만 아니라 이미 거래 경험이 있는 사람들에게도 매우 복잡한 것입니다. Gann의 거래 방식은 이론적으로 적용하기 쉽지 않기 때문입니다. 나는 그 지식을 연마하고 Forex 지표에 최고의 원칙을 적용하기 위해 몇 년을 보냈습니다. 표시기는 적용하기가 매우 쉽습니다. 차트에 첨부하고 간단한 거래 권장 사항을 따르기만 하면 됩니다. 지표는 지속적으로 시장 분석
M1 Sniper MT5
Oleg Rodin
5 (7)
M1 SNIPER 는 사용하기 쉬운 거래 지표 시스템입니다. M1 시간대에 맞춰 설계된 화살표 지표입니다. 이 지표는 M1 시간대 스캘핑을 위한 단독 시스템으로 사용할 수 있으며, 기존 거래 시스템의 일부로도 사용할 수 있습니다. 이 거래 시스템은 M1 시간대 거래용으로 특별히 설계되었지만, 다른 시간대에도 사용할 수 있습니다. 원래는 XAUUSD와 BTCUSD 거래를 위해 이 방법을 설계했지만, 다른 시장 거래에도 유용하다는 것을 알게 되었습니다. 이 지표의 신호는 추세 방향과 반대로 거래될 수 있습니다. 저는 지표의 신호를 활용하여 양방향으로 거래할 수 있도록 돕는 특별한 거래 기법을 알려드립니다. 이 방법은 특별한 동적 지지선과 저항선 가격 영역을 활용하는 것을 기반으로 합니다. 구매하시면 M1 SNIPER 화살표 지표를 바로 다운로드하실 수 있습니다. 또한, 아래 스크린샷에 표시된 Apollo Dynamic SR 지표는 M1 SNIPER 도구를 사용하는 모든 사용자에게 무료로
다음 업데이트 — 버전 2.52 곧 출시! [신규] 시장 분석 및 트레이딩 워크플로를 향상시키기 위해 설계된 4가지 주요 신규 기능을 기대해 주세요. 트레이딩 요구 사항을 충족하도록 설계된 4가지 새로운 기능으로 시장 분석을 한 단계 더 발전시킵니다. 다음 기능을 소개합니다: 1. TRADE OVERVIEW DASHBOARD 2. CONFLUENCE AT ZONE 3. STRONG & WEAK HIGH/LOW 4. OTE 1. TRADE OVERVIEW DASHBOARD 시장 전체 상황을 더 쉽게 파악할 수 있도록 도와주는 대시보드입니다. 트레이딩 의사결정을 지원하는 가이드를 제공하며, 하나의 화면에서 시장을 분석하고 체계적으로 트레이딩을 계획할 수 있도록 도와줍니다. 멀티 타임프레임 시장 개요 (Multi-Timeframe Market Overview) 시장 방향과 가격 구조를 더욱 명확하게 파악 시장 상황을 빠르게 확인 체계적인 시장 분석 및 진입 계획을 위한 가이드 2. CO
Adaptive Price Action Engine 지표를 구매하면 EA(자동매매 프로그램)가 무료 멀티 타임프레임 기반 자기 최적화 추세 & 캔들 패턴 분석 시스템 시장은 끊임없이 변화하며, 모든 Price Action 패턴이 모든 시장 환경에서 동일한 가치를 가지는 것은 아닙니다. Adaptive Price Action Engine 은 변화하는 시장 환경에 적응할 수 있도록 설계되었으며, 추세 구조, 멀티 타임프레임 분석, 캔들 패턴 및 통계적 최적화 를 하나의 분석 프레임워크로 결합합니다. 두 가지 적응형 모드 Dual Alpha Trend Mode 낮은 타임프레임과 높은 타임프레임에서 적합한 Alpha Trend 파라미터를 자동으로 탐색하여, 최근 시장 움직임에 맞춰 추세 분석을 조정합니다. Candlestick + Alpha Mode Alpha Trend를 통한 시장 국면 분석과 22개의 상승 및 하락 캔들 패턴 을 결합합니다. 모든 패턴을 동일하게 취급하는 대신, 다양
FiboSniper Pro
Van Minh Nguyen
5 (4)
FiboSniper Pro – Multi-Filter Fibonacci System with Auto SL/TP and Control Panel FiboSniper Pro는 동적 Fibonacci Envelopes와 여러 확인 필터를 결합하여 선별된 Buy 및 Sell 신호를 생성하는 기술적 지표입니다. Fibonacci 레벨은 Moving Average와 ATR을 기반으로 계산된 후 ADX, EMA, RSI, ATR, Volume, Time 및 Candle 구조를 통해 필터링됩니다. 이 지표는 ATR 기반의 자동 Stop Loss 및 Take Profit 레벨을 차트에 직접 표시하며, 빠른 설정 조정을 위한 인터랙티브 Control Panel을 제공합니다. 구매 후 MQL5 메시지로 저에게 연락하시면 Auto Trader X를 무료로 받으실 수 있으며, 이 지표의 거래 신호를 자동화하는 방법에 대한 안내도 제공됩니다. User Guide 및 Set Files: [Click here
Auto Optimized SpeedAngle 은 지속적인 워크포워드 최적화(Walk-Forward Optimization, WFO)를 통해 곡선 적합(curve-fitting)을 제거한 기관 수준의 모멘텀 벡터화 시스템입니다. 시장 체제가 바뀔 때 성능이 떨어지는 정적 입력에 의존하는 대신, 이 지표는 표본 외(Out-of-Sample, OOS) 검증을 사용하여 매개변수를 동적으로 재보정하며, 표시되는 신호가 과거의 우연이 아닌 진정한 통계적 우위를 나타내도록 보장합니다. 핵심 기관용 프레임워크 워크포워드 최적화 엔진: 핵심 알고리즘은 수천 가지의 룩백(lookback) 및 임계값 조합을 지속적으로 스캔하며, 데이터를 인샘플(in-sample)과 표본 외(out-of-sample) 세트로 엄격하게 분리합니다. 미지의 데이터 환경에서 수학적 우수성이 증명된 경우에만 새로운 매개변수 구성을 채택합니다. 정량적 목적 함수: 순수한 총이익을 쫓는 대신, 최적화 엔진은 기관 수준의 안정성
Boba Analysis Suite
Trade Ready Solutions LLC
5 (2)
Boba Analysis Suite Boba Analysis Suite는 MetaTrader 5용 분석 지표입니다. 시장 구조, 주요 가격 영역, 전반적인 시장 상황을 하나의 차트 화면에 통합하여 표시합니다. 트레이더이자 트레이딩 코치로서의 실무 경험을 바탕으로 개발되었으며, 시장 방향 평가, 주요 가격 수준 식별, 여러 시간대의 종합적인 분석 등 체계적인 분석 과정을 지원합니다. 시장 맥락을 고려한 분석 개별 신호의 의미는 시장 상황에 따라 달라집니다. Boba Analysis Suite는 현재 차트 상황을 더 넓은 시장 구조와 연결하고, 사전에 정한 규칙에 따라 매매 아이디어를 검토할 수 있도록 돕습니다. 주요 분석 기능은 다음과 같습니다. 추세 및 시장 구조: 시장 방향과 관련 구조적 맥락을 평가합니다. 주요 가격 영역 및 수준: 추가 분석이 필요한 중요한 영역을 차트에 시각적으로 표시합니다. 여러 시간대: 서로 다른 시간대의 정보를 통합하여 전반적인 시장 상황을 평가합니다.
ScalpPoint
Temirlan Kdyrkhan
ScalpPoint is a powerful trading companion designed to generate high-probability entry signals with dynamic TP/SL/DP levels based on volatility. Built-in performance tracking shows win/loss stats, PP1/PP2 hits, and success rates — all updated live. Key Features: Buy/Sell signals with adaptive volatility bands Real-time TP/SL/DP levels based on ATR Built-in MA Filter with optional ATR/StdDev volatility Performance stats panel (Success, Profit/Loss, PP1/PP2) Alerts via popup, sound, push, or emai
ARICoins
Temirlan Kdyrkhan
ARICoin is a powerful trading companion designed to generate high-probability entry signals with dynamic TP/SL/DP levels based on volatility. Built-in performance tracking shows win/loss stats, PP1/PP2 hits, and success rates all updated live. Key Features: Buy/Sell signals with adaptive volatility bands Real-time TP/SL/DP levels based on ATR Built-in MA Filter with optional ATR/StdDev volatility Performance stats panel (Success, Profit/Loss, PP1/PP2) Alerts via popup, sound, push, or email Cust
Crystal Heikin Ashi Signals
Muhammad Jawad Shabir
5 (5)
Crystal Heikin Ashi Signals—Professional Trend & Signal Detection Indicator Advanced Heikin Ashi Visualization with Intelligent Signal System for Manual & Automated Trading Final Price: $149 ---------> Price goes up $10 after every 10 sales . Limited slots available — act fast . Overview User Guide PDF Crystal Heikin Ashi Signals is a professional-grade MetaTrader 5 indicator that combines pure Heikin Ashi candle visualization with an advanced momentum-shift detection system. Designed for both m
Scalper Vault MT5
Oleg Rodin
5 (1)
Scalper Vault는 당일 매매(intraday trading)에서 일관된 성과를 내고자 하는 트레이더를 위해 설계된, 강력하고 모든 기능을 갖춘 트레이딩 시스템입니다. 이 고정밀 지표는 외환(Forex) 및 바이너리 옵션 트레이더 모두에게 기관급 분석을 제공하는 독립적인 종합 트레이딩 시스템 역할을 합니다. 구매 후 저에게 연락해 주시면, 트레이딩 팁과 함께 특별한 보너스를 제공해 드립니다! Scalper Vault는 추측에 의존하거나 복잡한 수동 분석을 할 필요를 없애주며, 사용하기 쉬운 트레이딩 기법을 통해 오직 매매 실행에만 집중할 수 있도록 돕습니다. 정확한 추세 추종 신호: 핵심 알고리즘이 시장 구조를 분석하여, 지배적인 시장 추세 방향과 일치하는 고확률 신호만을 제공함으로써 잘못된 진입을 획기적으로 줄여줍니다. 정밀한 고점 및 저점 탐지: 시장의 움직임이 소진되는 지점을 스캔하여 잠재적인 반전 구간을 식별합니다. 간(Gann) 이론 기반의 매수/매도 구간: 수학적
Azimuth Pro
Ottaviano De Cicco
5 (7)
Azimuth Pro V2: Synthetic Fractal Structure and Confirmed Entries for MT5 Overview Azimuth Pro is a multi-level swing structure indicator by Merkava Labs . Four nested swing layers, swing-anchored VWAP, ABC pattern detection, three-timeframe structural filtering, and closed-bar confirmed entries — one chart, one workflow from micro-swings to macro-cycles. This is not a blind signal product. It is a structure-first workflow for traders who care about location, context, and timing. Halloween P
Trend Catcher ind mt5
Ramil Minniakhmetov
5 (18)
트렌드 캐처 인디케이터 트렌드 캐처 인디케이터는 개발자가 자체 개발한 맞춤형 적응형 트렌드 분석 지표들을 조합하여 시장 가격 움직임을 분석합니다. 단기적인 노이즈를 제거하고 근본적인 모멘텀 강도, 변동성 확대, 가격 구조 움직임에 집중하여 진정한 시장 방향을 파악합니다. 또한 이동 평균, RSI, 변동성 필터와 같은 맞춤형 지표들을 활용하여 가격을 평활화하고 트렌드를 필터링합니다. 실제 운영 모니터링 및 기타 제품은 다음 링크에서 확인하실 수 있습니다:   https://www.mql5.com/en/users/mechanic/seller 텔레그램에서는 EA나 설정 파일을 판매하지 않습니다. 사기이니 주의하세요. 모든 설정 파일은 블로그에서 무료로 제공됩니다. 중요! 구매 후 즉시 연락 주시면 사용 방법 및 보너스를 드립니다!
Volatility Master for MetaTrader is a real-time dashboard tool that scans up to  50 symbols  to identify high-volatility , trending markets instantly. With bullish/bearish signals, customizable alerts, and a user-friendly interface, it helps you avoid range-bound conditions and focus on high-probability trades. Clarity leads to confidence. Trade confidently and protect your capital effectively with this powerful dashboard. We don't offer free or bonus indicators in exchange of reviews from you.
Apex Patterns PRO 인디케이터 구매 시 - 기반 Expert Advisor 무료 제공. 자체 최적화 차트 패턴 및 브레이크아웃 분석 시스템 기존의 패턴 스캐너는 고정된 파라미터에 의존하므로 시장 변동성과 구조가 변화할 때 성능이 저하되는 경우가 많습니다. Apex Patterns PRO는 구조적 차트 패턴 인식, 모멘텀 필터링, 통계적 자체 최적화를 하나의 분석 프레임워크로 결합하여 변화하는 시장 환경에 적응하도록 설계되었습니다. 적응형 스캐닝 엔진 자체 최적화 패턴 모드 최근 과거 데이터를 바탕으로 적절한 패턴 파라미터를 자동으로 탐색하여, 정적인 설정 대신 현재 시장 행보에 맞춰 인디케이터의 구조 감지 방식을 적응시킵니다. 스마트 브레이크아웃 필터링 클래식 패턴 인식과 모멘텀, 거래량, 프라이스 액션 지표를 결합합니다. 모든 브레이크아웃을 동일하게 다루는 대신, 시장의 기저 구조를 평가하여 현재 통계적 환경에 부합하는 셋업을 식별합니다. 주요 기능 리페인트 없는 고
Unix Scalper
Issam Kassas
4 (4)
Unix Scalper — MetaTrader 5 구매 후 MQL5에서 저에게 메시지를 보내시면 Smart Universal Expert Advisor를 무료로 받으실 수 있으며, 온라인 강좌, PDF 매뉴얼 및 비공개 그룹 이용 권한도 함께 제공됩니다. 매매 기회를 찾고, 거래 계획을 확인하고, 실행 방법을 선택하세요. UNIX Scalper는 시장 분석, BUY/SELL/WAIT 판단, Entry, Stop Loss, TP1 및 TP2 가격 수준을 하나의 정돈된 패널에 제공합니다. 신호와 거래 계획을 한눈에 • 명확한 판단: BUY, SELL 또는 WAIT. • 구체적인 가격 수준: Entry, Stop Loss, TP1 및 TP2. • 다중 시간대 개요: 패널의 여러 시간대 신호를 비교하세요. • 판단을 돕는 분석: 추세, 모멘텀, 거래량, 변동성, 지지와 저항, 시장 품질. • 다양한 레이아웃: Minimized, Compact, Standard 또는 Full. 신호와
Neuro Poseidon MT5
Daria Rezueva
4.68 (53)
Neuro Poseidon is a new indicator by Daria Rezueva. It combines precise trading signals with adaptive TP/SL levels - creating best possible trades as a result! Message me and get  Neuro Poseidon Assistant  as a gift to automize your trading process! What makes it stand out? 1. Proven profitability on all assets and timeframes 2. Only confirmed BUY and SELL signals present on the chart 3. Adaptive TP & SL levels generated by the software for each trade 4. Easy to understand - suitable for al
SIO Oscillator
Davit Beridze
SIO Oscillator: 자기 최적화 세미분산 불균형 오실레이터 지표를 구매하시면 이를 기반으로 한 전문가 어드바이저(EA)를 무료로 받으실 수 있습니다. 대부분의 오실레이터는 모든 가격 움직임을 똑같이 취급합니다. SIO는 상승 압력과 하락 압력을 분리하여 둘 사이의 불균형을 측정하고, 매수자와 매도자 중 어느 쪽이 실제로 시장을 주도하고 있는지 보여줍니다. 불균형이 극단에 도달하면 SIO는 진입가, 손절(Stop Loss), 익절(Take Profit) 수준이 포함된 명확한 신호를 표시합니다. SIO의 차별점은 고정된 설정에 의존하지 않는다는 것입니다. 내장된 자기 최적화 엔진이 현재 종목과 시간 프레임에 맞는 파라미터를 지속적으로 탐색하고, 사용하기 전에 검증합니다. 두 가지 신호 모드 평균 회귀(Mean Reversion): 불균형의 극단에서 거래하며 균형으로의 복귀를 노립니다. 추세 추종(Trend Following): 지속적이고 우세한 불균형의 방향으로 거래합니다. 자
Atomic Analyst MT5
Issam Kassas
4.5 (64)
Atomic Analyst — MetaTrader 5 구매 후 MQL5에서 저에게 메시지를 보내시면 Smart Universal Expert Advisor를 무료로 받으실 수 있으며, 온라인 강좌, PDF 매뉴얼 및 비공개 그룹 이용 권한도 함께 제공됩니다. Atomic Analyst는 가격 움직임 분석, 추세 방향, 진입·청산 신호, 손절 수준, 여러 익절 수준을 차트에 모아 보여줍니다. 신호를 확인하고 매매 상황을 이해하세요 Atomic Analyst는 분석 결과를 명확한 시각 정보로 정리합니다. • 잠재적인 진입 기회를 확인할 수 있는 매수·매도 화살표. • 거래 계획에 도움이 되는 손절 수준과 여러 익절 수준. • 시장 방향을 평가할 수 있는 추세, 강도, 모멘텀 수치. • 더 넓은 시장 맥락을 비교할 수 있는 여러 시간대 분석. • 변화하는 시장 상황을 따라갈 수 있는 색상별 캔들과 알림. 신호와 보조 분석을 함께 검토한 다음, 해당 매매 상황이 자신의 거래 규칙에
제작자의 제품 더 보기
BollMTFzzz
Guo Sheng Zhao
Bollinger Bands MTF projects Bollinger Bands from multiple timeframes onto the current MT4 chart. It helps traders review volatility boundaries, trend direction, and nearby price confluence across several timeframes from a single workspace. Key features: - Supports M1, M5, M15, M30, H1, and D1 Bollinger Bands. - Independently displays middle, upper, and lower bands, with an option to show only timeframes above the current chart period. - Evaluates middle-band slope and highlights the active t
FREE
左右交易的其实都是情绪,把握情绪才是交易最终能够获得盈利的关键。 所以我这是一个「趋势氛围灯」指标,它能为您的交易图表做三件事: 1. 一眼识别市场状态 深蓝色背景   → 市场处于 强劲多头氛围 深红色背景   → 市场处于 强劲空头氛围 深灰色背景   → 市场处于 震荡平衡状态 2. 提供直观的视觉辅助 将复杂的多空力量对比 转化为最直观的背景色 让您 无需分析数据 就能感受市场情绪 在多个图表间切换时能 瞬间把握每个品种的当前强弱 3. 辅助交易决策 避免在强势多头时逆势做空 避免在强势空头时逆势做多 在震荡行情中提醒您保持观望或采用区间策略 本质上,它就像为您的交易图表安装了一个「情绪指示灯」,用颜色告诉您市场此刻的“性格”是强势上涨、强势下跌还是犹豫不决.
SAMBAisgood
Guo Sheng Zhao
Long-Term Trend Top & Bottom Identification Indicator (Exclusive for Medium-to-Long-Term Trading) I. Core Orientation of the Indicator This indicator is a streamlined analysis tool   focused on long-term market trends , designed to identify   top and bottom inflection points   for trading varieties such as forex and precious metals. By filtering out interfering signals from small-to-medium cycles, it provides clear guidance for medium-to-long-term trading decisions. II. Core Functions & Chart Pr
The ADX Dashboard V11.03 is a professional MT4 indicator designed to provide traders with an intuitive visual overview of trend strength and market sentiment across multiple timeframes. It integrates ADX (Average Directional Index) and RSI (Relative Strength Index) indicators, presenting key data in a concise dashboard to help traders make quick and informed trading decisions without complex analysis of individual indicator charts. First, the installation process is straightforward. Copy the co
Fibopro
Guo Sheng Zhao
FiboPro 2.11 Indicator User Manual I. Overview FiboPro 2.11 is a dynamic Fibonacci support/resistance indicator for MT4. It calculates multiple Fibonacci levels via a dynamic central line and volatility, intuitively showing market trends (bullish/bearish/sideways) and identifying overbought/oversold signals. Suitable for forex, futures, stocks, etc., it’s recommended for M15+ timeframes to avoid short-term noise. II. Installation Guide Copy fiboz.mq4 to the "MQL4/Indicators" folder in your MT4
================================ ENGLISH MANUAL ================================ Product Name: One-Click Close Utility v9.4 Developer: Gemini Partner Version: 9.40 Platform: MetaTrader 4 Type: Expert Advisor I. PRODUCT OVERVIEW --------------- One-Click Close is a professional order management utility designed for  MetaTrader 4 platform. It provides rapid batch closing operations through  intuitive button interface, integrated with intelligent risk management  system. Suitable for both manual
UltimateSystem
Guo Sheng Zhao
Ultimate_Combined_System_V16.3_EN Indicator Introduction Ultimate_Combined_System_V16.3 (UCS V16.3) is a professional comprehensive trend-following indicator designed for MetaTrader 4 (MT4). It integrates five core technical analysis factors—MACD, ADX, EMA, Momentum, and Donchian Channel—to provide accurate trend identification and market state judgment, serving as an essential auxiliary tool for trend traders. At the core of the indicator lies a 4-factor voting scoring system , which evaluates
GoldAuctionPA
Guo Sheng Zhao
Gold Auction Price Action Dealer Indicator (UTC+0, NY Close). Combines volume profile (POC/VAH/VAL), liquidity sweep detection, naked price action (pinbar/engulfing), breakout-acceptance logic, and multi-timeframe key levels (prior day/week/month, Asian session, H1/H4 swings, round numbers). Includes a cognitive scoring filter based on auction location, session timing, and HTF trend bias to qualify signals. Displays levels, value area box, signal arrows, and an on-chart info panel with trade pla
QuietConfluence
Guo Sheng Zhao
Quiet Confluence is a multi-factor technical analysis indicator for MT4. It combines Bollinger Band trend context, breakout scoring, MACD divergence, volatility states, and support and resistance information in one chart workspace. It is designed for traders who want to review several aspects of market conditions without switching between multiple indicators. Key features: - Displays Bollinger upper and lower bands with a direction-sensitive middle band. - Calculates breakout scores from pric
Bollinger Insight is a tick-volume price distribution tool for MT4. It displays a volume profile, point of control, value area, and low-volume regions directly on the main chart, helping users examine where market activity was concentrated within the selected range. Key features: - Builds a Tick Volume Profile across configurable price rows. - Displays the point of control and supports a developing POC mode. - Calculates VAH and VAL with an adjustable value-area ratio. - Detects low-volume no
Market Structure Toolkit identifies and annotates price structure, structural breaks, character changes, swing points, and supply and demand regions on MT4 charts. It brings commonly used market-structure tools into one configurable indicator. Key features: - Supports external and internal structure modes. - Marks BoS and CHoCH, with optional CHoT and liquidity-sweep lines. - Detects bullish and bearish order blocks, supply zones, and demand zones. - Can remove invalidated zones or retain and
Squeeze Momentum compares Bollinger Bands with the Keltner Channel to identify volatility compression and release, while a color-coded histogram displays momentum direction and change. It is intended for reviewing low-volatility phases and subsequent volatility expansion. Key features: - Identifies no-squeeze, squeeze-on, and squeeze-released states. - Uses four histogram states for rising bullish, fading bullish, strengthening bearish, and fading bearish momentum. - Provides adjustable Bolli
CR7Structure
Guo Sheng Zhao
CR7 结构——市场结构解码。 价格波动并非随机,而是取决于决策。CR7 Structure旨在精准地向您展示这些决策的制定过程,以及其中一项决策失败的瞬间。 大多数结构分析工具会用几十条线淹没图表,让你自己去猜测哪些线才是关键。CR7 则恰恰相反。它的自适应过滤引擎会持续评估市场波动,只保留当前价格实际遵循的水平。其他所有信息在显示到你的屏幕之前就被舍弃了。 当这些价位之一真正被突破时,CR7 指标会标记突破点,反转趋势状态,并按照市场既定方向重新绘制K线图。你会在突破真正发生的那一刻就看到这种转变——而不是三根K线之后,也不是在一个原本就无关紧要的价位上。 图表上显示的内容 清晰的结构水平线,并以自适应发光效果突出显示当前最重要的两个水平线。活跃结构上实时显示价格标签。突破结构标记采用波动率感知间距,确保它们不会与K线重叠。趋势状态K线颜色有两种可选模式。实时仪表盘显示当前趋势、活跃结构价格、区间宽度、结构强度以及最近一次确认的突破。四款精心调校的专业主题——Aurum、Neon、Carbon和完全自定义。 专为真实交易环境而设计 已确认的K线结构不会改变。无需回溯调整,信号不会
C6MRApro
Guo Sheng Zhao
这个指标通过沉稳、清晰、专业的视野,为复杂多变的以太市场带来更多秩序的观察体验。 无论面对快速波动、方向反复还是节奏模糊的市场环境,该指标均会引发一个紧张、关注、易观察的决策波动。 视觉反馈有助于降低情绪干扰,避免因画面混杂而产生干扰,让用户更耐心等待值得关注的时刻。它既适合盘中快速浏览,也适合复盘时梳理市场状态,使每一次观察市场更有层次,每一次判断更容易,每一次等待更有目的。  在使用贸易中可以进一步发挥交易的机会以及潜在的食品风险。 指标只是交易的一部分,但是我希望你能借助它更好的解读市场,适应市场,紧随市场的趋势;让你在面对行情的时候可以更稳定,更从容,更自信。 z整个指标不追求夸张的颜色对比,也不做过度的解读,只是安静的解释市场发生的事情,提及市场可能存在的风险,让你感受到市场的节奏,从而理性的做出相应的判断。
TradeQA
Guo Sheng Zhao
这款量价结构指标适用于   MetaTrader 4 和 MetaTrader 5   的图表分析指标,集合量价结构、成交量分布、市场情绪、波动提示和关键价格区域表现于一体。指标运行直接于主图窗口,可帮助交易者快速观察市场的重要价格位置与活跃程度。 它采用了动态的POC,可以让你看到市场中价值的迁移过程。同时还有四种成交量K线涂色使你不会在不合适的位置入场。 ni你在图表上可以看到VAH,POC,VAH,以及分布图和右侧的情绪值,这样你能轻松的看到市场的交易情绪从而不陷入狂热中去,冷静的看待交易,看待盈亏。 希望你能通过这个指标清晰的看清市场,明白价格所在,位置所处,找到自己的交易节奏。 z指标只是交易的一部分,只是辅助,所以,你要专注而不执拗,冷静的看待每次交易。加油吧,孤独的交易者。
WZY Whale Fall Structure Lines for MetaTrader 4 A clearer way to read the chart. WZY Whale Fall Structure Lines is a visual market-structure companion for traders who want important price areas to stay visible without covering the chart with manual drawings or extra indicator panels. It brings a calm, organized layer of support and resistance context to the main chart, so you can spend more time reading price and less time maintaining annotations. When the market moves quickly, attention bec
TradeAQ
Guo Sheng Zhao
LuoMo Volume & Price Structure 8.98 A multi-function chart indicator for   MetaTrader 4 and MetaTrader 5 , designed to display key volume, volatility, sentiment, and price-structure information directly on the main chart. Main Features Volume and price-based Support & Resistance Volume spike and exhaustion signals ATR volatility expansion alerts Volume Profile with HVN and LVN Bullish and bearish sentiment distribution Developing or fixed POC VAH and VAL levels Supply and Demand zones Volume-wei
필터:
리뷰 없음
리뷰 답변