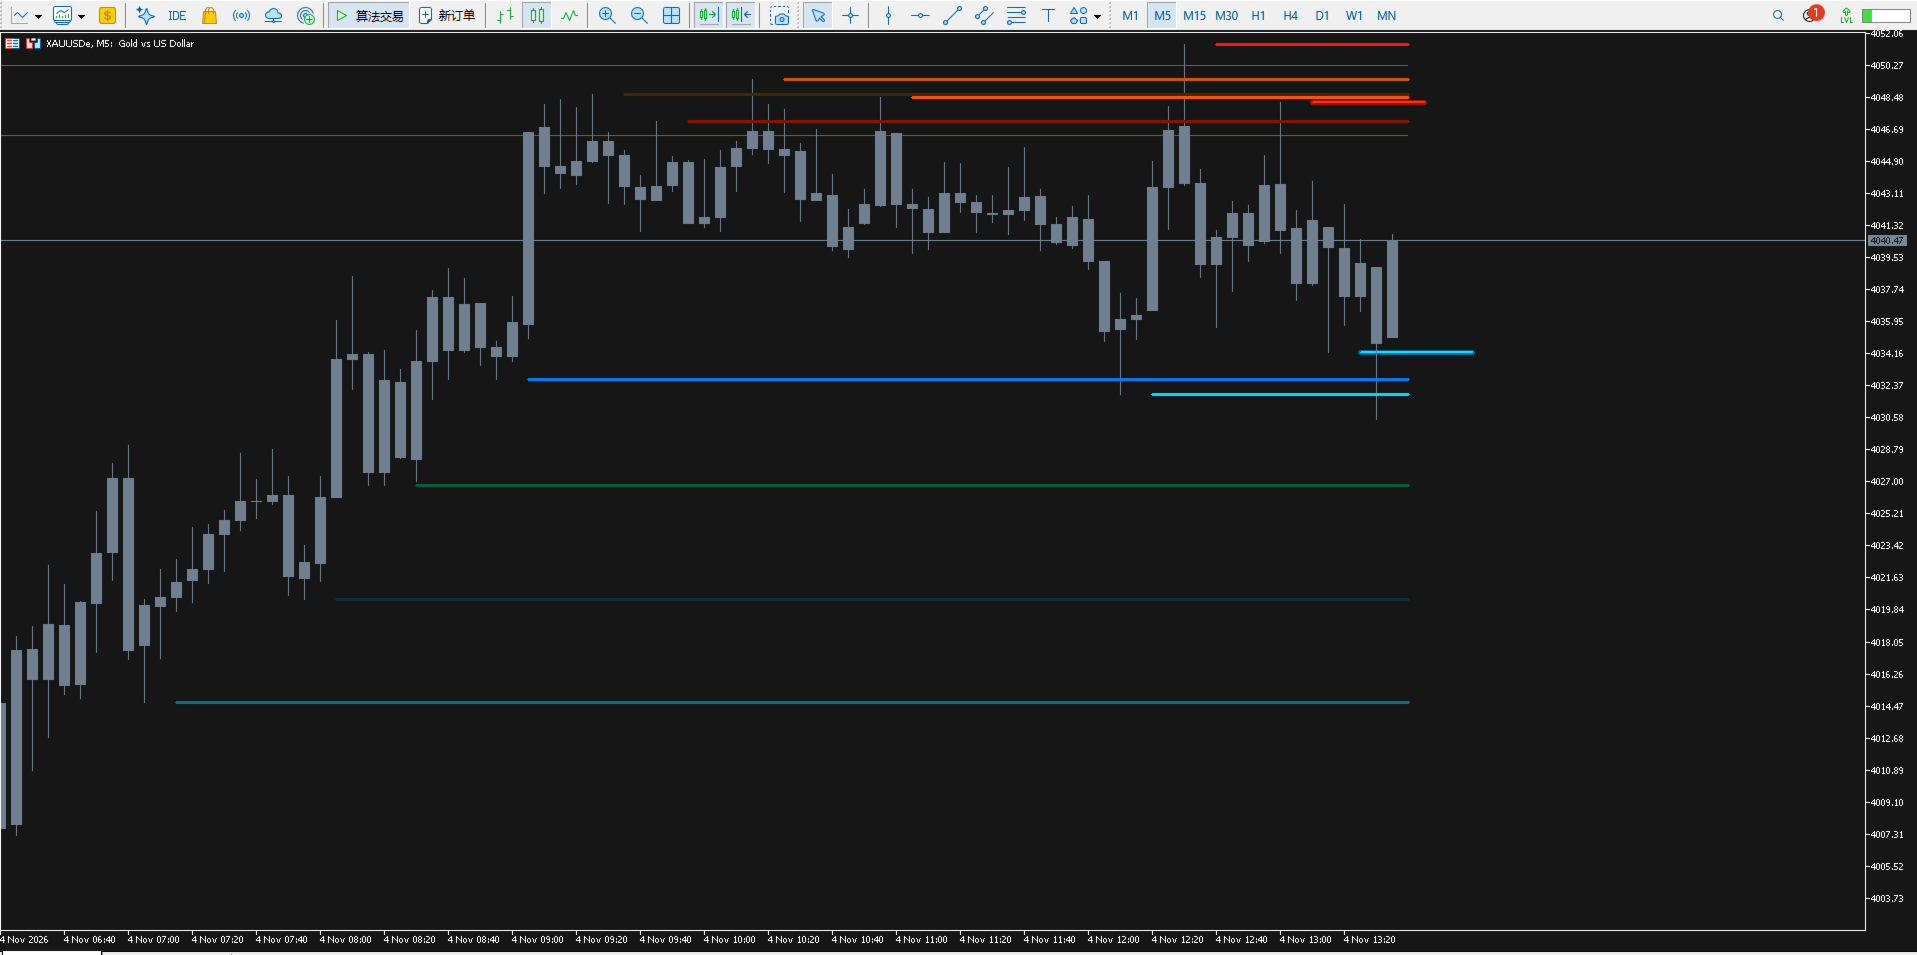
WZY Whale Fall Structure Map5
- Göstergeler
- Sürüm: 9.11
- Etkinleştirmeler: 5

WZY Whale Fall Structure Lines for MetaTrader 4
A clearer way to read the chart.
WZY Whale Fall Structure Lines is a visual market-structure companion for traders who want important price areas to stay visible without covering the chart with manual drawings or extra indicator panels. It brings a calm, organized layer of support and resistance context to the main chart, so you can spend more time reading price and less time maintaining annotations.
When the market moves quickly, attention becomes limited. WZY keeps the structure that matters in view. Recent areas stand out with vivid color gradients, established areas remain available as background context, and the overall chart stays clean enough for everyday analysis.
WHAT YOU GET
- A cleaner main-chart workspace: keep price, candles and structure in one focused view.
- Faster visual context: recognize where the market has reacted without scanning a crowded chart.
- Clear priority: newer active areas are easier to separate from older reference areas.
- A presentation that fits your style: use the built-in color moods or tune the look to your workspace.
- A companion for different workflows: use it with price action, swing analysis, breakout planning, trend review or multi-timeframe study.
- Less manual chart maintenance: keep your attention on the market instead of repeatedly drawing and updating levels.
MADE FOR TRADERS WHO
- prefer a visual chart over a dashboard full of separate signals;
- want support and resistance context to remain visible during active sessions;
- compare several symbols or timeframes and need a consistent chart language;
- use their own entry, exit and risk-management process.
HOW IT FITS YOUR WORKFLOW
Attach WZY to a price chart and let the structure map become part of your normal workspace. Use the visual hierarchy to frame the current market, compare fresh areas with established context, and then make decisions with your own analysis and risk rules.
PRODUCT POSITIONING
WZY is a chart-reading tool. It does not place trades, send orders or promise profitable results. It is designed to support independent analysis and to make the chart easier to read.