Blendlink Indicator

Build your own setup. See its win rate live.

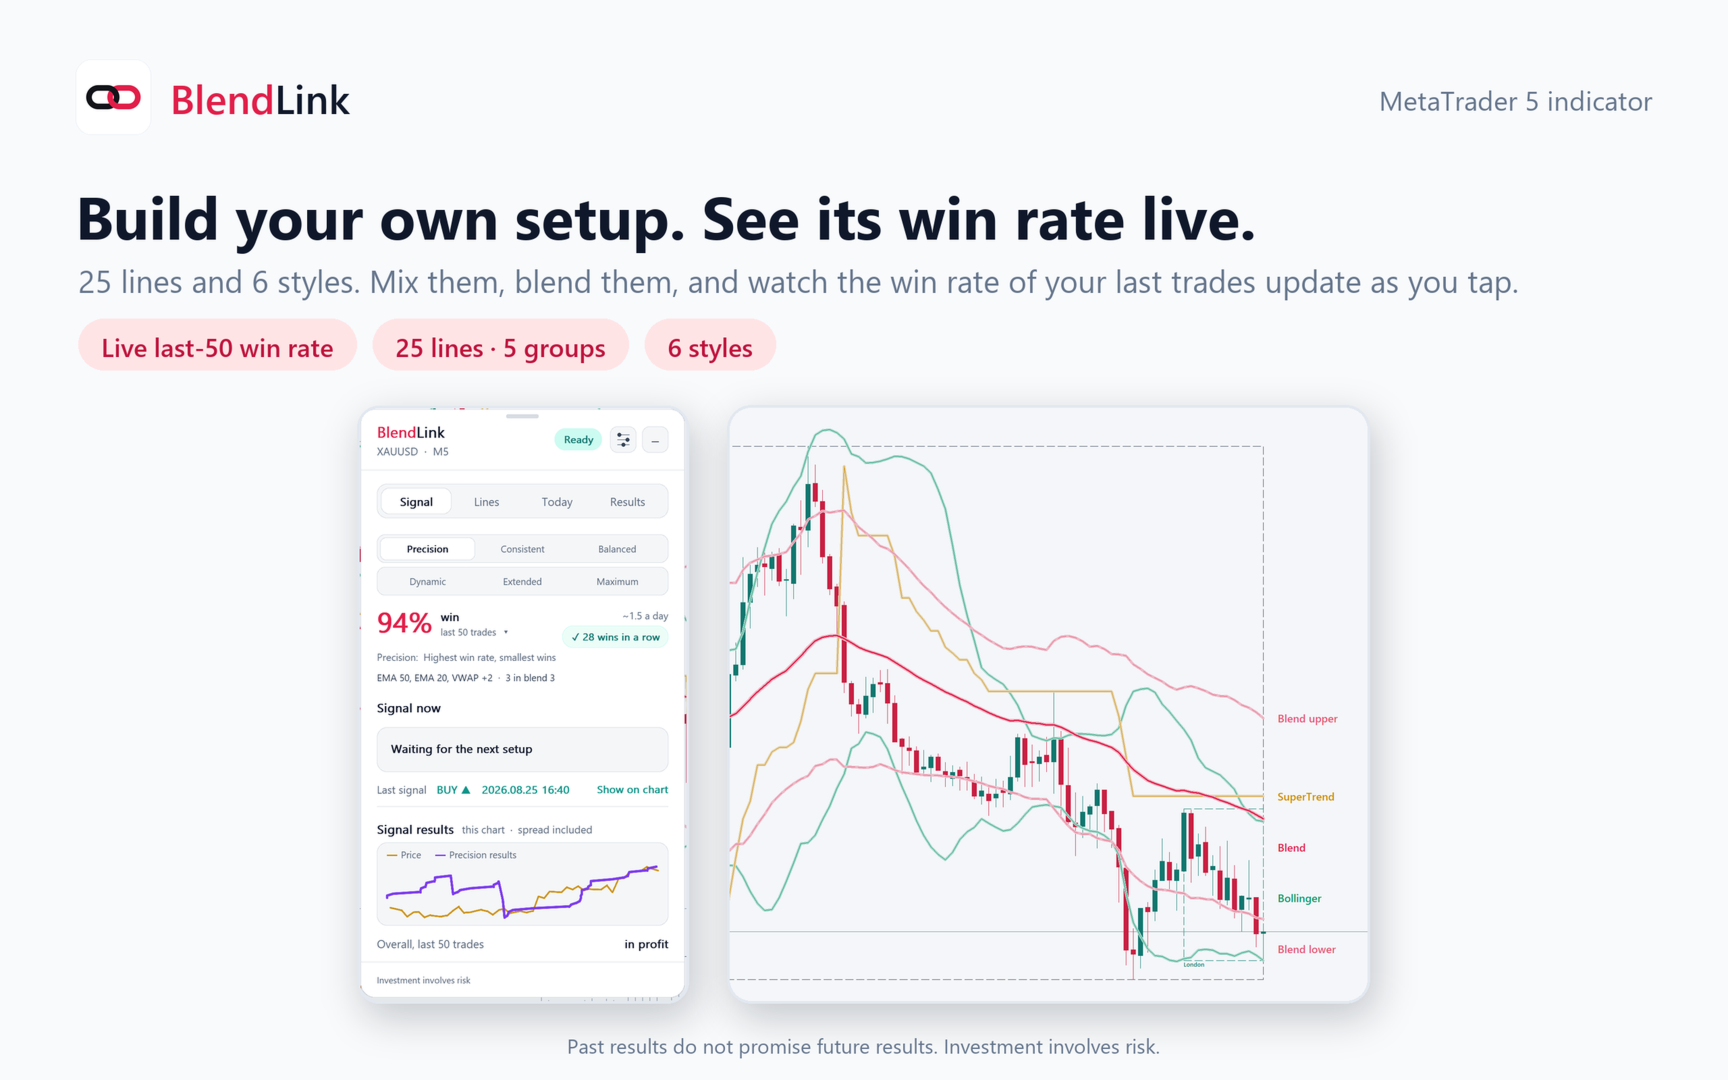
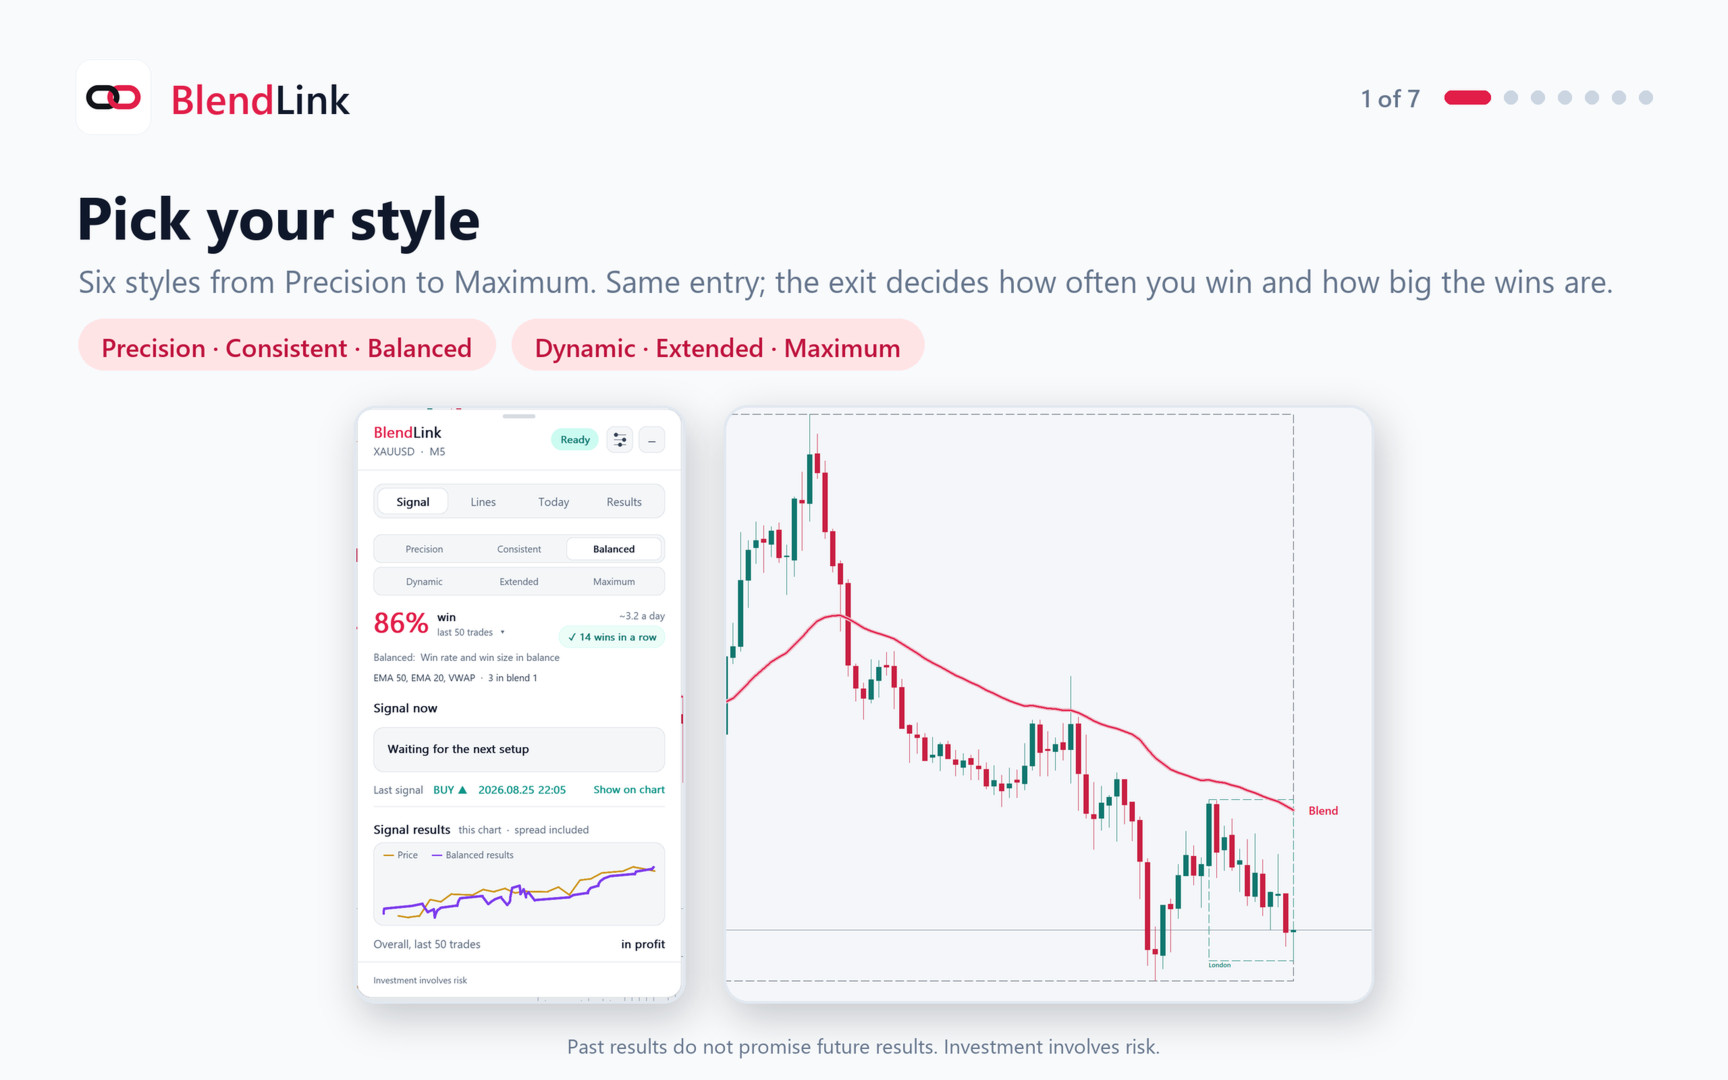
BlendLink is a MetaTrader 5 indicator that works like a playground. You tick the lines you trust, pick a style, and the panel tests your exact mix on your own chart, spread included. It shows the win rate of your last 50 trades and updates as you tap.

25 LINES IN 5 GROUPS
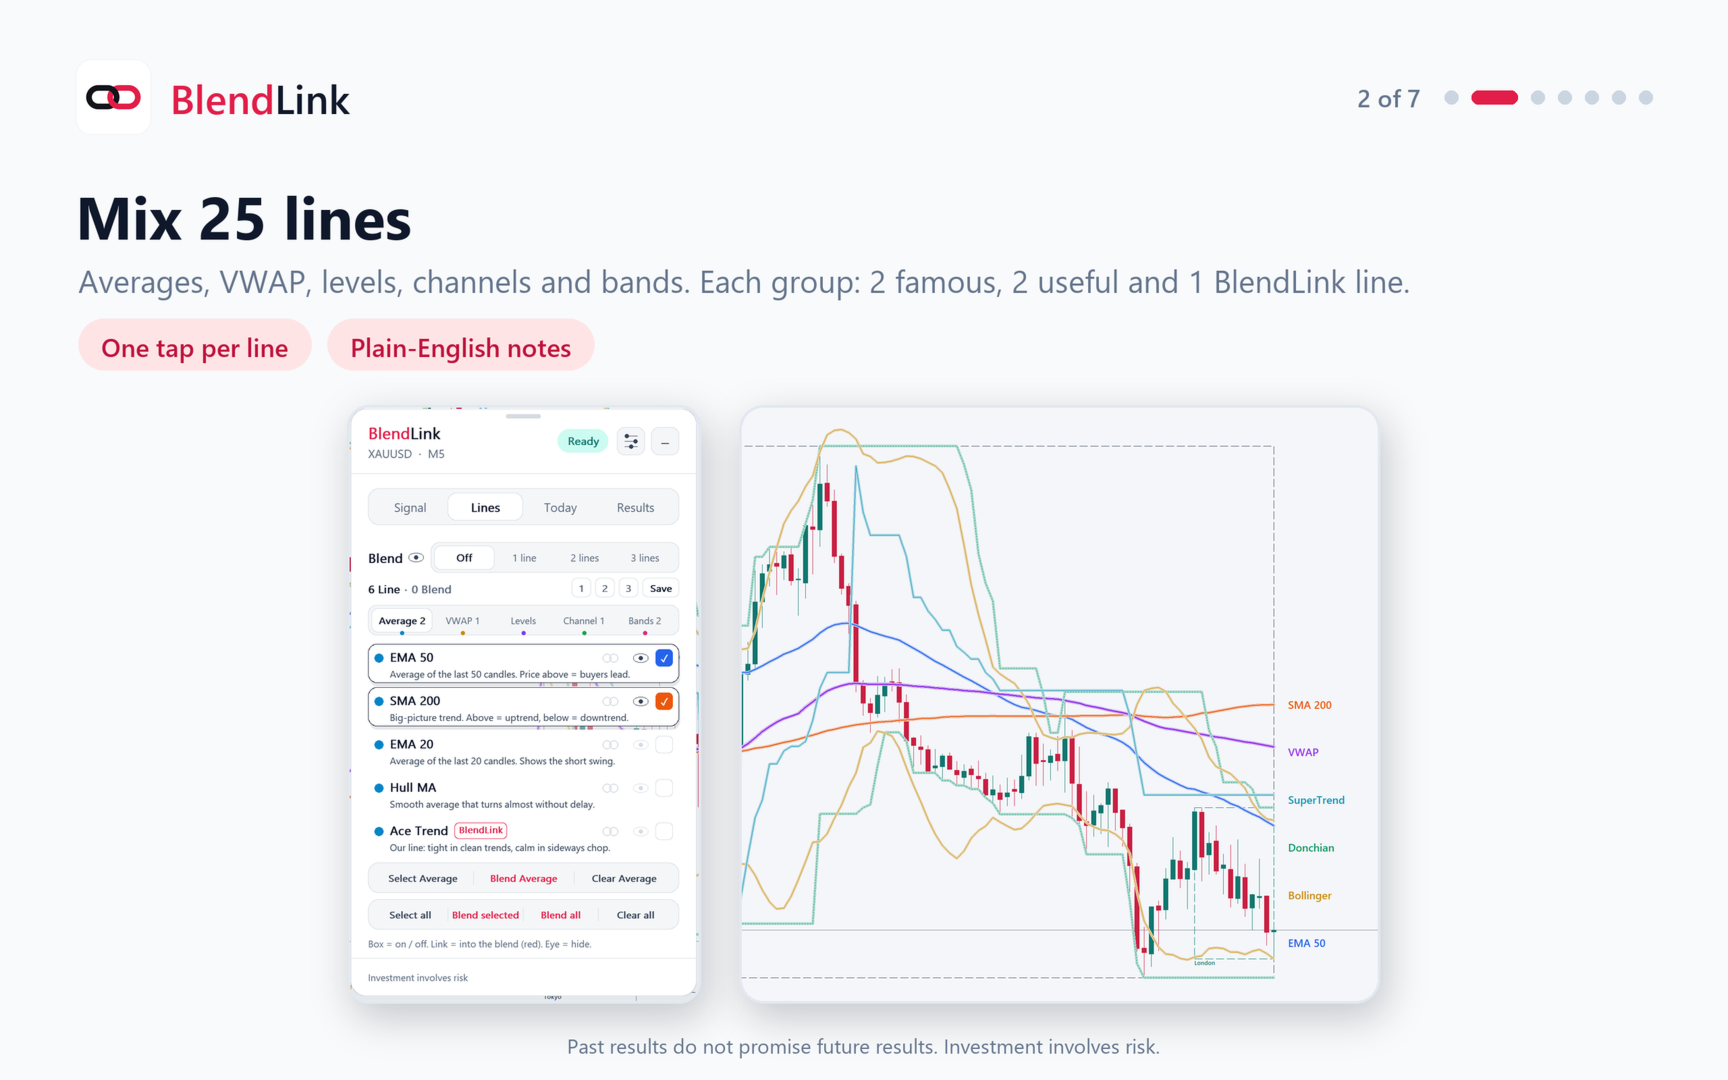
Average: EMA 50, SMA 200, EMA 20, Hull MA, Ace Trend.
VWAP: daily VWAP, anchored VWAP, VWMA, weekly VWAP, Ace Value.
Levels: pivot points, previous day high and low, round numbers, daily open, Ace Levels (Asia session range).
Channel: Donchian, Keltner, linear regression, Ichimoku cloud, Ace Channel.
Bands: Bollinger, SuperTrend, Chandelier Exit, Parabolic SAR, Ace Bands.
Each group has 2 famous lines, 2 useful lines and 1 BlendLink line. Every line comes with a one-line plain explanation.

LINE OR BLEND, YOUR CALL
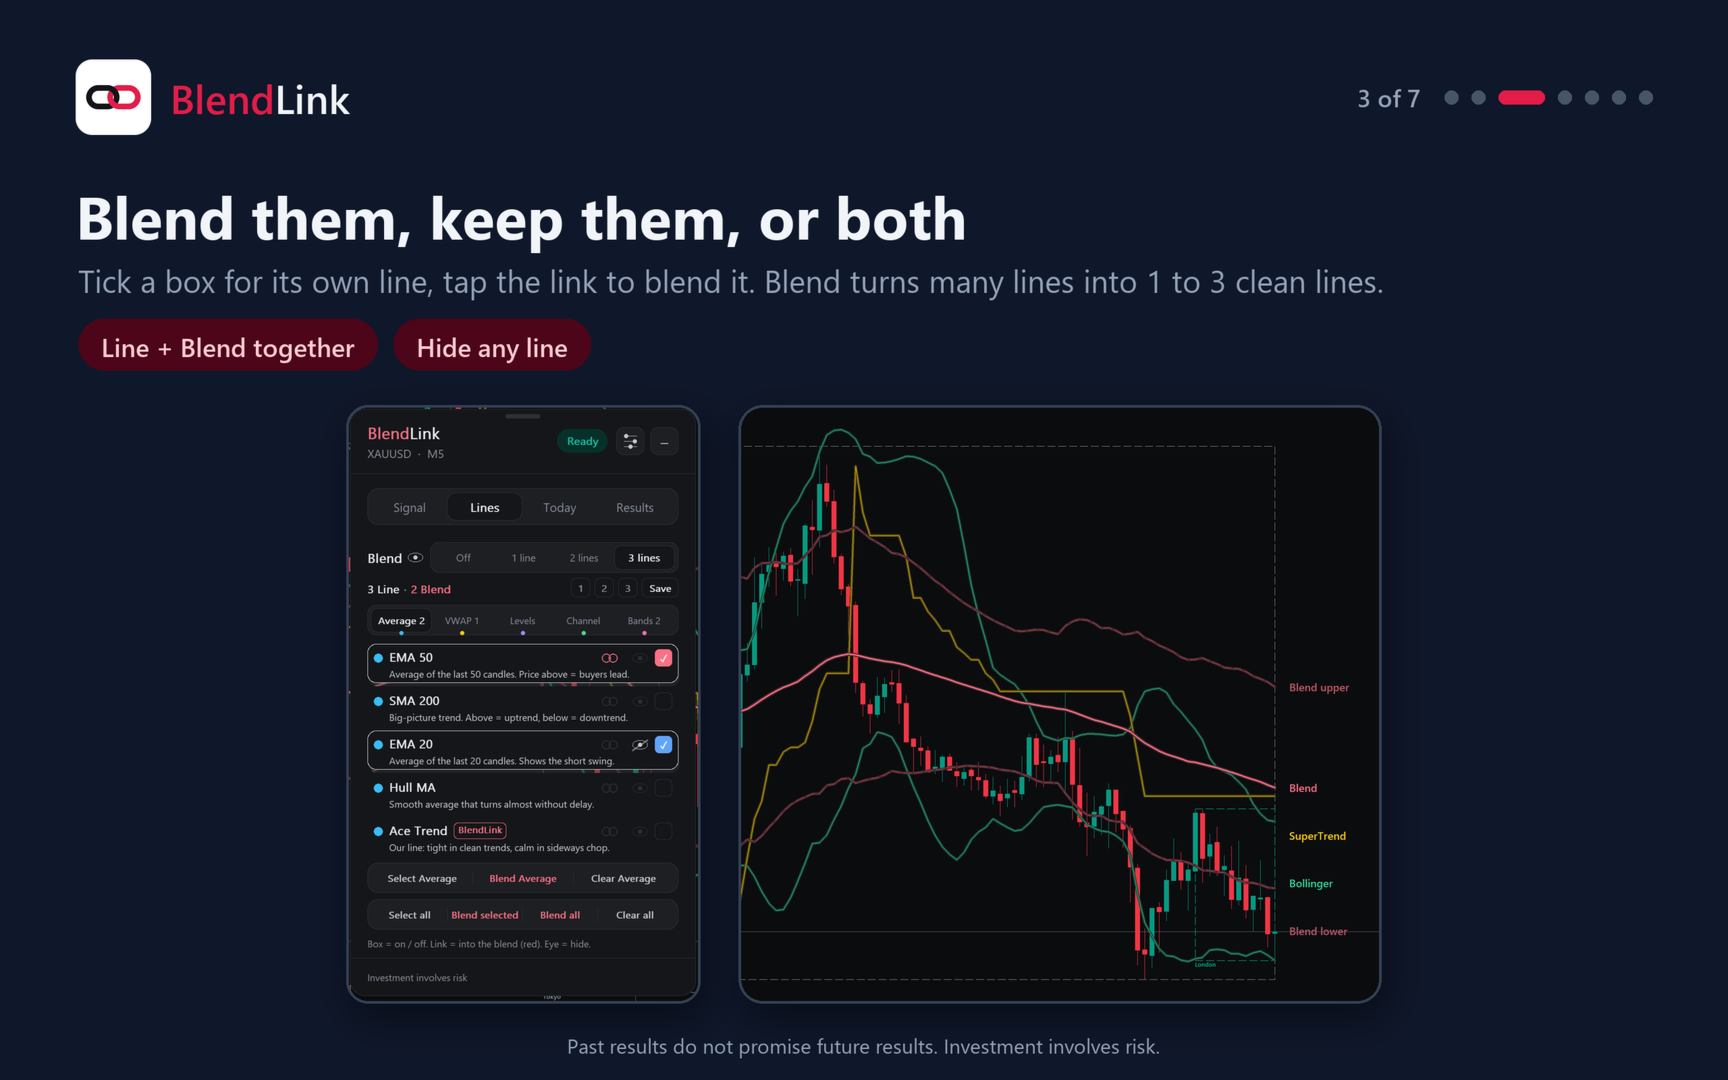
Tap a box and the line works on its own: it is drawn and filters the signals. Tap its link and it goes red: it joins the blend. BlendLink turns any number of blended lines into 1, 2 or 3 clean lines (center, upper, lower), or Off. Mix both kinds on one chart. The eye hides a line from the chart while it keeps working; the eye next to Blend shows only the blend lines.

New here? Start from one of 4 textbook examples (Classic, VWAP, Levels, Channel). One tap, then make it yours. They are examples, not advice.

6 STYLES
Precision, Consistent, Balanced, Dynamic, Extended, Maximum. All six use the same entry. The style sets the exit: Precision takes small wins often, Maximum aims for the biggest wins.

WHAT YOU GET
- Buy and sell signals with Entry, Take Profit and Stop Loss on the chart. No repaint.
- Live win rate of the last 10, 20, 50, 100 or all trades, a "wins in a row" badge and a results graph.
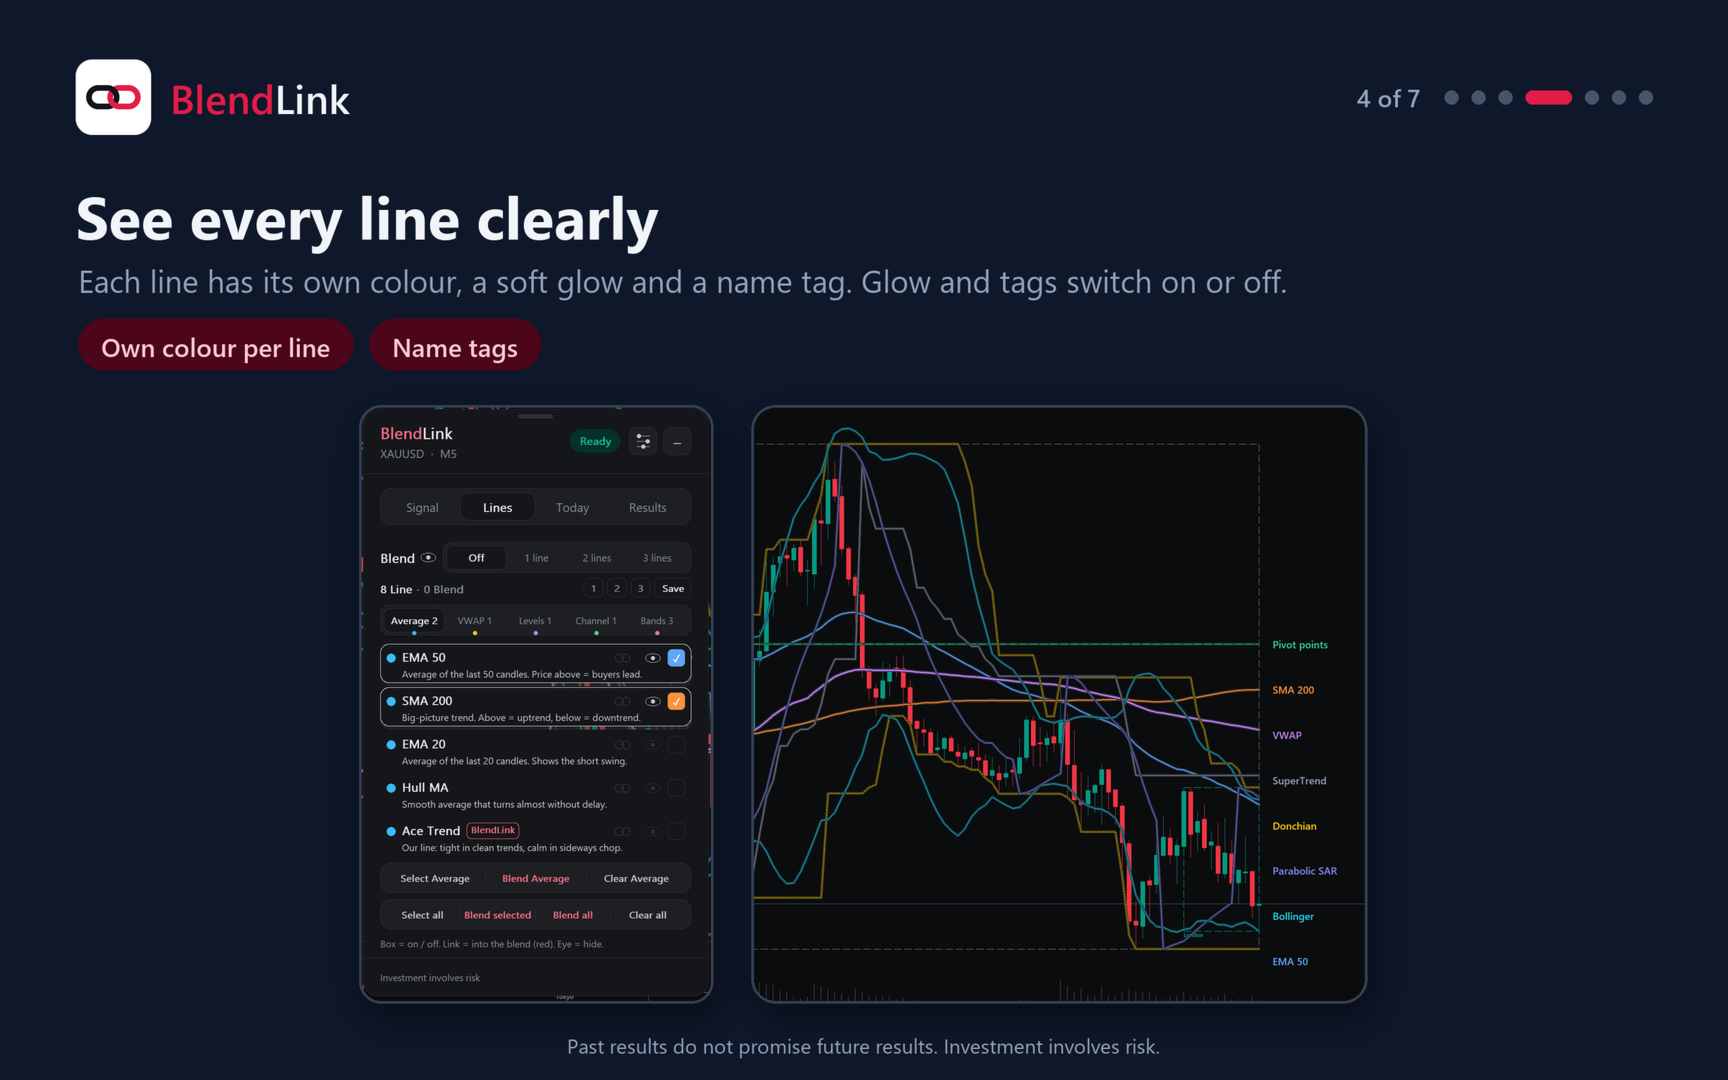
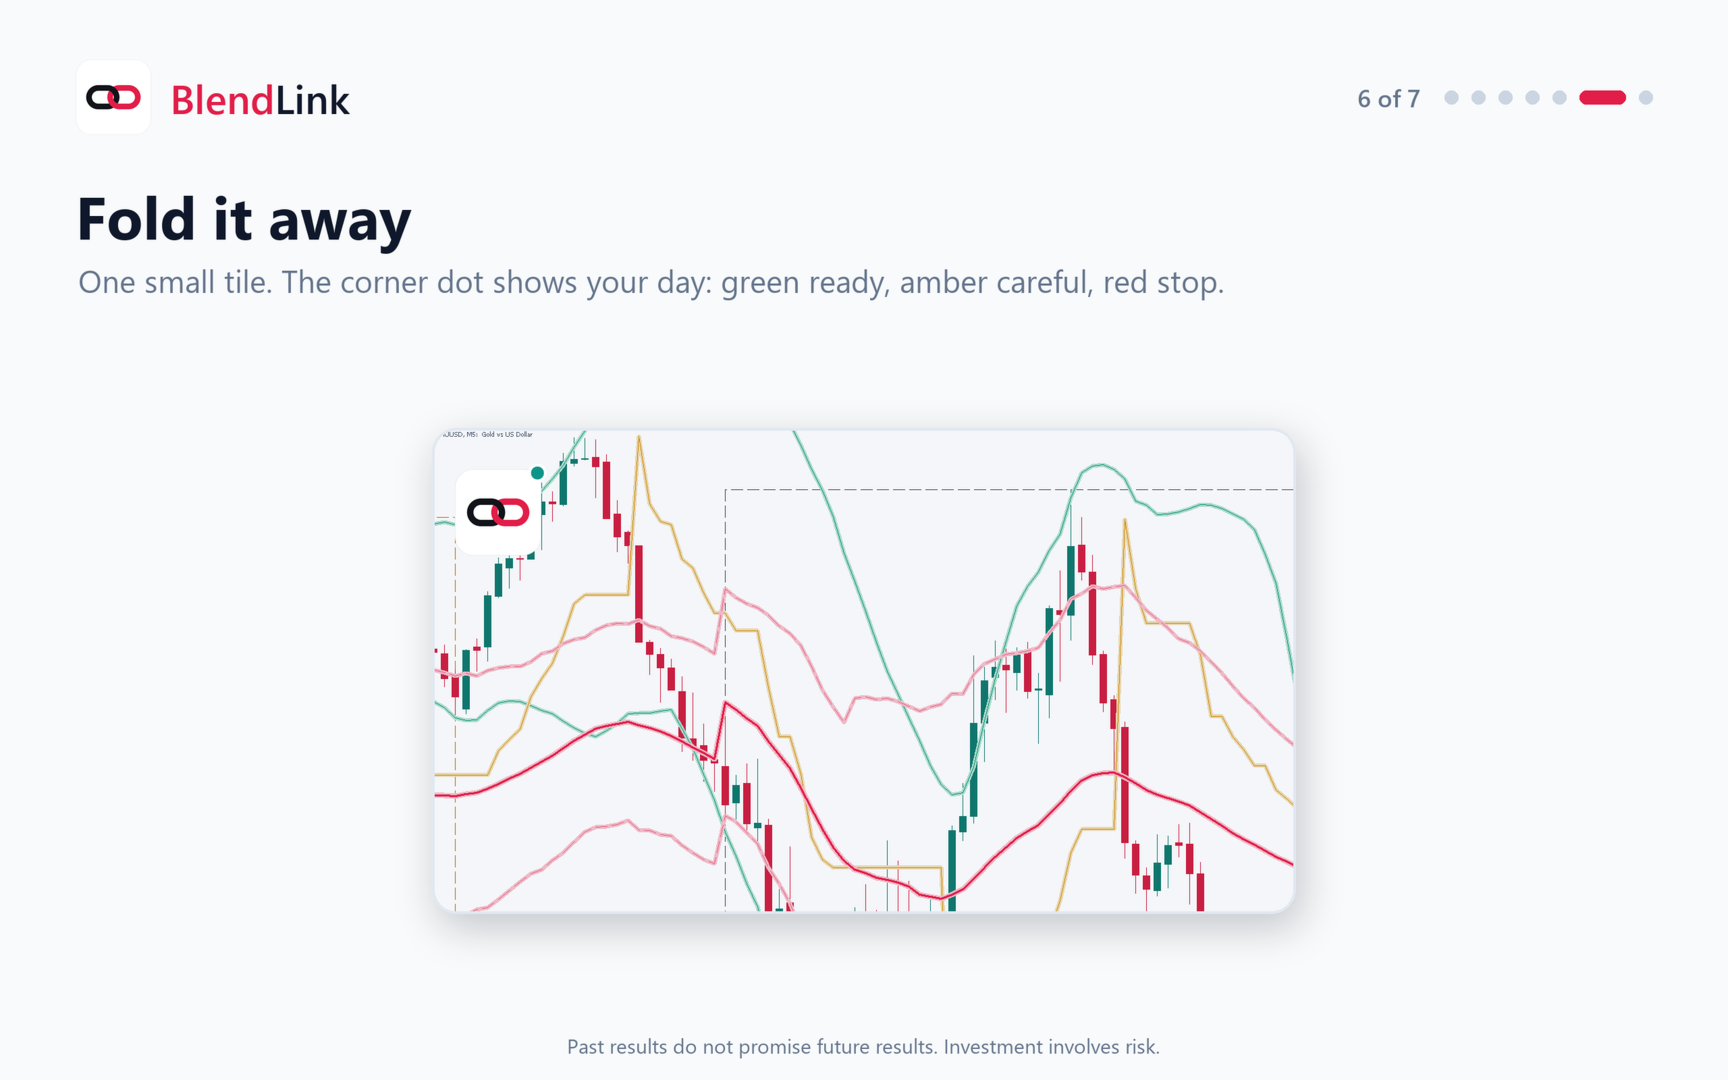
- Every line in its own color, with a soft glow and a name tag. Glow and tags switch off in Settings.
- My setups: save 3 mixes and load one with a tap. New charts open with your last setup.
- 4 textbook examples to start from: Classic, VWAP, Levels, Channel.
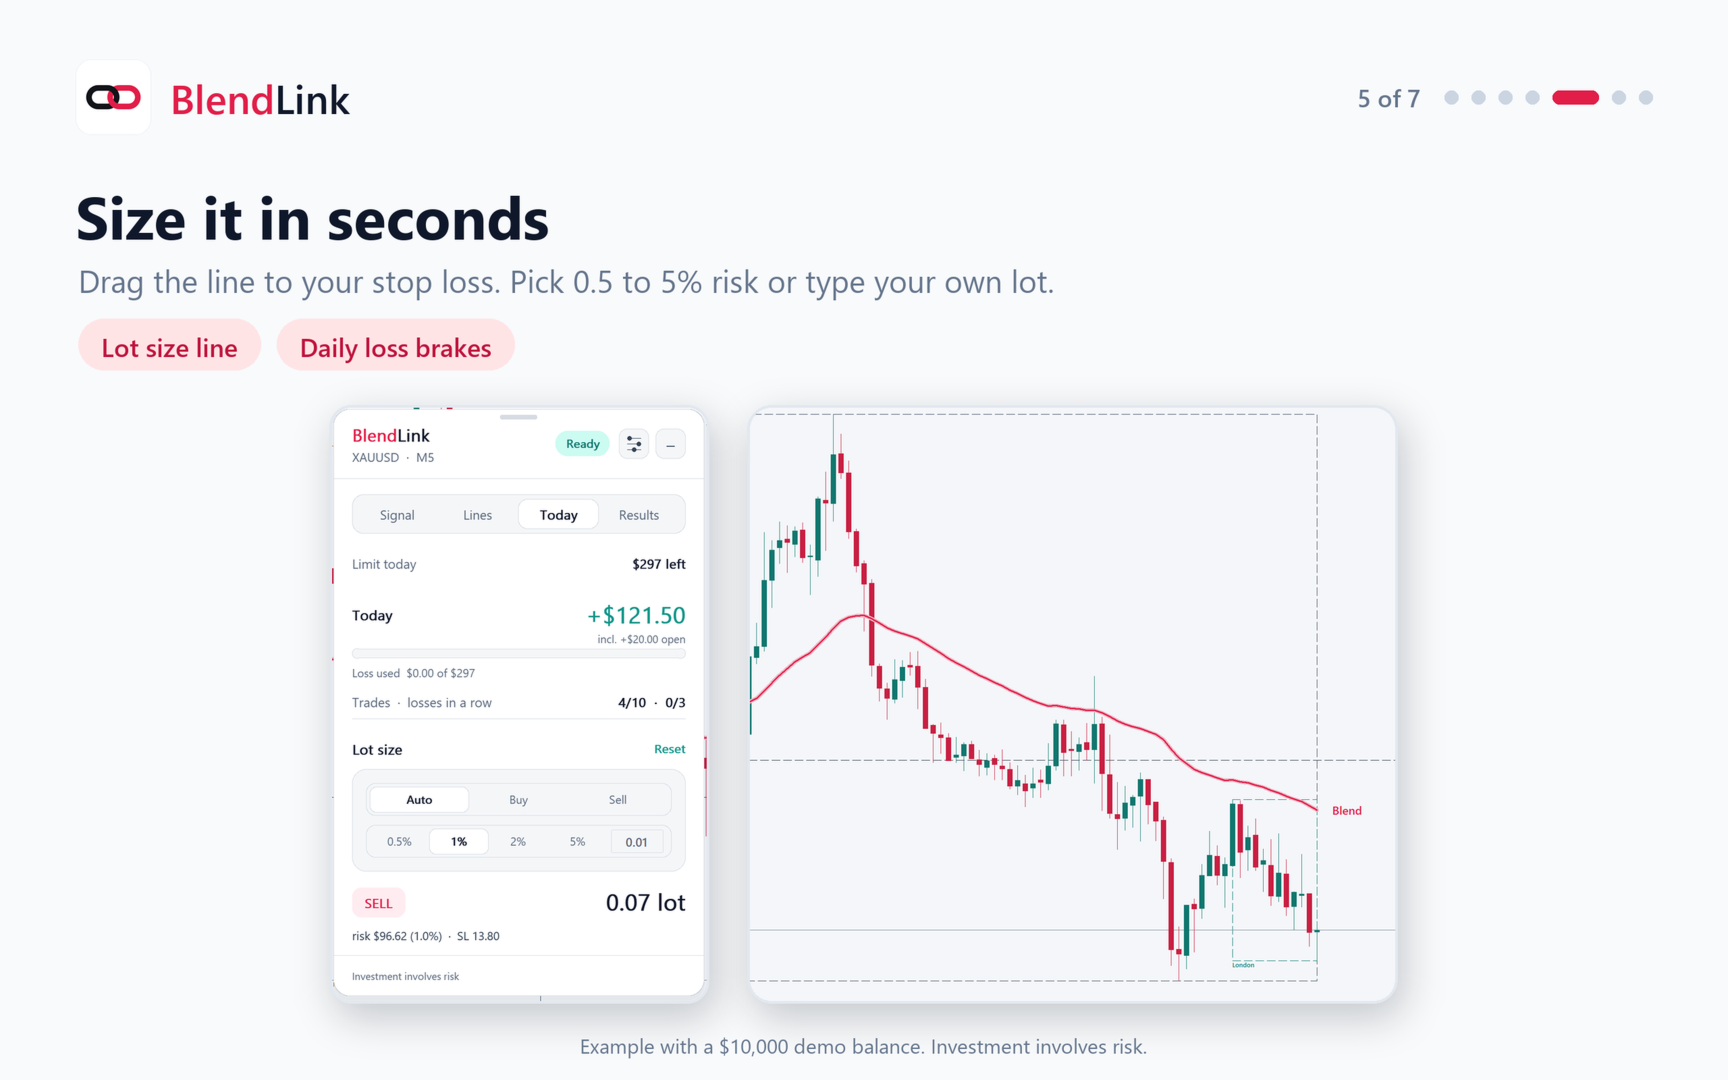
- Lot calculator: drag the line to your stop loss, pick 0.5, 1, 2 or 5% risk or type your own lot.
- Daily brakes: a daily loss limit, max trades per day and a break after losses in a row.
- Alerts: sound, popup or a push to your phone.
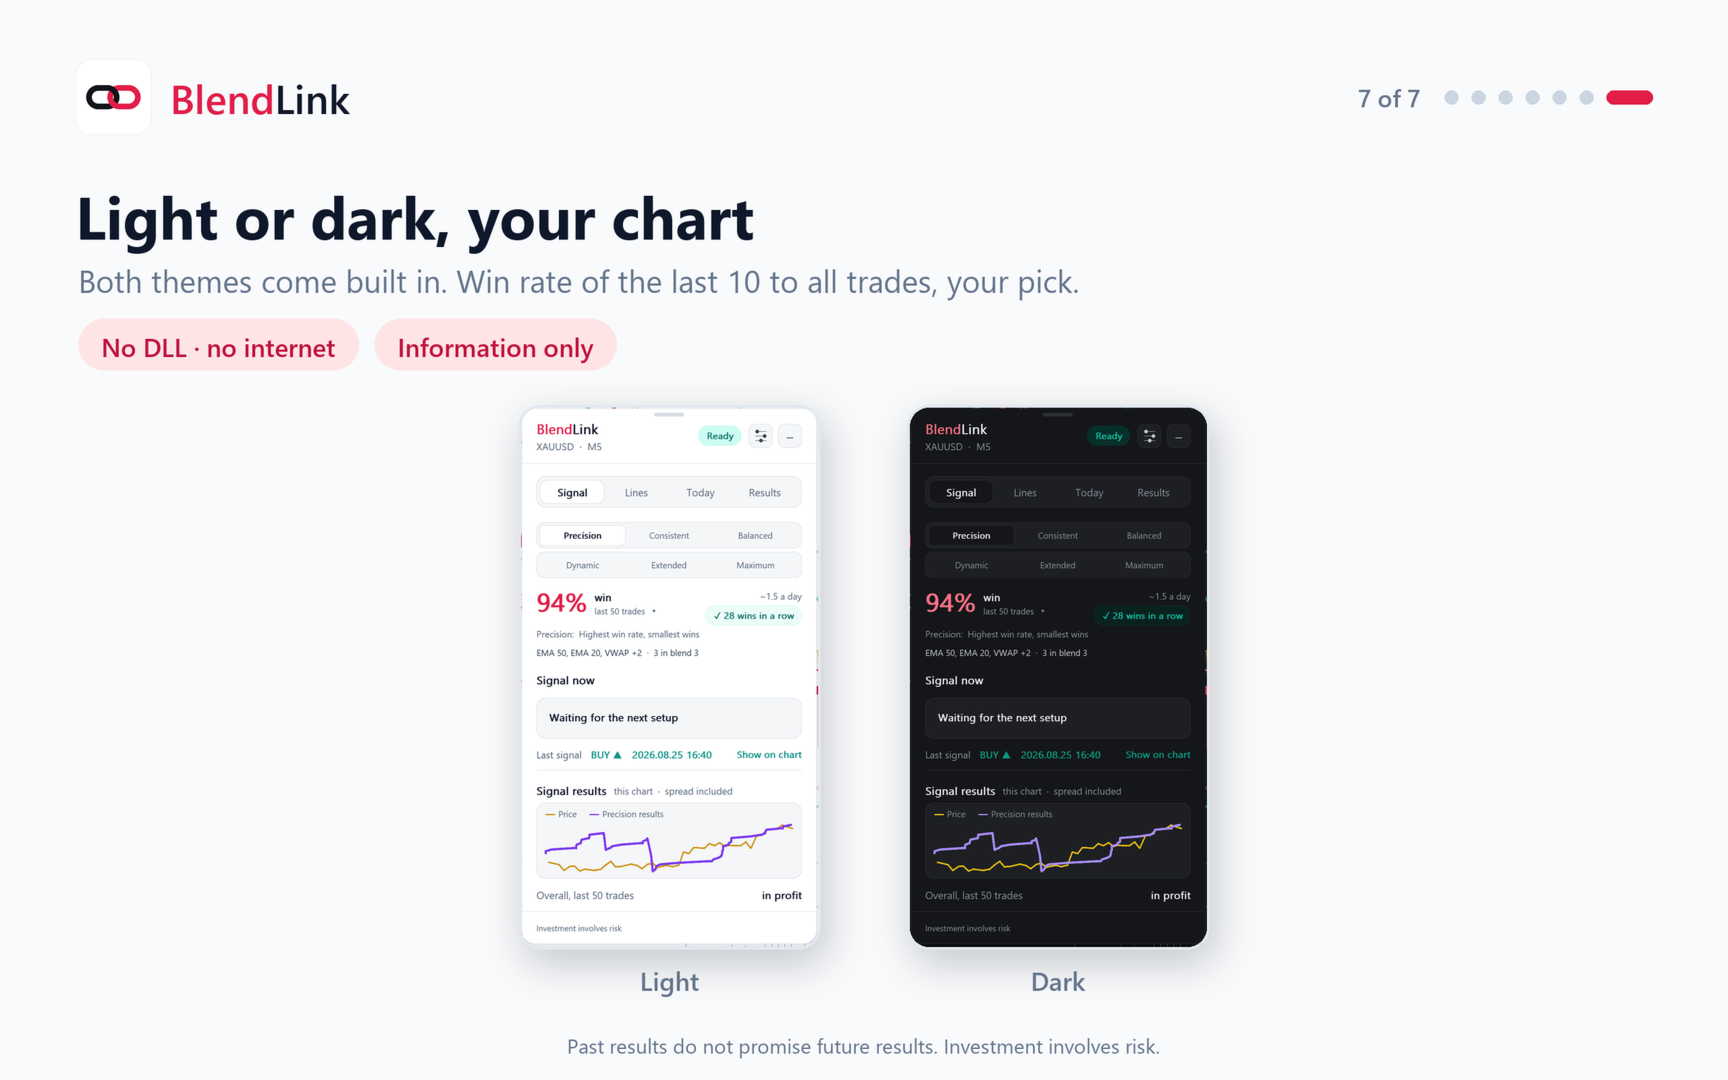
- Any timeframe from M1 to D1, any market. Light and dark themes. No DLL, no internet needed.
- 1,500+ automated checks passed on 5 markets and 6 timeframes, every tap under 0.3 s.

IN THE DOWNLOAD
- BlendLink.ex5 (MetaTrader 5)
- User guide PDF, English and Thai
- Free updates for life: new lines join the panel, your saved setups stay.

INSTALL IN 1 MINUTE
1. In MT5: File > Open Data Folder > MQL5 > Indicators. Paste BlendLink.ex5 there.
2. Restart MT5, or right-click Indicators in the Navigator and press Refresh.
3. Drag BlendLink onto a chart.
4. Keep Tools > Options > Charts > Max bars in chart at 100000 (the MT5 default). BlendLink tests on its own M5 history.

ACTIVATION (one MT5 account per purchase)
The panel shows your MT5 account number. Send it to us and you get your license key within 24 hours. Paste the key in Inputs > License key and BlendLink runs on that account.

BlendLink shows information. It never opens, changes or closes a trade.
Win rate counts wins, not their size. Past results do not promise future results. Investment involves risk.
추천 제품
MarketMagnet
Kelly Adediran Raymond
Are you ready to take your trading journey to new heights? Look no further than MarketMagnet, this groundbreaking indicator designed to propel your trading success with excitement and accuracy. Powered by the convergence of Momentum and CCI (Commodity Channel Index), MarketMagnet equips traders with the ultimate tool to determine direction and entry prices for a wide range of recommended currency pairs and instruments. It is designed for traders seeking to scalp for a few pips on lower timeframe
Manyal trading system, CovEchoTrend Robot, focuses on reliability and flexibility. By employing statistical analysis methods to study the relationships between the base indicator and market patterns, the system enables a deeper understanding of market processes. Intelligent pattern analysis: The application of statistical data processing helps identify key trend reversal points more accurately, signaling significant market shifts. Informed decision-making is based on the intersection of indicato
Caicai L&S Yield Histogram Important Notice: This indicator is an integral tool of the automated EA Caicai Long and Short Pair Trading . This indicator visually displays the percentage deviation (Yield %) of a pair's current spread relative to its own historical mean. It is an excellent tool for quickly visualizing the gross financial potential of a market distortion in Long & Short operations. Main Features: Percentage Visualization: Understand the size of the distortion in palpable percentage
CyberTrade Matrix: Multi-Timeframe S&R Spectrum Institutional-Grade Multi-TF Trend Matrix & Dynamic Support/Resistance Shields for MT5 CyberTrade Matrix is a premium, high-performance technical indicator engineered for professional traders who require a bird's-eye view of market structures across multiple horizons simultaneously. Powered by a optimized multi-timeframe engine, this indicator combines an Institutional EMA Cross Matrix (14/26) with Dynamic Visual Support and Resistance Shields (H4/
SPECIAL LAUNCH OFFER: $30 (1-Month Rent) Limited time offer to build our community and gather feedback! AmbM GOLD Institutional Scalper A high-precision M5 algorithm for XAUUSD (Gold) , engineered to trade exclusively at Institutional Liquidity Levels ($5/$10 psychological marks). PERFORMANCE DATA (BUY ONLY) • Win Rate: 87.09%. • Safe Growth: +$4,113 profit on $10k (13.75% Max Drawdown). • Extreme Stress Test: Successfully generated +$22,997 in a 5-year stress test (2020-2026), proving
Movable VWAP Pro MT5
Sant Clear Ali Costa
Features Start point of VWAP movable. 7 types of VWAP calculation methods: close, open, high, low, average price, typical price and weighted close. 2 types of volume calculation: ticks or real volume. Thus, the indicator works in any market, for example: stocks, futures, forex, commodities, etc. Color, line style, and line width of the customizable VWAP. Label that show the current VWAP price. VWAP breakout alert that can be enabled or disabled. 2 types of methods to trigger the breakout alert:
Quant Volatility Bands
Leonardo Marins Cordeiro
Institutional Volatility Bands Pro MTF The Institutional Volatility Bands Pro MTF is a professional econometric indicator built for individual retail traders, institutional operators, prop firm traders, and quantitative analysts across all financial markets (Futures, Spot, and Options). Unlike traditional indicators (such as Bollinger Bands or ATR) that suffer from lag and continuous dynamic repainting, this tool utilizes advanced econometric models to project 100% static, zero-repaint horizon
CvdDeltaVolumes
Parasbhai N Patel
Delta + CVD & CVD Candles Order-flow indicator combining Delta (Ask–Bid), Cumulative Volume Delta (CVD), and a unique CVD-based synthetic candle system. Shows buy/sell pressure, volume aggressiveness, and momentum shifts with optional Delta histogram, CVD line, and CVD+Delta combined candles. Useful for scalping, intraday trading, divergence detection, and understanding buyer/seller dominance. Overview The Delta + CVD & CVD Candles Indicator combines multiple order-flow tools into one clean
RVE Echo Indicator MT5 — Rejection Velocity Echo RVE Echo Indicator is a custom MetaTrader 5 technical indicator designed to detect abnormal price rejection, sharp velocity changes, and possible reversal zones in the market. RVE stands for Rejection Velocity Echo . The indicator studies how strongly price moves compared to its recent rejection behavior, then highlights moments where the current price movement appears unusually aggressive. This can help traders identify possible exhaustion, rejec
Wick Exhaustion Tracker
Roberto Abreu De Lucena
On-Screen Backtest : Shows the real Win/Loss results and win rate directly on your chart ( 62.5% accurate under real tests). Ultra Lightweight : Specially optimized to run perfectly on computers with low RAM (like 4GB) or remote VPS servers without freezing your platform. Complete Dashboard : Includes a live candle countdown timer, trend detector, and a daily candle counter on the right side of your screen. Visual Aids : Tracks daily maximum and minimum lines automatically on your chart. Input
Introducing the Bollinger Flipper Indicator – Your Ultimate Trading Edge!   Are you tired of second-guessing your entries and exits? The Bollinger Flipper Indicator is here to flip the game in your favor.   Built with the power of Bollinger Bands + Level 3 Power System + ZigZag Fractals, this advanced tool is designed to spot high-probability buy & sell signals with precision. SPECIAL BONUS (VALID TILL JUNE 2026)- OUR DAILY SCALPER EA for BTCUSD and VIX75 •································
Market Projection Pro — MT5 Want to visualize how the price cycles in your chosen chart section could extend? Market Projection Pro analyzes a historical window you select, extracts cycle components and draws a composite projection to its right. You control the source window and forward horizon to compare the scenario with price structure and potential turning zones. What you see on the chart Interactive boundaries let you select a historical analysis window directly on the chart. Cycle componen
Currency RSI Scalper MT5
Evgeny Belyaev
5 (3)
Currency RSI Scalper MT5는 널리 사용되는 RSI(Relative Strength Index) 지표를 기반으로 하는 전문 지표입니다. RSI 지표는 시장의 간격에 대해 잘 작동하지만 시장 상황이 변할 때 수익성있는 신호를 생성하지 못하므로 큰 손실을 초래하는 잘못된 신호를 생성합니다. 시장 상황에 따라 적응하는 적응형 RSI 지표에 대해 생각해 본 적이 있습니까? 제시된 지표는 최고의 과매수 및 과매도 수준을 찾는 최적화 알고리즘을 구현합니다. 이를 통해 Currency RSI Scalper는 끊임없이 변화하는 시장에 적응할 수 있습니다. 매수 또는 매도 신호가 나타나면 차트에 화살표가 그려지고 경고가 발생하여 적시에 포지션을 열고 항상 PC에 앉아 있는 것을 피할 수 있습니다. Currency RSI Scalper는 통화(암호화폐 포함) 및 바이너리 옵션 거래에 적합합니다. Currency RSI Scalper를 선택하는 이유 지표는 스캘핑 및 일중 거래에 적
POWStrikeETH
Marius Ovidiu Sunzuiana
POWStrikeETH is the evolution of a proven quant‑grade breakout‑truth engine, rebuilt and optimized specifically for the Ethereum (ETHUSD) market. Derived from the original core architecture, POWStrike integrates enhanced volatility‑adaptive logic, ETH‑specific micro‑structure calibration, and refined trap‑detection algorithms that outperform any conventional retail indicator. Ethereum’s unique liquidity behavior, regime transitions, and breakout patterns required a dedicated optimization layer —
Fibonacci Trend Pro
Syamsurizal Dimjati
FIBONACCI TREND Pro Smart Market Structure + Multi-Timeframe SuperTrend Dashboard The   FiboSuper   indicator is an advanced trading system designed for MetaTrader 5 that blends three core methodologies of technical analysis:   Trend Following (EMA & SuperTrend) ,   Market Structure (ZigZag & Auto-Fibonacci) , and   Multi-Timeframe Confluence (Live Dashboard) . 1. On-Chart Components SuperTrend Line (Blue / Orange Dots): Blue Dots (Up Trend):   Indicates a   Bullish   market environment. Focus s
거래량 프로파일 멀티모드: 지표 방식이 아닌, 원하는 방식으로 거래량을 분석하세요. 대부분의 거래량 프로파일 지표는 거래자들이 미리 정해진 분석 범위 안에 갇히도록 만듭니다. 하지만 시장은 고정된 틀 안에서 움직이지 않는데, 분석까지 그럴 필요가 있을까요? 볼륨 프로파일 멀티 모드는 거래량 분석 시점, 장소, 방법을 완전히 자유롭게 결정할 수 있도록 해줍니다. 시장 구조 분석, 거래 세션 프로파일링, 더 높은 시간대의 활동 모니터링, 또는 진행 중인 경매 추적 등 어떤 목적이든 이 지표는 사용자의 거래 스타일에 맞춰 조정되므로 사용자가 거래 스타일에 맞춰야 할 필요가 없습니다. 직관적인 워크플로우를 원하는 초보자와 유연성을 요구하는 전문가를 위해 설계된 Volume Profile Multi-Mode는 네 가지 강력한 프로파일링 방법을 하나의 고도로 상호작용적이고 맞춤 설정 가능한 거래 도구로 결합합니다. 4가지 강력한 프로파일링 모드 1.       플렉서블 박스 : 대시보드에서 토
Balance Aggression
Edson Cavalca Junior
The indicator measures the balance of aggression. The formula is as follows:   Aggression  = Purchase Volume - Sales Volume. Note : It is rec ommended to use the default configuration and VPS values. It does not work in Forex. Meet Our Products     Parameters : Numbers of days prior to the current one for calculation; Volume Divider e; Enables calculation of the current candle; Histogram Line style and; Size; Line Line style and; Size;  Follow us on our website to check the next news.
Crash 1000 Scalping Indicator for the Crash 1000 Deriv Synthetic Index. Introduction The Crash 1000 Scalping Indicator is a specialized tool designed for the Crash 1000 index on the Deriv Synthetic market. This indicator is particularly useful for scalping on the M1 timeframe, helping traders to identify precise entry and exit points for buy positions. It is designed to be non-repainting, providing clear signals with audible alerts and push notifications, and is compatible with mobile devices th
Launch Pad GOLD Pro Indicator
Zenzo Phathisani Mtungwa
Korean Launch Pad GOLD Indicator v1.7 Launch Pad GOLD Indicator는 MetaTrader 5용 멀티 타임프레임 기술 분석 도구입니다. 이 지표는 EMA 기반 시장 구조 분석과 함께 모멘텀 모니터링, 추세 정렬 도구 및 설정 가능한 필터 기능을 사용합니다. 시스템은 여러 시간대 차트 분석을 지원하도록 설계되었습니다. 기능 EMA 추세 분석 지표는 EMA 계산을 사용하여 추세 구조와 방향성을 표시합니다. 포함 기능: 매수 및 매도 신호 표시 EMA 교차 모니터링 추세 반전 표시 모멘텀 활동 관찰 멀티 타임프레임 분석 시스템에는 설정 가능한 상위 타임프레임 정렬 도구가 포함됩니다. 사용 가능한 기능: 상위 타임프레임 확인 멀티 타임프레임 추세 정렬 설정 가능한 시간대 선택 방향성 편향 모니터링 신호 강도 표시 신호는 내부 점수 모델을 사용하여 평가됩니다. 포함 도구: 신호 강도 점수 별 기반 분류 실시간 업데이트 시장 필터 시장 조건 선택
Master HMA
Leonel Alberto Jose Quintana
MetaTrader 5용 Master HMA Master HMA는 MetaTrader 5용 기술적 지표로, 다양한 Hull Moving Average 계산을 하나의 시각적 구조로 결합하여 가격 움직임의 방향, 기울기 및 행동을 분석할 수 있도록 설계되었습니다. 이 지표는 Fast, Main, Slow의 세 가지 HMA 기간을 사용합니다. 이 선들 사이의 관계를 통해 움직임 구조의 변화를 관찰하고 시장의 다양한 국면을 추적할 수 있습니다. Main HMA는 시스템이 식별한 상태에 따라 다양한 색상으로 표시됩니다. 또한 Fast HMA와 Slow HMA의 관계를 기반으로 형성되는 클라우드를 표시할 수 있습니다. 구조 분석 Master HMA는 이동평균선의 다양한 행동 특성을 분석합니다. 여기에는 기울기, HMA 간 거리, 수축, 확장, 가속, 힘의 약화 및 클라우드 폭의 변화가 포함됩니다. 이러한 정보는 종합되어 현재 움직임 구조를 시각적으로 파악할 수 있도록 합니다. Master Sc
Max Min Delta Indicator - Market Volume Imbalance Analysis Gain Deeper Insights into Market Volume Imbalance with Delta Analysis What is the Max Min Delta Indicator? The Max Min Delta Indicator is a powerful market volume analysis tool that visually represents maximum and minimum delta values using a histogram. It helps traders identify market strength, weakness, absorption, and aggressive buying/selling activity with precision. Key Features Histogram Visualization: Displays Max Delta (Green) an
Apex Market Structure is a complete Smart Money toolkit that maps market   structure, order blocks, liquidity and multi-timeframe trend in real time,   directly on your chart. It is built for traders who read price action the   way institutions do: structure breaks, liquidity sweeps, and reaction zones,   all detected automatically and confirmed at bar close.   Everything is drawn for you. No manual line drawing, no guesswork, no second   indicator needed.   How It Works   The indicator con
The Louis SMC & Liquidity Master is a complete, institutional-grade market structure and liquidity mapping system built for MetaTrader 5. Designed for serious Smart Money Concepts (SMC) traders, this tool dynamically tracks multi-timeframe trends, supply and demand zones, and critical liquidity sweeps without cluttering your chart. Whether you trade major Forex currency pairs or highly volatile synthetic indices like Boom and Crash, the indicator automatically adapts to price action, filtering
SpreadMonitor Complete is a sophisticated MQL5 indicator designed to provide real-time and historical spread analysis between two user-selected currency pairs or instruments. This tool is invaluable for traders who need to closely monitor spread fluctuations, identify trading opportunities, and manage risk effectively. Key Features: Dual Symbol Monitoring: Track the spread between any two symbols you choose (e.g., GCJ26 and XAUUSD). Real-time Spread Display: See the current spread value updated
가격이 유동성을 탐색할 수 있는 위치 파악 Liquidity Reaction Map MT5는 확인된 가격 구조를 기반으로 잠재적인 매수측 및 매도측 유동성 영역을 식별하는 차트 기반 시장 분석 지표입니다. 스윙 포인트, 동일 고점과 동일 저점, 전일 및 전주 레벨, 세션 고점과 저점, 심리적 라운드 가격을 하나의 정리된 유동성 지도에 결합합니다. 서로 가까운 레벨은 하나로 병합할 수 있으며 강도, 현재 가격과의 거리, 여러 출처의 일치 정도에 따라 순위가 결정됩니다. 이 지표는 가격이 유동성 영역에 접근하거나, 해당 유동성을 스윕하거나, 거부되거나, 돌파할 수 있는 위치를 분석하는 데 도움을 줍니다. 거래를 개시하거나 관리하지 않습니다. 유동성 출처 유동성 지도는 다음 항목을 기반으로 유동성을 식별할 수 있습니다. 확인된 스윙 고점과 저점 동일 고점과 동일 저점 전일 고점과 저점 전주 고점과 저점 완료된 세션의 고점과 저점 심리적 라운드 가격 레벨 설정 가능한 여러 시간대 매수측 유
Delta Profile Volume
Teresinha Moraes Correia
기술 설명 – MetaTrader 5용 Delta Profile Delta Profile 은 MetaTrader 5에서 정의된 캔들 범위 내의 거래량 흐름을 세부적으로 분석하기 위해 설계된 지표입니다. 이 도구는 각 가격 수준에서 양의 거래량(상승과 관련) 과 음의 거래량(하락과 관련) 간의 불균형을 구조화하고 시각화합니다. 이를 통해 사용자는 실제로 거래가 집중되는 가격 영역과 시장 불균형이 형성되는 구간을 명확하게 파악할 수 있습니다. 핵심 개념 지표는 가격 레벨 을 인식하고 이를 양의 거래량, 음의 거래량 및 순 델타(양-음 차이)로 분류합니다. 각 가격 레벨은 수평 막대 로 차트에 표시되며, 거래가 집중되는 구간을 직관적으로 보여줍니다. 사용자는 분석할 캔들의 개수 , 가격 반올림 정밀도 , 최대 표시 레벨 수 , 표시 옵션 등을 직접 설정할 수 있습니다. 주요 기능 가격 레벨 매핑 : 사용자가 지정한 자릿수에 맞게 가격을 반올림하여 거래량을 집계합니다. 순 델타 계산 : 양
LevelSketch Color Levels Drawing Tool
Mohamed Qosyairy Bin Shamsuddin
LevelSketch Color Levels Drawing Tool LevelSketch Color Levels Drawing Tool 은 MetaTrader 5용 전문 수동 차트 마킹 인디케이터입니다. 차트에서 컬러 레벨, 지지선과 저항선 영역, 측정 도구를 빠르고 깔끔하게 표시하려는 트레이더를 위해 설계되었습니다. 주요 기능 5개의 사용자 지정 컬러 존 짧은 수평 지지 / 저항 구간 파란색 / 빨간색 측정 룰러 컴팩트한 온차트 툴바 내장 Color Settings 패널 18색 확장 컬러 팔레트 차트 오브젝트 숨기기 / 표시 마지막 오브젝트 실행 취소 모든 LevelSketch 오브젝트 삭제 접을 수 있는 툴바 수평 레벨 고정 기능 수평 레벨 최소 길이: 20개 봉 컬러 설정 Color Settings 패널에서 Z1, Z2, Z3, Z4, Z5, L-S, L-R, M-B, M-R 의 색상을 빠르게 변경할 수 있습니다. 사용 방법 컬러 존으로 중요한 가격 영역을 표시하고, L-S /
RelicusRoad Daily Pivots는 MetaTrader 4와 MetaTrader 5용 일간 피벗 포인트 지표로, 전일 범위를 Fibonacci 레벨로 나누고 마이너스 100퍼센트부터 플러스 200퍼센트까지 위아래로 연장합니다. 고전적인 floor pivot 대신, 직전에 완료된 범위를 저가가 0%, 고가가 100%인 척도로 다룹니다. 열아홉 개의 레벨이 차트 오른쪽 가장자리에 촘촘한 색상 마커로 표시되므로, 오늘 움직임의 크기를 전일 범위의 일부 또는 배수로 읽을 수 있습니다. 작동 방식 지표는 직전에 완료된 기준 기간의 고가와 저가를 가져와 그 범위의 각 비율마다 레벨을 배치합니다: level = low + ratio x (high - low). 주말 봉은 건너뛰므로 월요일의 기준은 마지막 거래일입니다. 기준 기간은 차트 시간대에서 정해집니다. 내부 구간, 회색: 0%, 23.6%, 38.2%, 50.0%, 61.8%, 78.6%, 100%. 상단 구간, 초록: +123
FREE
Range Filtered AlgoAlpha는 시장 변동성을 분석하여 잠재적인 거래 기회를 식별하도록 설계된 기술 분석 도구입니다. AlgoAlpha의 원래 TradingView 지표를 MetaTrader에 적용한 이 버전은 여러 분석 방법을 결합하여 시각적인 시장 평가를 제공합니다. 기술적 특징 가격 평활화를 위한 칼만 필터링(Kalman Filtering) 적용 변동성 측정을 위한 ATR 기반 밴드(ATR-based Bands) 통합 추세 분석을 위한 슈퍼트렌드(Supertrend) 요소 포함 색상 캔들(Candles) 및 마커(Markers)를 통한 시각적 신호 제공 구성 가능한 알림 옵션(Configurable Alerts) 제공 기능 이 지표는 시장 데이터를 처리하여 다음을 수행합니다: ATR(평균 실제 범위)을 사용한 변동성 범위 계산 시장 노이즈 감소를 위한 필터링 기술(Filtering Techniques) 적용 시각적 요소(Visual Elements)를 통한 잠재적
VWAP Analytics Advanced Suite for MetaTrader 5 Gain institutional-grade market insight with the VWAP Analytics Advanced Suite , a professional Volume Weighted Average Price indicator built exclusively for MetaTrader 5. This tool goes beyond a simple VWAP line; it is a complete analytical ecosystem designed to identify trend bias, measure market deviation, and provide high-probability entry and exit signals with precision timing. Whether you are a day trader, scalper, or swing trader, this su
이 제품의 구매자들이 또한 구매함
Trend Sniper X
Sarvarbek Abduvoxobov
4.9 (41)
Trend Sniper X 는 트레이더가 추세 방향과 잠재적 반전 지점을 명확하고 정확하게 포착할 수 있도록 도와주는 MetaTrader 5용 멀티 타임프레임 추세 추종 지표입니다. MT4용: https://www.mql5.com/en/market/product/193245 가격 정보: 현재 가격은 프로모션 할인가이며, 향후 업데이트 및 새로운 기능이 출시됨에 따라 변동될 수 있습니다. 보너스 혜택: 본 지표 전용 무료 자동매매 Assistant EA를 받으시려면 구매 후 작성자에게 메시지를 보내주시기 바랍니다. Code2Profit 채널 멀티 타임프레임 분석으로 시장을 마스터하세요! Trend Sniper X로 승률을 극대화하는 방법: 핵심 규칙 및 세션 팁 기술 사양 플랫폼 MetaTrader 5 지표 유형 멀티 타임프레임 추세 지표 운용 타임프레임 모든 차트 타임프레임 지원, 독립적으로 선택 가능한 상위 타임프레임(M1–MN1) 주요 상품 외환, 금(XAUUSD) 및 기타 C
Smart Trend Trading System — MetaTrader 5 구매 후 MQL5에서 저에게 메시지를 보내시면 Smart Universal Expert Advisor를 무료로 받으실 수 있으며, 온라인 강좌, PDF 매뉴얼 및 비공개 그룹 이용 권한도 함께 제공됩니다. STTS는 추세 방향, 진입·청산 신호, 반전 구간, 주요 가격 수준을 차트에 모아 보여줍니다. 시스템을 참고해 수동으로 거래하거나, 별도의 호환 EA를 연결하여 선택한 설정에 따라 자동으로 거래를 실행할 수 있습니다. 하나의 시스템, 네 가지 트레이딩 접근법 STTS의 트레이딩 접근법은 크게 네 가지로 나뉩니다. • 스캘핑 — 단기 신호와 시장 움직임을 살펴봅니다. • 추세 매매 — 방향을 평가하고 추세 안에서 기회를 찾습니다. • 반전 매매 — 잠재적인 전환 구간과 방향 변화를 파악합니다. • 거래량 매매 — 거래량 기반 정보로 시장 활동을 평가합니다. 진입·청산 화살표, 추세 정보, 지지·저항 수
SuperScalp Pro
Van Minh Nguyen
4.56 (36)
SuperScalp Pro - Professional Multi-Layer Confluence Scalping System SuperScalp Pro는 클래식 Supertrend에 여러 지능형 확인 필터를 추가한 고급 스캘핑 지표입니다. 더 높은 확률의 Buy/Sell 거래 기회를 식별하는 데 도움을 주며, 잘못된 신호를 크게 줄이는 데 도움을 줍니다. 명확한 Buy 및 Sell 화살표가 차트에 직접 표시되며, ATR 기반 Stop Loss 및 Take Profit 수준이 실시간으로 자동 계산됩니다. 구매 후 설정 방법 및 권장 구성에 대한 안내가 필요하시면 저에게 문의해 주세요. SuperScalp Pro Auto Trader를 사용하여 신호를 쉽게 자동화할 수 있습니다: [Auto Trader] 권장 설정 파일 다운로드: [Set File] 전체 문서는 제품 블로그에서 확인할 수 있습니다: [User Guide] 업데이트를 확인하려면 공식 채널에 참여하세요: [Official C
Entry Points Pro for MT5
Yury Orlov
4.52 (151)
전설이 돌아왔습니다: Entry Points Pro 10. MQL5 마켓 Top-3 자리를 3년간 지켜온 전설적인 지표의 재출시입니다. 수백 개의 호평 리뷰(두 버전 합산 589개), 매일 이 지표로 거래하는 수천 명의 트레이더, 31,000회 이상의 데모 다운로드   MT4+MT5 . 지난 5년간 여러분이 남긴 리뷰를 하나도 빠짐없이 읽었고, 약속 대신 그 답을 버전 10에 담았습니다. 1999년부터 시장에서 활동하며 정직함과 자신의 평판, 그리고 고객을 소중히 여기는 개발자가 만들었습니다. Entry Points Pro의 진입 시그널은 절대 리페인팅되지 않습니다. 그리고 이번에는 개발자의 말뿐이 아니라 검증 가능한 사실입니다: 확정 시그널은 캔들 종가에서만 표시되며, 자동화 테스트에서 리페인팅 0건 이 확인되었습니다(EURUSD, XAUUSD, BTCUSD에서 2,486,568회의 불변조건 검사 — 위반 0건). 검증 방법은 공개되어 있으니 전략 테스터에서 직접 재현해 보실 수
Neuro Poseidon MT5
Daria Rezueva
4.75 (52)
Neuro Poseidon is a new indicator by Daria Rezueva. It combines precise trading signals with adaptive TP/SL levels - creating best possible trades as a result! Message me and get  Neuro Poseidon Assistant  as a gift to automize your trading process! What makes it stand out? 1. Proven profitability on all assets and timeframes 2. Only confirmed BUY and SELL signals present on the chart 3. Adaptive TP & SL levels generated by the software for each trade 4. Easy to understand - suitable for al
Adaptive Price Action Engine 지표를 구매하면 EA(자동매매 프로그램)가 무료 멀티 타임프레임 기반 자기 최적화 추세 & 캔들 패턴 분석 시스템 시장은 끊임없이 변화하며, 모든 Price Action 패턴이 모든 시장 환경에서 동일한 가치를 가지는 것은 아닙니다. Adaptive Price Action Engine 은 변화하는 시장 환경에 적응할 수 있도록 설계되었으며, 추세 구조, 멀티 타임프레임 분석, 캔들 패턴 및 통계적 최적화 를 하나의 분석 프레임워크로 결합합니다. 두 가지 적응형 모드 Dual Alpha Trend Mode 낮은 타임프레임과 높은 타임프레임에서 적합한 Alpha Trend 파라미터를 자동으로 탐색하여, 최근 시장 움직임에 맞춰 추세 분석을 조정합니다. Candlestick + Alpha Mode Alpha Trend를 통한 시장 국면 분석과 22개의 상승 및 하락 캔들 패턴 을 결합합니다. 모든 패턴을 동일하게 취급하는 대신, 다양
Auto Optimized SpeedAngle 은 지속적인 워크포워드 최적화(Walk-Forward Optimization, WFO)를 통해 곡선 적합(curve-fitting)을 제거한 기관 수준의 모멘텀 벡터화 시스템입니다. 시장 체제가 바뀔 때 성능이 떨어지는 정적 입력에 의존하는 대신, 이 지표는 표본 외(Out-of-Sample, OOS) 검증을 사용하여 매개변수를 동적으로 재보정하며, 표시되는 신호가 과거의 우연이 아닌 진정한 통계적 우위를 나타내도록 보장합니다. 핵심 기관용 프레임워크 워크포워드 최적화 엔진: 핵심 알고리즘은 수천 가지의 룩백(lookback) 및 임계값 조합을 지속적으로 스캔하며, 데이터를 인샘플(in-sample)과 표본 외(out-of-sample) 세트로 엄격하게 분리합니다. 미지의 데이터 환경에서 수학적 우수성이 증명된 경우에만 새로운 매개변수 구성을 채택합니다. 정량적 목적 함수: 순수한 총이익을 쫓는 대신, 최적화 엔진은 기관 수준의 안정성
M1 Sniper MT5
Oleg Rodin
5 (7)
M1 SNIPER 는 사용하기 쉬운 거래 지표 시스템입니다. M1 시간대에 맞춰 설계된 화살표 지표입니다. 이 지표는 M1 시간대 스캘핑을 위한 단독 시스템으로 사용할 수 있으며, 기존 거래 시스템의 일부로도 사용할 수 있습니다. 이 거래 시스템은 M1 시간대 거래용으로 특별히 설계되었지만, 다른 시간대에도 사용할 수 있습니다. 원래는 XAUUSD와 BTCUSD 거래를 위해 이 방법을 설계했지만, 다른 시장 거래에도 유용하다는 것을 알게 되었습니다. 이 지표의 신호는 추세 방향과 반대로 거래될 수 있습니다. 저는 지표의 신호를 활용하여 양방향으로 거래할 수 있도록 돕는 특별한 거래 기법을 알려드립니다. 이 방법은 특별한 동적 지지선과 저항선 가격 영역을 활용하는 것을 기반으로 합니다. 구매하시면 M1 SNIPER 화살표 지표를 바로 다운로드하실 수 있습니다. 또한, 아래 스크린샷에 표시된 Apollo Dynamic SR 지표는 M1 SNIPER 도구를 사용하는 모든 사용자에게 무료로
Gann Made Easy MT5
Oleg Rodin
5 (11)
Gann Made Easy 는 mr.의 이론을 사용하여 최고의 거래 원칙을 기반으로 하는 전문적이고 사용하기 쉬운 Forex 거래 시스템입니다. W.D. 간. 이 표시기는 Stop Loss 및 Take Profit Levels를 포함하여 정확한 BUY 및 SELL 신호를 제공합니다. PUSH 알림을 사용하여 이동 중에도 거래할 수 있습니다. 구매 후 거래 방법 안내 및 유용한 추가 지표를 무료로 받으시려면 저에게 연락주세요! 아마도 Gann 거래 방법에 대해 이미 여러 번 들었을 것입니다. 일반적으로 Gann의 이론은 초보자 거래자뿐만 아니라 이미 거래 경험이 있는 사람들에게도 매우 복잡한 것입니다. Gann의 거래 방식은 이론적으로 적용하기 쉽지 않기 때문입니다. 나는 그 지식을 연마하고 Forex 지표에 최고의 원칙을 적용하기 위해 몇 년을 보냈습니다. 표시기는 적용하기가 매우 쉽습니다. 차트에 첨부하고 간단한 거래 권장 사항을 따르기만 하면 됩니다. 지표는 지속적으로 시장 분석
ARIPoint
Temirlan Kdyrkhan
1 (4)
ARIPoint is a powerful trading companion designed to generate high-probability entry signals with dynamic TP/SL/DP levels based on volatility. Built-in performance tracking shows win/loss stats, PP1/PP2 hits, and success rates all updated live. Key Features: Buy/Sell signals with adaptive volatility bands Real-time TP/SL/DP levels based on ATR Built-in MA Filter with optional ATR/StdDev volatility Performance stats panel (Success, Profit/Loss, PP1/PP2) Alerts via popup, sound, push, or email Cu
Scalper Vault MT5
Oleg Rodin
5 (1)
Scalper Vault 는 성공적인 스캘핑에 필요한 모든 것을 제공하는 전문 스캘핑 시스템입니다. 이 표시기는 외환 및 바이너리 옵션 거래자가 사용할 수 있는 완전한 거래 시스템입니다. 권장 시간 프레임은 M5입니다. 시스템은 추세 방향으로 정확한 화살표 신호를 제공합니다. 또한 상단 및 하단 신호와 Gann 시장 수준을 제공합니다.  이 시스템은 사용하기가 매우 쉽습니다. 원하는 시장 지역의 화살표만 따라가면 됩니다. 엑시트는 가격이 적정 수준에 도달하거나 시장의 고점 또는 저점 신호가 나타날 때 수행됩니다.  표시기는 PUSH 알림을 포함한 모든 유형의 경고를 제공합니다. 인디케이터 구매 후 연락주세요. 내 개인 거래 권장 사항과 훌륭한 보너스 지표를 무료로 공유합니다! 나는 당신에게 행복하고 유익한 거래를 기원합니다!
Trend Catcher ind mt5
Ramil Minniakhmetov
5 (18)
트렌드 캐처 인디케이터 트렌드 캐처 인디케이터는 개발자가 자체 개발한 맞춤형 적응형 트렌드 분석 지표들을 조합하여 시장 가격 움직임을 분석합니다. 단기적인 노이즈를 제거하고 근본적인 모멘텀 강도, 변동성 확대, 가격 구조 움직임에 집중하여 진정한 시장 방향을 파악합니다. 또한 이동 평균, RSI, 변동성 필터와 같은 맞춤형 지표들을 활용하여 가격을 평활화하고 트렌드를 필터링합니다. 실제 운영 모니터링 및 기타 제품은 다음 링크에서 확인하실 수 있습니다:   https://www.mql5.com/en/users/mechanic/seller 텔레그램에서는 EA나 설정 파일을 판매하지 않습니다. 사기이니 주의하세요. 모든 설정 파일은 블로그에서 무료로 제공됩니다. 중요! 구매 후 즉시 연락 주시면 사용 방법 및 보너스를 드립니다!
Entry In The Zone and SMC Multi Timeframe is a real-time market analysis tool based on Smart Money Concepts (SMC), designed to analyze market structure, price direction, and key trading zones. It supports both Single-Timeframe and Multi-Timeframe Analysis, providing a clearer view of overall market structure across multiple timeframes, with real-time BUY / SELL signals designed with a strict focus on No-Repaint principles. The signals are designed to help filter unclear setups and evaluate tradi
안녕하세요, 트레이더 여러분! 많은 개인 투자자들이 느린 웹 스크립트에 의존하고 있습니다. 수익성 있는 거래를 위해서는 체계적인 프레임워크가 필수적입니다. Astro AI 지표는 단순한 차트 오버레이가 아닙니다. 터미널에서 직접 실행되는 두 개의 에이전트로 구성된 정교한 신경망입니다. 시스템 기술 상세 설명: 1. 에이전트 1: 분석가 (그래픽 신경망 – GNN) 시장은 개별 가격 막대로 이루어진 것이 아니라 상호 연결된 데이터 네트워크입니다. 기능: 에이전트 1은 그래픽 신경망을 사용하여 이러한 복잡하고 비선형적인 관계를 파악합니다. 장점: 기존 지표는 과거 이동 평균만을 고려하는 반면, 저희 GNN은 시장의 심층적인 구조적 관계를 실시간으로 처리하여 개별 트레이더의 거래량이 시장에 큰 영향을 미치기 전에 숨겨진 상관관계를 찾아냅니다. 2. 에이전트 2: 실행기 (근접 전략 최적화 – PPO) 패턴 인식은 절반의 성공일 뿐입니다. 현재 시장 변동에 기반하여 올바른
Divergence Bomber
Ihor Otkydach
4.89 (94)
이 지표를 구매하신 분께는 다음과 같은 혜택이 무료로 제공됩니다: 각 거래를 자동으로 관리하고, 손절/익절 수준을 설정하며, 전략 규칙에 따라 거래를 종료하는 전용 도우미 툴 "Bomber Utility" 다양한 자산에 맞게 지표를 설정할 수 있는 셋업 파일(Set Files) "최소 위험", "균형 잡힌 위험", "관망 전략" 모드로 설정 가능한 Bomber Utility의 셋업 파일 이 전략을 빠르게 설치, 설정, 시작할 수 있도록 돕는 단계별 영상 매뉴얼 주의: 위의 모든 보너스를 받기 위해서는 MQL5 개인 메시지 시스템을 통해 판매자에게 연락해 주세요. 독창적인 커스텀 지표인 “Divergence Bomber(다이버전스 봄버)”를 소개합니다. 이 지표는 MACD 다이버전스(괴리) 전략을 기반으로 한 올인원(All-in-One) 거래 시스템입니다. 이 기술 지표의 주요 목적은 가격과 MACD 지표 간의 다이버전스를 감지하고, **향후 가격이 어느 방향으로 움직일지를 알려주
Unix Scalper
Issam Kassas
4 (4)
Unix Scalper — MetaTrader 5 구매 후 MQL5에서 저에게 메시지를 보내시면 Smart Universal Expert Advisor를 무료로 받으실 수 있으며, 온라인 강좌, PDF 매뉴얼 및 비공개 그룹 이용 권한도 함께 제공됩니다. 매매 기회를 찾고, 거래 계획을 확인하고, 실행 방법을 선택하세요. UNIX Scalper는 시장 분석, BUY/SELL/WAIT 판단, Entry, Stop Loss, TP1 및 TP2 가격 수준을 하나의 정돈된 패널에 제공합니다. 신호와 거래 계획을 한눈에 • 명확한 판단: BUY, SELL 또는 WAIT. • 구체적인 가격 수준: Entry, Stop Loss, TP1 및 TP2. • 다중 시간대 개요: 패널의 여러 시간대 신호를 비교하세요. • 판단을 돕는 분석: 추세, 모멘텀, 거래량, 변동성, 지지와 저항, 시장 품질. • 다양한 레이아웃: Minimized, Compact, Standard 또는 Full. 신호와
Volatility Master for MetaTrader is a real-time dashboard tool that scans up to  50 symbols  to identify high-volatility , trending markets instantly. With bullish/bearish signals, customizable alerts, and a user-friendly interface, it helps you avoid range-bound conditions and focus on high-probability trades. Clarity leads to confidence. Trade confidently and protect your capital effectively with this powerful dashboard. We don't offer free or bonus indicators in exchange of reviews from you.
Quantum TrendPulse
Bogdan Ion Puscasu
5 (26)
SuperTrend   ,   RSI   ,   Stochastic   의 힘을 하나의 포괄적인 지표로 결합하여 트레이딩 잠재력을 극대화하는 궁극의 트레이딩 도구   인 Quantum TrendPulse를   소개합니다. 정밀성과 효율성을 추구하는 트레이더를 위해 설계된 이 지표는 시장 추세, 모멘텀 변화, 최적의 진입 및 종료 지점을 자신 있게 식별하는 데 도움이 됩니다. 주요 특징: SuperTrend 통합:   주요 시장 추세를 쉽게 따라가고 수익성의 물결을 타세요. RSI 정밀도:   매수 과다 및 매도 과다 수준을 감지하여 시장 반전 시점을 파악하는 데 적합하며 SuperTrend 필터로 사용 가능 확률적 정확도:   변동성이 큰 시장에서 숨겨진 기회를 찾기 위해 확률적 진동   을 활용하고 SuperTrend의 필터로 사용 다중 시간대 분석:   M5부터 H1 또는 H4까지 다양한 시간대에 걸쳐 시장을 최신 상태로 유지하세요. 맞춤형 알림:   맞춤형 거래 조건이 충족되면
소개       Quantum Breakout PRO   , 브레이크아웃 존 거래 방식을 변화시키는 획기적인 MQL5 지표! 13년 이상의 거래 경험을 가진 숙련된 트레이더 팀이 개발한       퀀텀 브레이크아웃 PRO       혁신적이고 역동적인 브레이크아웃 존 전략으로 거래 여정을 새로운 차원으로 끌어올리도록 설계되었습니다. Quantum Breakout Indicator는 5개의 이익 목표 영역이 있는 브레이크아웃 영역의 신호 화살표와 브레이크아웃 상자를 기반으로 한 손절 제안을 제공합니다. 초보자 거래자와 전문 거래자 모두에게 적합합니다. Quantum EA 채널:       여기를 클릭하세요 중요한! 구매 후 설치 매뉴얼을 받으려면 개인 메시지를 보내주십시오. 추천: 기간: M15 통화쌍: GBPJPY, EURJPY, USDJPY,NZDUSD, XAUUSD 계정 유형: 스프레드가 매우 낮은 ECN, Raw 또는 Razor 브로커 시간: GMT +3 중개인 :
Atomic Analyst MT5
Issam Kassas
4.48 (62)
Atomic Analyst — MetaTrader 5 구매 후 MQL5에서 저에게 메시지를 보내시면 Smart Universal Expert Advisor를 무료로 받으실 수 있으며, 온라인 강좌, PDF 매뉴얼 및 비공개 그룹 이용 권한도 함께 제공됩니다. Atomic Analyst는 가격 움직임 분석, 추세 방향, 진입·청산 신호, 손절 수준, 여러 익절 수준을 차트에 모아 보여줍니다. 신호를 확인하고 매매 상황을 이해하세요 Atomic Analyst는 분석 결과를 명확한 시각 정보로 정리합니다. • 잠재적인 진입 기회를 확인할 수 있는 매수·매도 화살표. • 거래 계획에 도움이 되는 손절 수준과 여러 익절 수준. • 시장 방향을 평가할 수 있는 추세, 강도, 모멘텀 수치. • 더 넓은 시장 맥락을 비교할 수 있는 여러 시간대 분석. • 변화하는 시장 상황을 따라갈 수 있는 색상별 캔들과 알림. 신호와 보조 분석을 함께 검토한 다음, 해당 매매 상황이 자신의 거래 규칙에
PainX GainX Blue Spike Fusion AI Advanced Synthetic Index Spike Detection Indicator for MetaTrader 5 Discover potential spike setups with a clear, organized, and professional trading interface. PainX GainX Blue Spike Fusion AI is a specialized indicator designed for traders who monitor synthetic indices and want a structured way to observe potential price spike opportunities. The indicator combines signal monitoring, market-condition analysis, visual alerts, and event tracking in one convenient
PZ Divergence Trading MT5
PZ TRADING SLU
3.71 (7)
Unlock hidden profits: accurate divergence trading for all markets Tricky to find and scarce in frequency, divergences are one of the most reliable trading scenarios. This indicator finds and scans for regular and hidden divergences automatically using your favourite oscillator. [ Installation Guide | Update Guide | Troubleshooting | FAQ | All Products  ] Easy to trade Finds regular and hidden divergences Supports many well known oscillators Implements trading signals based on breakouts Displays
RelicusRoad Pro MT5
Relicus LLC
4.96 (25)
거래를 더 이상 감으로 하지 마세요. 언제 진입할지, 어디서 청산할지, 시장이 어느 쪽으로 기울어 있는지를 한 차트에서 확인하세요. RelicusRoad Pro는 20개 가까운 도구를 인디케이터 하나에 담았고, 내 매매 방식에 맞는 도구만 켜서 쓰면 됩니다. 명확한 진입. 명확한 청산. 차트마다 확실한 계획. 이런 경험, 익숙하지 않으신가요? 매수하면 1분 뒤 가격이 반대로 돌아섭니다. 너무 일찍 청산하고, 그다음 움직임이 나 없이 이어지는 것을 지켜봅니다. 지표를 5개 띄우면 답도 5가지가 나옵니다. 손절(스톱로스)은 그냥 감입니다. 우리가 이걸 만든 이유 우리는 18년 동안 외환 거래를 해 왔습니다. RelicusRoad는 처음에 우리끼리 쓰려고, 전문 트레이더 모임을 위해 비공개로 만들었습니다. 이유는 개인적이었습니다. 같은 선을 손으로 계속 그리는 일에 지쳤고, 스스로 정한 규칙을 어기고, 차트에서 정말 중요한 한 가지를 놓치곤 했습니다. 우리에게 통한 것은 일관성입니다. 매
Quantum Direction 은 시장 방향을 파악하고, 초기 추세 변화를 감지하며, 필터링된 진입 및 청산 신호를 제공하도록 설계된 전문 추세 추종 지표입니다. 이 지표에는 MQL5 Market에서 무료로 제공되는 전문 거래 관리 도구 Quantum Trade Assistant 가 포함되어 있습니다. Quantum Direction 에 직접 연결하여 유효한 신호가 발생하면 자동으로 거래를 실행하거나, 설정된 청산 조건이 충족되면 자동으로 거래를 종료할 수 있습니다. 무료 Quantum Trade Assistant 다운로드 이 지표의 주요 기능: 다중 로직 추세 감지 — 여러 시장 분석 조건을 결합하여 잠재적인 추세 시작과 추세 방향 변화를 감지합니다. 세션 필터 — 선택한 거래 세션에 신호를 집중하여 시장 활동과 변동성이 높은 시간대의 시장 기회를 분석하는 데 도움을 줍니다. 상위 타임프레임 필터 — 상위 타임프레임을 사용하여 시장 방향을 확인하고 단기 돌파 또는 일시적인 시장
OrderFlux – MetaTrader 5용 오더플로우 및 풋프린트 지표 OrderFlux 는 MetaTrader 5를 위한 전문적인 오더플로우(Order Flow) 및 풋프린트(Footprint) 지표입니다. 각 개별 캔들을 열어 그 내부에서 무슨 일이 일어나고 있는지 밝혀냅니다: 공격적인 매수자와 매도자로 분리된 모든 가격 수준의 거래량을 보여줍니다. 이 틱(Tick) 데이터를 바탕으로 Delta, Imbalance, Volume Profile 및 Market Profile 이 포함된 완벽한 풋프린트 차트를 실시간으로 구성합니다. 표준 차트는 시가, 고가, 저가, 종가만 보여줍니다. 이는 움직임의 원인이 아니라 결과일 뿐입니다. OrderFlux는 모든 캔들의 미시 구조를 볼 수 있게 해주며, 가장 중요한 단 하나의 질문에 답합니다: "실제로 누가 이 움직임을 주도했는가?" 이를 통해 캔들의 모양만으로 추측하는 대신 실제 거래된 볼륨에서 지지와 저항을 읽을 수 있습니다。 풋프린
Power Candles MT5
Daniel Stein
4.58 (12)
Power Candles V3 - 자체 최적화 강도 지표 파워 캔들 V3는 적용된 모든 차트에서 통화 및 상품의 강세를 실행 가능한 거래 계획으로 전환합니다. 단순히 캔들에 색상을 입히는 대신, 백그라운드에서 실시간 자동 최적화를 수행하여 현재 보고 있는 종목에 대한 최적의 손절매, 익절 및 신호 임계값을 제공합니다. 한 번의 클릭으로 실시간 거래에 적용할 수 있으며, 진입점, 손절매 및 익절 선이 정확한 가격에 맞춰 차트에 표시되고, 방향과 함께 알림이 발령됩니다. 이 도구는 Stein Investments 에코시스템의 일부입니다. 18개 이상의 도구와 함께 당신의 1대1 AI 트레이딩 멘토 Max.  항상 대기 중, 모든 인디케이터를 깊이 있게 이해, 무언가를 차근차근 생각해보고 싶은 순간에 도움을 줍니다.  https://stein.investments 에서 만나보세요 매 종가 바마다 3,000회 이상의 트레이딩 시뮬레이션. 9가지 강도 상태. 2가지 전략을 병렬로 테스트.
FX Trend MT5 NG
Daniel Stein
5 (6)
FX Trend NG: 차세대 멀티 마켓 트렌드 인텔리전스 개요 FX Trend NG 는 다중 시간 프레임 기반의 전문 트렌드 분석 및 시장 모니터링 도구입니다. 몇 초 만에 전체 시장 구조를 파악할 수 있도록 설계되었습니다. 여러 차트를 일일이 전환할 필요 없이, 어떤 종목이 추세에 있는지, 어디에서 모멘텀이 약화되고 있는지, 그리고 어떤 시간 프레임이 서로 정렬되어 있는지 즉시 확인할 수 있습니다. 출시 기념 특별 혜택 – FX Trend NG 를 $30 (6개월) 또는 $80 평생 라이선스 로 이용할 수 있습니다. 이미 Stein Investments 고객이신가요? -> 메시지를 보내 전용 고객 그룹에 참여하세요. 설정이나 사용 방법이 필요하신가요? -> Stein Investments 공식 페이지 를 방문하세요. 1. FX Trend NG가 특별한 이유 3단계 추세 로직 – 단순한 Buy / Sell이 아닙니다 • 대부분의 지표는 Buy 또는 Sell 두 가지 상태만 제
IX Power MT5
Daniel Stein
4.92 (13)
IX Power: 지수, 원자재, 암호화폐 및 외환 시장 통찰력을 발견하세요 개요 IX Power 는 지수, 원자재, 암호화폐 및 외환 시장의 강도를 분석할 수 있는 다목적 도구입니다. FX Power 는 모든 가용 통화 쌍 데이터를 사용하여 외환 쌍에 대해 가장 높은 정확도를 제공하는 반면, IX Power 는 기초 자산 시장 데이터에만 초점을 맞춥니다. 이로 인해 IX Power 는 비외환 시장에 이상적이며, 다중 쌍 분석이 필요하지 않은 간단한 외환 분석에도 신뢰할 수 있는 도구입니다. 모든 차트에서 매끄럽게 작동하며, 거래 결정을 향상시키기 위한 명확하고 실행 가능한 통찰력을 제공합니다. 1. IX Power가 트레이더에게 유용한 이유 다양한 시장 강도 분석 • IX Power 는 지수, 원자재, 암호화폐 및 외환 심볼의 강도를 계산하여 각 시장에 맞는 통찰력을 제공합니다. • US30, WTI, 금, 비트코인 또는 통화 쌍과 같은 자산을 모니터링하여 거래 기회를 발견
M1 Quantum MT5
Hamed Dehgani
4.2 (10)
M1 Quantum을 이용한 실시간 트레이딩 신호 : 신호   ( Quantum Trade Assistant 에 의해 거래가 자동으로 실행되며, 이 제품에 무료 로 포함되어 있습니다.) 최신 소식: 버전 1.64가 출시되었습니다. 이제 모든 거래에는 해당 지지/저항 구간 뒤에 Stop Loss가 설정됩니다. 또한 이번 버전에서는 EA의 성능을 향상시키기 위해 Smart Close 기능이 개선되었습니다. 8월 9일부터 라이브 신호는 버전 1.64로 운영되고 있습니다. 가격 계획: 현재 가격: $169 (얼리 어답터 혜택) 다음 예정 가격: $189 예정 소매 가격: $299 개발자 안내: 구매 후 저에게 연락하시면 최신 권장 설정 파일(Set File) , 사용 팁, 그리고 다른 M1 Quantum 사용자들과 소통할 수 있는 VIP 지원 그룹 초대장을 받으실 수 있습니다. 자주 묻는 질문 - 설정 파일 - 설치 가이드 M1 Quantum 은 M1 전용 전문 트레이딩 시스템으로, 손
CRT Pro is a complete Candle Range Theory toolkit for MetaTrader 5. It finds the CRT model on up to three timeframes and adds the tools needed to read it: higher-timeframe candles, structure shifts, fair value gaps, liquidity sweeps, a bias table and SSMT divergence. Every module can be switched on or off. 1. CRT Model A CRT model is built from two candles of the chosen CRT timeframe. C1 is the range candle. C2 is the sweep candle: it takes the high or the low of C1 and closes back inside the
제작자의 제품 더 보기
Blendlink Essential
Chonlasit Thupchoti
Try BlendLink: See the win rate live on your chart. BlendLink Essential   is the free introduction to BlendLink for MetaTrader 5. Tick the lines you trust, blend them into one clean line, and the panel tests your mix on your own chart with real spread included. Features included: 5 lines of the Average group: EMA 50, SMA 200, EMA 20, Hull MA, and Ace Trend. Blend into 1 clean composite trend line. Balanced style with Buy/Sell signals, Entry, Take Profit, and Stop Loss tags (No repaint). Live wi
FREE
Bit Surge
Chonlasit Thupchoti
LAUNCH PRICE: 39 USD for the first 10 copies, then 299 USD. +22 % in 3 years. Worst drawdown 5.46 %. (Hypothetical MT5 backtest, Oct 2023 to Oct 2026, 1 % risk per trade. Not live results.) Bit Surge trades Bitcoin (BTCUSD) on H4. It buys dips and sells rallies inside the trend, during New York hours. WHY IT'S SAFER • Small losses, big wins: the average win is 2.2x the average loss, and the worst single loss in 3 years was 0.8 % of the account. • One losing trade can't snowball: no martingal
**Pass the rules first, then trade the signal.** AceStreak Prop puts your prop firm's limits on the chart next to the signal. You see how much you can still lose today and overall before you size the next trade. ### Two stages, one tap - **Challenge Stage:** 1.0% risk per trade. Tracks profit target progress, trading days done, and daily/max loss remaining. - **Funded Stage:** 0.5% risk per trade. Tracks profit since start, loss left, and preserves your account floor. *Swing on Gold (XAUUSD
필터:
리뷰 없음
리뷰 답변