ATR Bands Matrix

MT5용 ATR Bands & Multi-Timeframe Trend Matrix

변동성을 포착하고, 추세의 강도를 측정하며, 중요한 시장 움직임을 절대 놓치지 마세요.

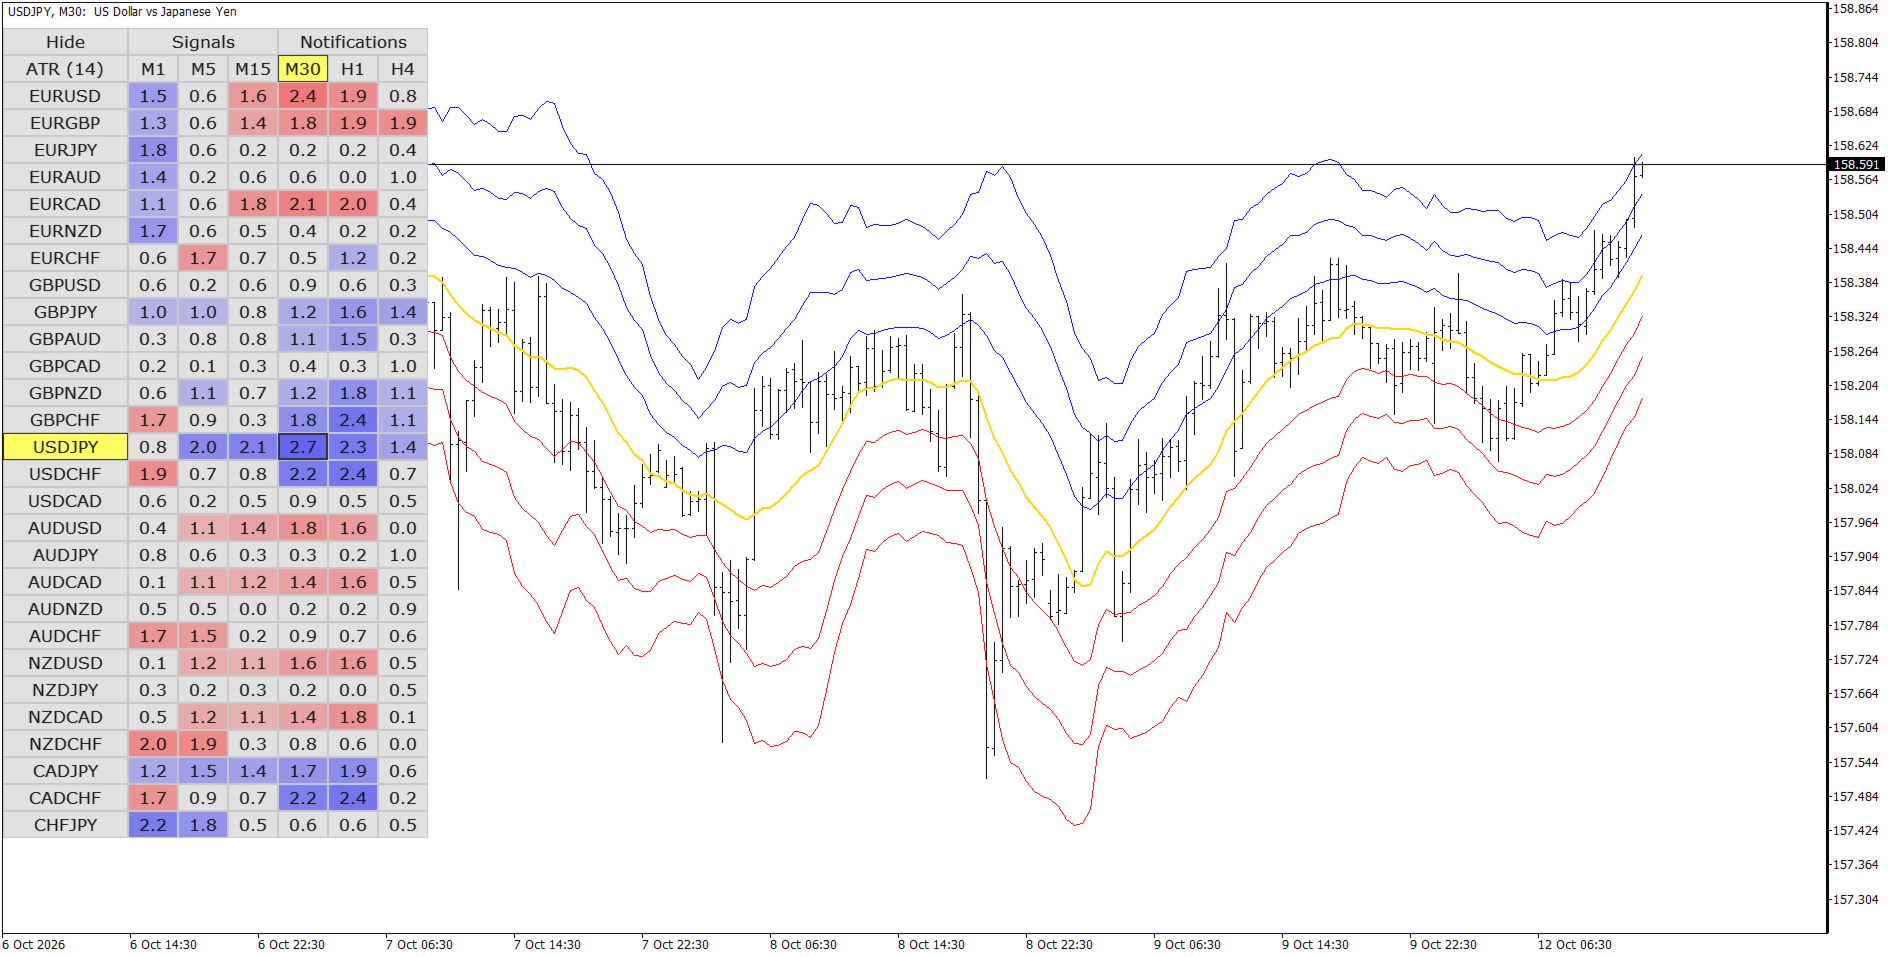
ATR Bands & Multi-Timeframe Trend Matrix는 동적 ATR 밴드와 대화형 시장 스캔 대시보드를 결합한 MetaTrader 5용 전문가급 트레이딩 도구입니다. 수십 개의 통화쌍과 여러 시간대를 동시에 모니터링하여 시장 노이즈를 즉시 걸러내고, 강력한 추세를 식별하며, 높은 확률의 트레이딩 기회가 형성되는 순간 이를 포착합니다.

주요 기능 및 장점

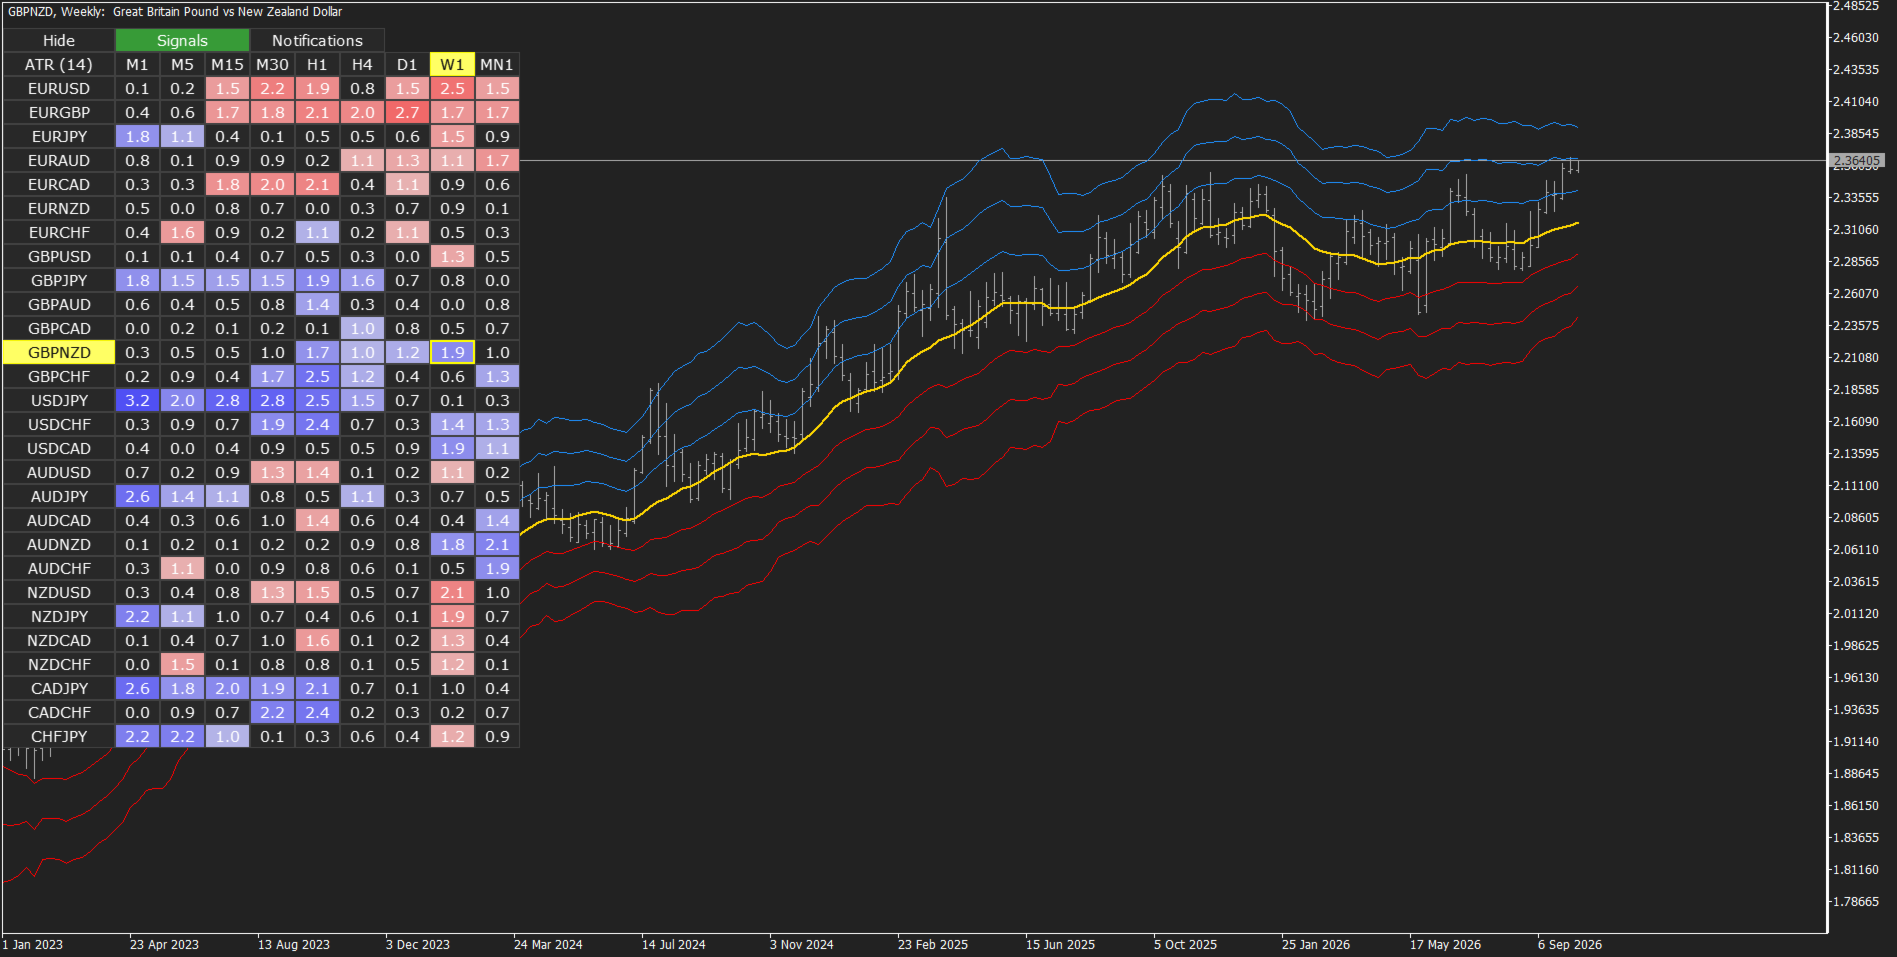
멀티 심볼 및 멀티 타임프레임 매트릭스

수십 개의 개별 차트를 일일이 전환하며 시간을 낭비하지 마세요. 직관적인 색상 코드 대시보드를 통해 시장 전체를 한눈에 파악할 수 있습니다. 여러 자산의 변동성과 추세 상태를 동시에 스캔하므로, 트레이딩 잠재력이 가장 높은 종목에만 집중할 수 있습니다.

원클릭 대화형 탐색 기능

작업 공간을 최대한 효율적으로 관리하세요. 매트릭스에서 원하는 심볼이나 시간대를 클릭하면 활성 차트가 즉시 전환됩니다. 더 이상 시장 관찰 창에서 종목을 수동으로 검색하거나 차트 템플릿을 반복해서 적용할 필요가 없습니다.

정밀한 추세 분석을 위한 ATR 밴드

동적 ATR(Average True Range, 평균 진폭) 밴드를 사용하여 이동평균선 대비 가격 움직임을 시각적으로 확인하세요. 이 지표는 과매수 및 과매도 상태(가격의 평균 대비 과도한 이탈)를 쉽게 식별하고, 가격이 평균에서 얼마나 멀리 벗어났는지를 바탕으로 추세의 실제 모멘텀을 평가하는 데 도움을 줍니다.

멀티 타임프레임 추세 강도 신호

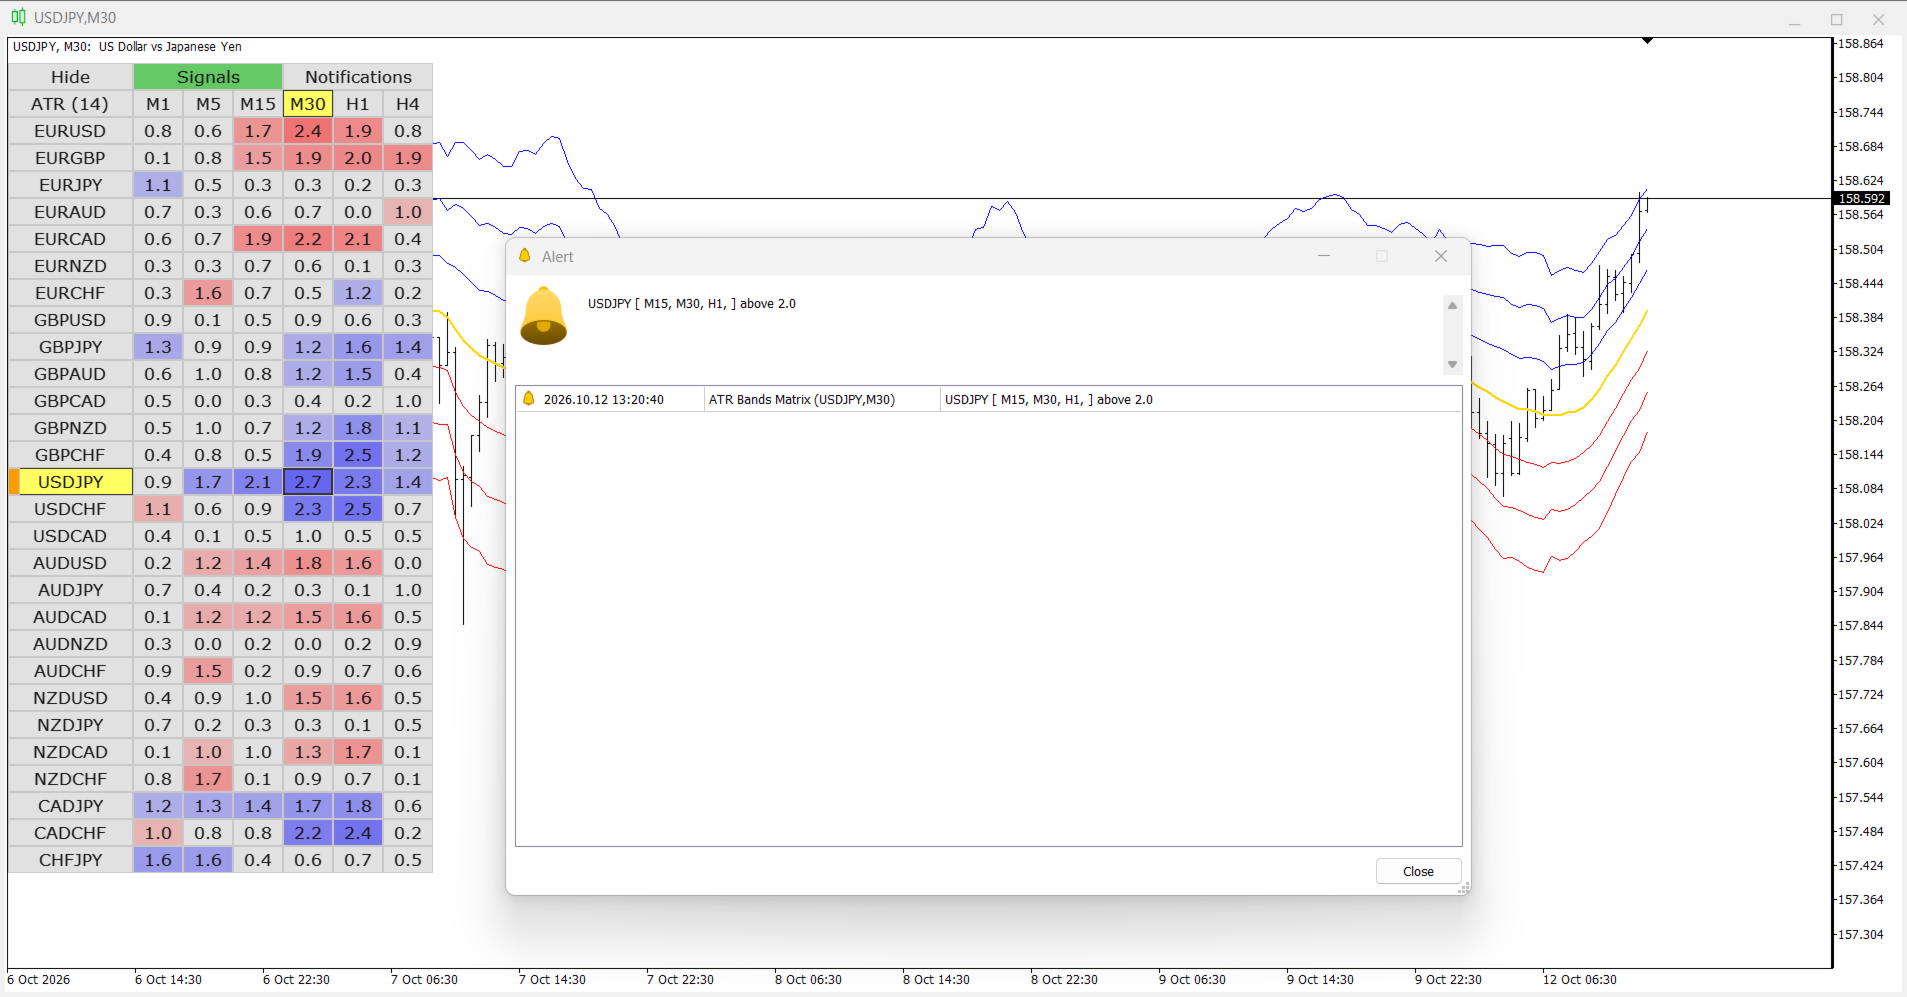
여러 시간대의 진입 방향을 일치시켜 기관 투자자의 자금 흐름에 맞춰 거래하세요. 여러 시간대에서 가격이 사용자가 설정한 ATR 임계값을 동시에 돌파하면 지표가 자동으로 알림을 생성합니다.

  • 예시: EURUSD [M15, M30, H1] 3.0 초과 — 이는 15분봉, 30분봉, 1시간봉에서 가격이 각각의 이동평균선보다 3 ATR 이상 높은 수준까지 동시에 상승했음을 의미합니다. 여러 시간대가 같은 방향을 가리킬 때, 추세가 지속될 가능성이 높은지 확인할 수 있습니다.

강력한 알림 시스템 (진입 기회를 절대 놓치지 마세요)

컴퓨터 앞을 비우거나 다른 업무를 처리하는 중에도 시장 상황을 파악할 수 있습니다.

  • 사운드 알림 및 팝업 창: MT5 플랫폼 내에서 직접 알림을 받을 수 있습니다.
  • 시각적 마커: 과거 신호를 빠르게 검토하고 분석할 수 있습니다.
  • 로컬 텍스트 로그: 신호 기록을 로컬에 저장하여 이력을 관리할 수 있습니다.
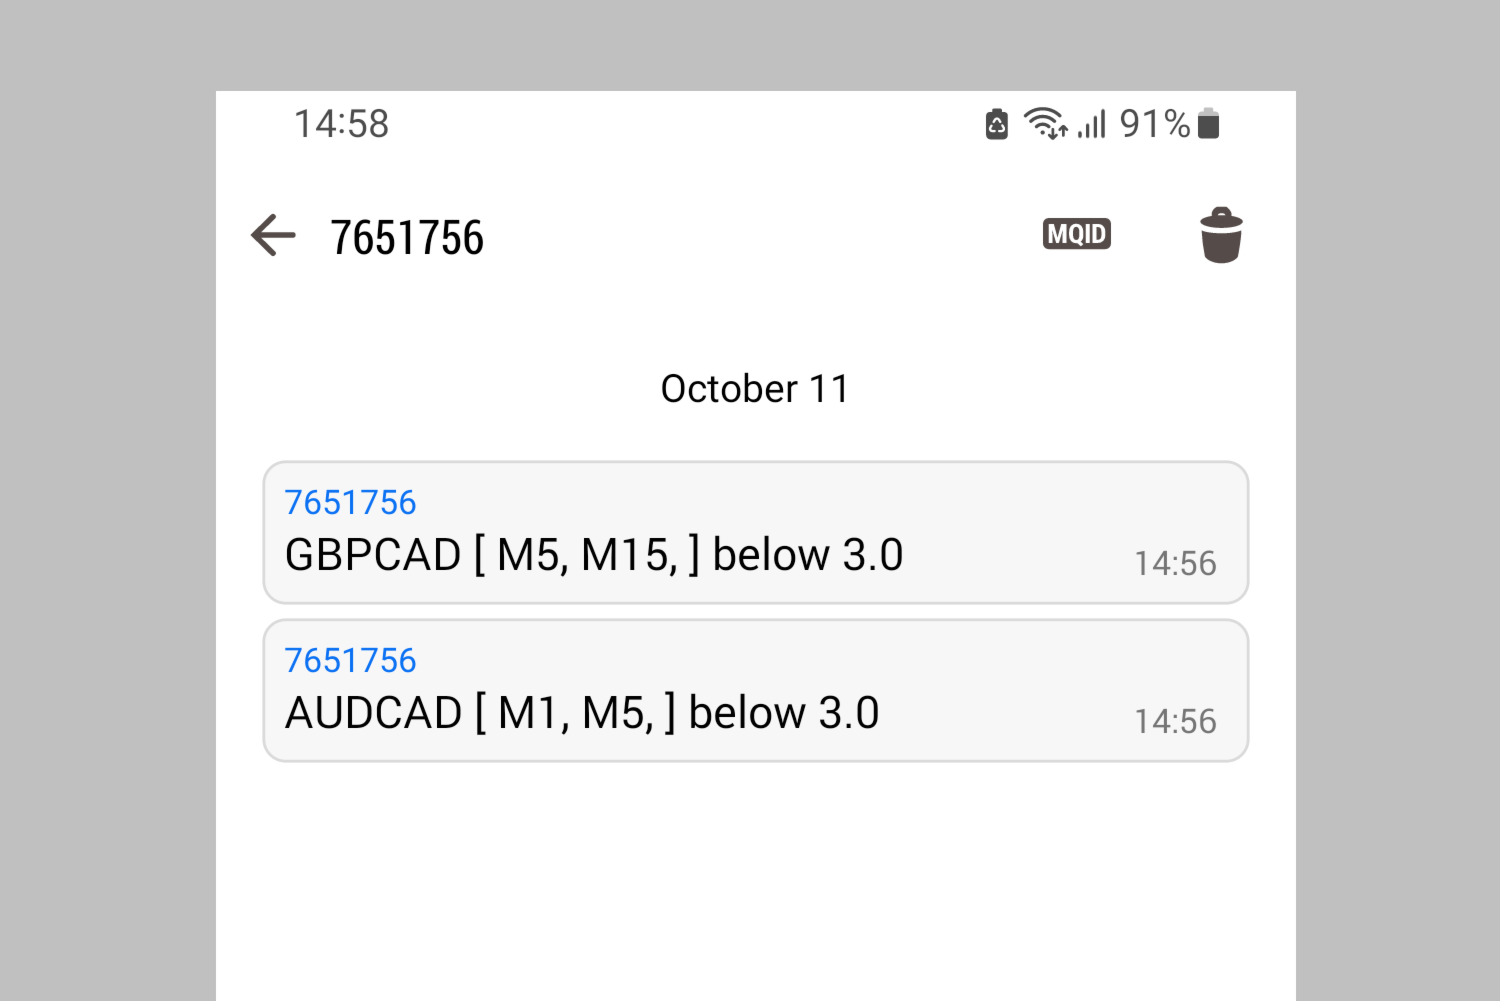
  • 모바일 푸시 알림: 신호가 발생하는 즉시 스마트폰(iOS 및 Android)으로 알림을 전송합니다.

이 지표는 누구에게 적합할까요?

  • 스캘퍼 및 데이 트레이더: 돌파 움직임과 변동성 급증에 신속하게 대응해야 하는 트레이더.
  • 스윙 트레이더: 여러 시간대의 방향 일치를 통해 자신의 시장 전망을 확인하고자 하는 트레이더.
  • 멀티 에셋 트레이더: 화면을 모니터링하는 시간을 최적화하고 번거로운 시장 스캔 과정을 자동화하려는 트레이더.

지금 ATR Matrix로 트레이딩 수준을 한 단계 높이세요

차트 분석을 효율화하고, 과도한 분석으로 인한 의사결정 지연을 줄이세요. 전문가 수준의 멀티 타임프레임 분석이 제공하는 수학적 우위를 활용하여 더욱 체계적인 트레이딩을 시작하세요.
추천 제품
Marcon s Deviation
Luiz Antonio De Sousa Marcon
DESVIO DE MARCON  (Desvio Dinâmico de VWAP) O Desvio de Marcon é um indicador desenvolvido com o intuito de fornecer ao TRADER uma ferramenta capaz de antecipar pontos relevantes de suporte e resistência através de canais de desvios de VWAP traçados no gráfico.  Mas qual a diferença entre o Desvio de Marcon e os canais de desvio padrão da VWAP já existentes? O Desvio de Marcon utiliza um algoritmo estatístico desenvolvido por Luiz Antonio de Sousa Marcon, que lhe dá a capacidade de se auto calib
기관급 SMC 및 컨플루언스 엔진 (MTF 스캐너) 기관급 SMC 및 컨플루언스 엔진은 MetaTrader 5를 위해 개발된 전문적인 Smart Money Concepts 지표입니다. 고빈도 동적 구조 매핑을 위해 설계되었으며, 대화형 스캐너 대시보드를 통해 여러 자산과 타임프레임을 동시에 모니터링하면서 기관의 공급 및 수요(Supply and Demand) 존을 자동으로 감지, 점수화 및 필터링합니다. 핵심 기능 및 특징 자동화된 공급 및 수요 존 감지 기관급 피벗 반경 엔진: 지연 지표 없이 시장의 핵심 반전 지점을 정확하게 포착합니다. 고정밀 존 매핑: 캔들 몸통과 꼬리의 비율을 자동으로 측정하여 정확한 수요 존(시가와 종가 중 높은 값부터 저가까지) 및 공급 존(고가부터 시가와 종가 중 낮은 값까지)을 그립니다. 실시간 완화(Mitigation) 정제: 활성화된 존을 동적으로 모니터링합니다. 가격 움직임에 의해 존이 무효화되거나 돌파되면 차트에서 즉시 삭제되어 작업 공간을
Ultimate World Clock
Mehdi Ghorbani Saeidian
Every Trader trades in a market zone. If you are not living in the time zone you are trading, you need a clock to show you what time it is in your favorite time zone, and it should be small at the same time to not interrupt your trading process.  In this small indicator, you have access to 3 major clocks around the world, and you can easily look at them. We have some other products that I am sure will help you with your trading career. Please have a look at the link: LINK our all-in-one trading
There is a strong correlation between tick volume and real volume.  This is important for 2 reasons: Real volume is a very important indicator because, among many other benefits, it provides strong confirmations of the emergence/dissipation of trends. Real volume is not available in Forex, instead, one has to make do with tick volume. Unfortunately, tick volume is highly broker dependent.  Additionally, it is often not used effectively to define indicators.  Virtually all indicators that use
This is Gekko's Bollinger Bands indicator. It extends the use of the famous Bollinger Bands and calculates strong entry and exit signals using price action on the edge and on the middle bands. You can set it up in many different ways, eg: pullback, pullback against trend, middle band crossing and middle band crossing against trend. Inputs Number of Bars to Plot Indicator:  number of historical bars to plot the indicator, keep it low for better performance; Produces Signal Only When a Bar Closes:
Saturated Trend
Vitalii Zakharuk
The Saturated Trend indicator simplifies your decision making process by recognizing reversals with a built-in algorithm and then confirming signals at support/resistance levels. Implements a type of technical analysis based on the idea that the market is cyclical. Thus, the indicator follows the market trend with great reliability, ignoring sharp market fluctuations and noise around the average price. The indicator can be used both for pipsing on short periods and for long-term trading.
RelicusRoad Dynamic Circles는 MetaTrader 4와 MetaTrader 5용 스윙 고점·저점 지표로, 9봉, 60봉, 156봉이라는 세 가지 관찰 구간에서 동시에 전환점을 원으로 표시합니다. 작은 전환과 큰 전환이 같은 차트에 있지만 서로 다르게 보입니다. 짧은 구간의 점은 작은 스윙을 보여주고, 더 큰 중간·긴 구간의 고리는 훨씬 긴 구간의 극값일 때만 나타납니다. 각 원에는 HH(60)이나 LL(156) 같은 짧은 텍스트 라벨이 붙을 수 있습니다. 작동 방식 모든 봉에 대해 지표는 그 봉의 고가가 직전 N봉(해당 봉 포함) 중 가장 높은 고가인지 확인합니다. 그렇다면 그 봉에 High 원이 표시됩니다. Low도 같은 방식으로 확인됩니다. 이 검사는 과거만 살펴보므로 봉이 지금까지의 극값이 되는 즉시 표시될 수 있습니다. 같은 검사가 각 구간마다 한 번씩, 총 세 번 실행됩니다: 짧은 구간: 기본값 9봉, 작은 점으로 표시. 중간 구간: 기본값 60봉, 고
IVolX 2 DPOC mt5
Denis Chebatarev
Vol 2 DPOC volume vol 2 DOC-dynamic horizontal volume indicator for any time periods Main settings of the indicator: Volume Source -selecting data for volumes (tick or real) DPOCOn -enabling / disabling the indicator DPOCFrom -calculation start date DPOCTo -settlement end date The indicator allows you to manually select areas on the chart to analyze changes in the maximum volume over time. You can do this by using vertical lines and moving them along the chart. Or by setting specific dates in
First Dawn MT5
Innovicient Limited
The First Dawn indicator uses a unique mechanism to search and plot signals. This keeps searching for signals, making it a great indicator for scaping and identification of changes in direction, swing trading and trend trading. The    First Dawn     helps you get early signals. The backtest gives the true picture of how the indicator works with real/demo accounts. Although this is a tiny indicator it is packed with advantageous settings that will help you whether you desire to: Snap the Peaks a
Nova Liquidity Zones for MT5  Bookmap-Style Liquidity Zones for MetaTrader 5 See Where the Smart Money Hunts Stops — Before They Do. Nova Liquidity Grab Levels is a professional-grade liquidity visualization indicator that maps out where institutional traders place their orders — directly on your MT5 chart, in the iconic Bookmap heat-map style. Stop guessing where price will reverse.  Start seeing where the liquidity pools actually sit. What It Does Major price moves don't happen randomly.
Daily VP Professional
Ammar Nahil Haj Ali
Daily VP Professional – Intraday Volume Profile for MT5 Daily VP Professional is a powerful, institutional-grade Volume Profile indicator built specifically for day traders, scalpers, and market structure analysts on MetaTrader 5. While standard technical indicators rely solely on time-based calculations, Daily VP Professional organizes volume directly by price levels across daily trading sessions. This exposes key institutional accumulation and distribution zones, giving you clear visibility in
FREE
Stop Guessing Market Reversals! Revolutionize Your Trading with Pro-Level Momentum Analysis Have you ever spent hours staring at MACD histograms, struggling to pinpoint whether you're at a cycle peak or a bottom? Many traders miss profitable opportunities simply because they act too late or lack the confidence to execute. MACD Full Structure Box V33 is not just another indicator. It is a powerful Market Structure Analysis assistant designed for traders who value precision, logic, and a systemati
AW Classic MACD MT5
AW Trading Software Limited
4.7 (33)
Modified oscillator MACD. A classic indicator that combines a trend indicator with an oscillator to detect entry points. Has a multi-timeframe panel and 3 types of notifications Benefits: Works on all instruments and timeseries Trend indicator with   oscillator for inputs Multi-period panel on all timeframes Pluggable arrows when signals appear Three types of notifications: push, email, alert MT4 version ->  HERE  / Our news ->  HERE     How the indicator works: AW Classic MACD - Indicator of
FREE
Major Liquidity Sweep and Structural Reversal for MT5 Systematic Historical Swing Sweep Detection and Structural Mean-Reversion Validation Core Concept and Value Proposition Trading immediate breakouts beyond major historical swing extremes frequently leads to sharp drawdowns: price briefly penetrates the level, triggers resting breakout orders, and rapidly snaps back inside the established range. Traders who hesitate during this rejection phase often miss the subsequent structural rotation enti
Veltrion Smart Fibonacci   is a clean automatic Fibonacci structure overlay for MetaTrader 5. It automatically detects recent swing highs and swing lows, then draws key Fibonacci retracement levels directly on the chart. The indicator is designed to help traders visualize market structure, retracement zones, and the golden zone without manually drawing Fibonacci tools. Key Features Automatic swing high and swing low detection Clean Fibonacci retracement overlay Horizontal Fibonacci levels for a
RQL Box MT5
Zoltan Nagy
RQL_BOX Indicator — English Description (How to Use) What it does RQL_BOX is a manual range box tool controlled by two draggable vertical lines: LEFT handle (v-line): selects a candle on a chosen timeframe and sets the box High/Low to that candle’s wicks . RIGHT handle (v-line): defines how far to extend the box to the right (projection end). It then draws: the main box (range), optional top/bottom 20% zones , an optional 50% midpoint line , and an on-chart info panel with key metrics. How to us
FREE
- This is an indicator of directional movement that allows you to determine the trend at the time of its inception and set the levels of a protective stop. Trailing can be carried out both from below, when the stop level is below the current price and is pulled up behind the price if it increases, and above, when stop levels are above the current price. Unlike trailing with a constant distance, the stop level is set at the lower boundary of the quadratic regression channel (in the case of tra
QuantMatrix Probability AI PRO QuantMatrix Probability AI PRO is a technical indicator for MetaTrader 5 designed to evaluate current market conditions and present them as BUY, SELL and NEUTRAL percentage estimates. The indicator combines several market measurements, including trend, momentum, volatility, price position, candlestick wick behavior and breakout conditions. It also compares the current market state with similar historical situations found in the selected symbol and timeframe. The hi
GDS Renko Entry Helper - Free Renko Price Interaction Indicator for MetaTrader 5 GDS Renko Entry Helper is a free Renko price interaction indicator for MetaTrader 5. It helps traders highlight important areas where price reacts, slows down, returns to a zone or changes behavior around support and resistance. The tool is designed for manual Renko analysis. It does not generate buy or sell signals and does not tell the trader when to enter the market. Its purpose is to help focus attention on area
Overview The Williams VIX Fix Indicator is a MetaTrader 5 tool designed to help traders identify potential market tops and bottoms. By analyzing price extremes relative to recent highs and lows, it highlights overbought and oversold conditions using two histograms displayed in a separate window. The indicator combines the Williams VIX Fix calculation with Bollinger Bands and percentile-based thresholds to provide clear signals for potential reversals.  Key Features Market Tops and Bottoms Market
Parabolic Accel
Ich Khiem Nguyen
Momentum Acceleration Breakout MT5 Systematic Directional Candle-Body Expansion and Momentum Acceleration Engine The Momentum Acceleration Breakout indicator for MetaTrader 5 provides an objective analytical framework designed to identify authentic directional momentum expansion within established trends. Entering during periods of low conviction often leaves positions exposed to choppy market drift, while hesitation frequently leads to entries near the exhaustion of a run. This software algorit
AW Breakout Catcher MT5
AW Trading Software Limited
5 (9)
가격 수준 분석, 고급 통계, TakeProfit 계산 및 3가지 유형의 알림. 이익: 결과를 다시 그리지 마십시오 촛불이 닫힐 때 엄격하게 신호를 보냅니다. 거짓 고장 필터링 알고리즘 어떤 트렌드 전략과도 잘 어울립니다. 모든 도구 및 시계열에서 작동 매뉴얼 및 지침 ->   HERE   / 문제 해결 ->   HERE   / MT4 버전 ->   HERE 지표로 거래하는 방법 AW Breakout Catcher와 거래하는 간단한 3단계: 1단계 - 포지션 열기 70% 이상의 성공률로 매수 신호를 받았습니다. 2단계 - StopLoss 결정 반대 신호로 트렁크 선택 3단계 - 이익 실현 전략 정의 전략 1: TP1 도달 시 전체 포지션 청산 전략 2: TP1 도달 시 포지션의 50% 청산 및 TP2 도달 시 나머지 50% 청산 전략 3: 반대 신호에서 전체 포지션 청산 통계 모듈 더 나은 쌍 선택을 위해 내장된 통계 계산을 사용하십시오. 거래 계산 - 통계가 제공되는 총 신호 수
Full Prop Firm Traders Utility Dashboard
Opengates Success International
한국어  PROP-FIRM TRADERS MONITOR DASHBOARD (프로프 트레이더 유틸리티 대시보드) 이 도구는 MetaTrader 5용으로 개발된 강력하고 종합적인 리스크 관리 및 성과 모니터링 대시보드입니다. 프로프 펌(Prop Firm) 트레이더와 개인 트레이더 모두를 위해 설계되었으며, 거래 활동을 실시간으로 완전히 파악하고 제어할 수 있도록 도와줍니다. 대시보드는 계정의 모든 열린 거래와 종료된 거래를 동적으로 분석하고, 핵심 지표를 깔끔하고 읽기 쉬운 인터페이스로 차트 위에 직접 표시합니다. 주요 기능: 통화 및 타임프레임 변경 기능 (외부 파라미터에서 비활성화 가능 – 선택 사항) 브로커 서버 시간 차트 표시 (선택 사항) 캔들 카운트다운 타이머 (선택 사항) 다양한 기능을 갖춘 전체 대시보드: 외부 파라미터 (사용자 입력): 계정 이름: 계정 소유자 이름 계정 유형: 프로프 펌 계정, 개인 계정 등 초기 계정 잔고: 사용자가 입력 일일 드로우다운
Shogun MT5
Agus Santoso
MT4 버전: https://www.mql5.com/en/market/product/139323 MT5 버전: https://www.mql5.com/en/market/product/139324 SHOGUN EA - 정밀 타격 알고리즘 사무라이처럼 규율 있게, 쇼군처럼 치명적으로. SHOGUN은 원샷 전략으로 설계된 완전 자동화된 전문가 자문(EA)입니다. 각 거래는 그리드, 마틴게일, 위험한 평균화 없이 이익실현 및 손절매를 사용하여 정밀하게 실행됩니다. 이 EA는 강력한 다중 지표 융합을 사용하여 최적의 진입 시점을 결정합니다. 시장 약세를 감지하는 베어스 파워. 과매수/과매도 모멘텀을 확인하는 RSI(상대 강도 지수). 추세 반전을 파악하는 AO(어썸 오실레이터). 동적 변동성 필터링을 위한 ATR(평균 진폭). 폭발적인 돌파 가능성을 보장하는 모멘텀. 주요 특징: 원샷 목표가/손절매: 깔끔하고 간단한 거래 - 과다 노출 없음. 다중 지표 로직: 계층화된 확
DMJ Magical AVWAP
Dominic Minguy Jean
Automated Anchored Volume Weighted Average Price You set a period, and the indicator will find the highest and lowest price point in the period and derive a AVWAP from there. It also prints out a median line. You can use the generated VWAP lines as a channel, as S/R levels or as a volatility indicator. It's based on tick volume to be compatible with most CFD brokers. Happy trading!
Revoltix
Abdul Malikul Hanan
Revoltix EA PRO - 다이내믹 스트래들 스캘핑 시스템 패닉 속의 정밀함. Revolt에서의 수익. Revoltix EA PRO는 기관급 리스크 관리로 변동성 돌파를 포착하도록 설계된 정교한 스트래들 스캘핑 시스템입니다. 이 전문가 자문가는 변동성이 큰 시장 조건을 체계적으로 탐색하기 위해 동적 주문 조정 및 다중 계층 안전 프로토콜을 사용합니다. Revoltix Live Signal:   CLICK HERE 핵심 전략 및 기술: 다이내믹 스트래들 시스템:   현재 가격 주변에 BUY STOP/SELL STOP 주문을 자동으로 배치 및 조정하여 어느 방향으로의 돌파도 포착합니다. 변동성 돌파 포착:   고변동성 세션 동안 모멘텀 움직임을 정밀한 진입 관리로 타겟팅합니다. 적응형 주문 관리:   가격 변동 및 시장 조건에 따라 보류 중인 주문을 지속적으로 모니터링하고 조정합니다. 다중 시간대 세션 제어:   구성 가능한 거래 세션 (아시아, 고변동성, 사용자 정의) 및 자동
Title:   Bollinger Bands & RSI Strategy Indicator Description:   This indicator combines Bollinger Bands and the RSI to analyze price action. It plots the middle, upper, and lower Bollinger bands directly on your chart. Additionally, it provides visual signals (arrows and triangles) for RSI overbought/oversold conditions and price breakouts beyond the bands. It is an ideal tool for trend following and reversal strategies.
DirectionBias4 Pro
Luigi Salvatores Buigues Morillo
DirectionBias4 Pro is an institutional-grade algorithmic trading system designed for serious traders and Prop Firm challengers. Unlike traditional indicators that rely on a single lagging moving average, DB4 Pro uses an advanced Weighted Scoring Engine to evaluate the market from three different dimensions simultaneously, filtering out fake breakouts and market noise. Developed by Luis Buigues (binaryoption.cloud), this system has been rigorously backtested and Out-Of-Sample validated. Core S
MT4 version -   https://www.mql5.com/ru/market/product/69932 Unlike other indicators of this type, this version has: The ability to display data from smaller timeframes on the current chart. For example, displaying data from the M1 period on the H1 chart. Calculation of values ​​using the Gaussian formula (normal distribution formula). Flexible system of settings. Settings: basePeriod   - base period. indicatorMode  - display mode. Sets the value of each interval:   by4h   (4 hours),   by6h  
Based on the Dow Theory, the system automatically draws a turning point, which is the starting point for buying or selling. It also automatically tells you whether the market is in a buying or selling condition and recognizes the environment. It is also a good tool to prevent false trades and to make profitable trades. We are live-streaming the actual operation of the system. Please check for yourself if it is usable. Please check it out for yourself. https://www.youtube.com/@ganesha_forex We
이 제품의 구매자들이 또한 구매함
Trend Sniper X
Sarvarbek Abduvoxobov
4.9 (41)
Trend Sniper X 는 트레이더가 추세 방향과 잠재적 반전 지점을 명확하고 정확하게 포착할 수 있도록 도와주는 MetaTrader 5용 멀티 타임프레임 추세 추종 지표입니다. MT4용: https://www.mql5.com/en/market/product/193245 가격 정보: 현재 가격은 프로모션 할인가이며, 향후 업데이트 및 새로운 기능이 출시됨에 따라 변동될 수 있습니다. 보너스 혜택: 본 지표 전용 무료 자동매매 Assistant EA를 받으시려면 구매 후 작성자에게 메시지를 보내주시기 바랍니다. Code2Profit 채널 멀티 타임프레임 분석으로 시장을 마스터하세요! Trend Sniper X로 승률을 극대화하는 방법: 핵심 규칙 및 세션 팁 기술 사양 플랫폼 MetaTrader 5 지표 유형 멀티 타임프레임 추세 지표 운용 타임프레임 모든 차트 타임프레임 지원, 독립적으로 선택 가능한 상위 타임프레임(M1–MN1) 주요 상품 외환, 금(XAUUSD) 및 기타 C
Smart Trend Trading System — MetaTrader 5 구매 후 MQL5에서 저에게 메시지를 보내시면 Smart Universal Expert Advisor를 무료로 받으실 수 있으며, 온라인 강좌, PDF 매뉴얼 및 비공개 그룹 이용 권한도 함께 제공됩니다. STTS는 추세 방향, 진입·청산 신호, 반전 구간, 주요 가격 수준을 차트에 모아 보여줍니다. 시스템을 참고해 수동으로 거래하거나, 별도의 호환 EA를 연결하여 선택한 설정에 따라 자동으로 거래를 실행할 수 있습니다. 하나의 시스템, 네 가지 트레이딩 접근법 STTS의 트레이딩 접근법은 크게 네 가지로 나뉩니다. • 스캘핑 — 단기 신호와 시장 움직임을 살펴봅니다. • 추세 매매 — 방향을 평가하고 추세 안에서 기회를 찾습니다. • 반전 매매 — 잠재적인 전환 구간과 방향 변화를 파악합니다. • 거래량 매매 — 거래량 기반 정보로 시장 활동을 평가합니다. 진입·청산 화살표, 추세 정보, 지지·저항 수
SuperScalp Pro
Van Minh Nguyen
4.56 (36)
SuperScalp Pro - Professional Multi-Layer Confluence Scalping System SuperScalp Pro는 클래식 Supertrend에 여러 지능형 확인 필터를 추가한 고급 스캘핑 지표입니다. 더 높은 확률의 Buy/Sell 거래 기회를 식별하는 데 도움을 주며, 잘못된 신호를 크게 줄이는 데 도움을 줍니다. 명확한 Buy 및 Sell 화살표가 차트에 직접 표시되며, ATR 기반 Stop Loss 및 Take Profit 수준이 실시간으로 자동 계산됩니다. 구매 후 설정 방법 및 권장 구성에 대한 안내가 필요하시면 저에게 문의해 주세요. SuperScalp Pro Auto Trader를 사용하여 신호를 쉽게 자동화할 수 있습니다: [Auto Trader] 권장 설정 파일 다운로드: [Set File] 전체 문서는 제품 블로그에서 확인할 수 있습니다: [User Guide] 업데이트를 확인하려면 공식 채널에 참여하세요: [Official C
새로운 왕의 등장 - 인디케이터 + 주문 관리 표시(TP1 + TP2 + TP3) + 선택형 텔레그램 시그널 전송 기능 포함 (무료) (완전한 트레이딩 및 시그널 시스템) 골드를 위한 최고의 EA: Gold Slayer 이 인디케이터는 고급 전략, 사용자 지정 가능한 주문 관리 시스템, 그리고 엔벨로프 확장을 결합한 평균 회귀(mean reversion) 시스템을 포함하고 있습니다. 또한 RSI와 같은 여러 지능형 확인 필터를 통해 높은 확률의 반전 진입 구간을 포착하여 BUY 및 SELL 시그널을 제공합니다. 단순히 거래 방법만 배우는 것이 아니라, 여러 포지션을 효과적으로 관리하고 이전에 수익 중인 오픈 포지션으로 손실 거래를 커버하는 방법까지 익힐 수 있습니다. M5 전용으로 설계 및 최적화되었으며, 유동성이 풍부해 시그널이 더 깔끔하고 신뢰도 높은 BTCUSD와 XAUUSD에서 뛰어난 성능을 발휘합니다. 이 인디케이터는 ATR 기반으로 자동 계산된 진입가, 손절가, 익절가와
SMC Intraday Formula
VividMind Digital Solutions
5 (26)
먼저 솔직하게 말하겠습니다. 어떤 인디케이터도 단독으로 당신을 수익성 있게 만들어주지 않습니다. 누군가 그렇게 말한다면, 그는 당신에게 꿈을 파는 것입니다. 완벽한 매수/매도 화살표를 보여주는 모든 인디케이터는 완벽하게 보이도록 만들 수 있습니다 — 단지 올바른 과거 구간을 확대하고 승리한 거래만 캡처하면 됩니다. 우리는 그렇게 하지 않습니다.  SMC Intraday Formula는 도구입니다. 시장 구조를 읽고, 가장 높은 확률의 가격 구간을 표시하며, 현재 스마트 머니의 흐름이 어떻게 보이는지 아주 단순한 언어로 보여줍니다. 최종 결정은 여전히 당신이 합니다. 실행도 당신이 합니다. 하지만 이제는 희망이 아니라 정확성으로 거래하게 됩니다. 우리는 이 인디케이터를 지난 약 3년 동안 골드(XAUUSD) 및 주요 외환 통화쌍의 데이 트레이딩 스캘핑에 사용해 왔습니다. M1, M5, M15, M30에서 우리의 핵심 도구입니다. 이 도구는 미래를 예측하려 하지 않습니다 — 지금 형성
Entry Points Pro for MT5
Yury Orlov
4.52 (151)
전설이 돌아왔습니다: Entry Points Pro 10. MQL5 마켓 Top-3 자리를 3년간 지켜온 전설적인 지표의 재출시입니다. 수백 개의 호평 리뷰(두 버전 합산 589개), 매일 이 지표로 거래하는 수천 명의 트레이더, 31,000회 이상의 데모 다운로드   MT4+MT5 . 지난 5년간 여러분이 남긴 리뷰를 하나도 빠짐없이 읽었고, 약속 대신 그 답을 버전 10에 담았습니다. 1999년부터 시장에서 활동하며 정직함과 자신의 평판, 그리고 고객을 소중히 여기는 개발자가 만들었습니다. Entry Points Pro의 진입 시그널은 절대 리페인팅되지 않습니다. 그리고 이번에는 개발자의 말뿐이 아니라 검증 가능한 사실입니다: 확정 시그널은 캔들 종가에서만 표시되며, 자동화 테스트에서 리페인팅 0건 이 확인되었습니다(EURUSD, XAUUSD, BTCUSD에서 2,486,568회의 불변조건 검사 — 위반 0건). 검증 방법은 공개되어 있으니 전략 테스터에서 직접 재현해 보실 수
Gann Made Easy MT5
Oleg Rodin
5 (10)
Gann Made Easy 는 mr.의 이론을 사용하여 최고의 거래 원칙을 기반으로 하는 전문적이고 사용하기 쉬운 Forex 거래 시스템입니다. W.D. 간. 이 표시기는 Stop Loss 및 Take Profit Levels를 포함하여 정확한 BUY 및 SELL 신호를 제공합니다. PUSH 알림을 사용하여 이동 중에도 거래할 수 있습니다. 구매 후 거래 방법 안내 및 유용한 추가 지표를 무료로 받으시려면 저에게 연락주세요! 아마도 Gann 거래 방법에 대해 이미 여러 번 들었을 것입니다. 일반적으로 Gann의 이론은 초보자 거래자뿐만 아니라 이미 거래 경험이 있는 사람들에게도 매우 복잡한 것입니다. Gann의 거래 방식은 이론적으로 적용하기 쉽지 않기 때문입니다. 나는 그 지식을 연마하고 Forex 지표에 최고의 원칙을 적용하기 위해 몇 년을 보냈습니다. 표시기는 적용하기가 매우 쉽습니다. 차트에 첨부하고 간단한 거래 권장 사항을 따르기만 하면 됩니다. 지표는 지속적으로 시장 분석
당신의 트레이딩 우위를 한눈에 확인하세요! M5 Sniper 는 MeanFX의 새로운 지표입니다. 정확한 트레이딩 신호 와 적응형 TP/SL 레벨 을 결합하여, 결과적으로 가능한 최고의 통계적 트레이딩을 만들어냅니다! 5회 구매마다 가격이 인상되며, 다음 가격은 69$입니다. 구매 후 저에게 메시지를 보내주시면 팁/가이드와 보너스 EA를 제공해 드립니다. 무엇이 이 지표를 특별하게 만들까요? Gold XAUUSD에서 검증된 통계적 성과 ( 거의 모든 자산에서 작동 하며, 일관된 결과 없이 모든 것을 다루려고 하기보다는 하나의 타임프레임을 완전히 익히는 데 집중합니다) 각 심볼당 하루 1~8회의 트레이드 와 높은 승률을 제공하며, 모든 통계적 우위를 우리의 편으로 가져갑니다. 차트에는 확인된 BUY 및 SELL 신호만 표시됩니다. 각 트레이드에 대해 지표가 생성하는 적응형 TP 및 SL 레벨 평균 승률 75%+ 평균 Signal Ratio 최소 1.1+ 알람 및 알림이 휴대폰 으로도
Neuro Poseidon MT5
Daria Rezueva
4.75 (52)
Neuro Poseidon is a new indicator by Daria Rezueva. It combines precise trading signals with adaptive TP/SL levels - creating best possible trades as a result! Message me and get  Neuro Poseidon Assistant  as a gift to automize your trading process! What makes it stand out? 1. Proven profitability on all assets and timeframes 2. Only confirmed BUY and SELL signals present on the chart 3. Adaptive TP & SL levels generated by the software for each trade 4. Easy to understand - suitable for al
Auto Optimized SpeedAngle 은 지속적인 워크포워드 최적화(Walk-Forward Optimization, WFO)를 통해 곡선 적합(curve-fitting)을 제거한 기관 수준의 모멘텀 벡터화 시스템입니다. 시장 체제가 바뀔 때 성능이 떨어지는 정적 입력에 의존하는 대신, 이 지표는 표본 외(Out-of-Sample, OOS) 검증을 사용하여 매개변수를 동적으로 재보정하며, 표시되는 신호가 과거의 우연이 아닌 진정한 통계적 우위를 나타내도록 보장합니다. 핵심 기관용 프레임워크 워크포워드 최적화 엔진: 핵심 알고리즘은 수천 가지의 룩백(lookback) 및 임계값 조합을 지속적으로 스캔하며, 데이터를 인샘플(in-sample)과 표본 외(out-of-sample) 세트로 엄격하게 분리합니다. 미지의 데이터 환경에서 수학적 우수성이 증명된 경우에만 새로운 매개변수 구성을 채택합니다. 정량적 목적 함수: 순수한 총이익을 쫓는 대신, 최적화 엔진은 기관 수준의 안정성
안녕하세요, 트레이더 여러분! 많은 개인 투자자들이 느린 웹 스크립트에 의존하고 있습니다. 수익성 있는 거래를 위해서는 체계적인 프레임워크가 필수적입니다. Astro AI 지표는 단순한 차트 오버레이가 아닙니다. 터미널에서 직접 실행되는 두 개의 에이전트로 구성된 정교한 신경망입니다. 시스템 기술 상세 설명: 1. 에이전트 1: 분석가 (그래픽 신경망 – GNN) 시장은 개별 가격 막대로 이루어진 것이 아니라 상호 연결된 데이터 네트워크입니다. 기능: 에이전트 1은 그래픽 신경망을 사용하여 이러한 복잡하고 비선형적인 관계를 파악합니다. 장점: 기존 지표는 과거 이동 평균만을 고려하는 반면, 저희 GNN은 시장의 심층적인 구조적 관계를 실시간으로 처리하여 개별 트레이더의 거래량이 시장에 큰 영향을 미치기 전에 숨겨진 상관관계를 찾아냅니다. 2. 에이전트 2: 실행기 (근접 전략 최적화 – PPO) 패턴 인식은 절반의 성공일 뿐입니다. 현재 시장 변동에 기반하여 올바른
Adaptive Price Action Engine 지표를 구매하면 EA(자동매매 프로그램)가 무료 멀티 타임프레임 기반 자기 최적화 추세 & 캔들 패턴 분석 시스템 시장은 끊임없이 변화하며, 모든 Price Action 패턴이 모든 시장 환경에서 동일한 가치를 가지는 것은 아닙니다. Adaptive Price Action Engine 은 변화하는 시장 환경에 적응할 수 있도록 설계되었으며, 추세 구조, 멀티 타임프레임 분석, 캔들 패턴 및 통계적 최적화 를 하나의 분석 프레임워크로 결합합니다. 두 가지 적응형 모드 Dual Alpha Trend Mode 낮은 타임프레임과 높은 타임프레임에서 적합한 Alpha Trend 파라미터를 자동으로 탐색하여, 최근 시장 움직임에 맞춰 추세 분석을 조정합니다. Candlestick + Alpha Mode Alpha Trend를 통한 시장 국면 분석과 22개의 상승 및 하락 캔들 패턴 을 결합합니다. 모든 패턴을 동일하게 취급하는 대신, 다양
Welcome to ENTRY IN THE ZONE AND SMC MULTI TIMEFRAME  SPECIAL BENEFIT / FOR OUR MQL5 CUSTOMERS FREE ACCESS TO THE NEW TOOL  — COMING SOON — Learn more on our official website  : https://www.fableedge.net YouTube Channel : 24/7 LIVE SIGNALS  :   https://www.youtube.com/@FableEdgeView Entry In The Zone and SMC Multi Timeframe is a real-time market analysis tool based on Smart Money Concepts (SMC) , designed to analyze market structure, price direction, and key trading zones. It supports both Sing
M1 Sniper MT5
Oleg Rodin
5 (7)
M1 SNIPER 는 사용하기 쉬운 거래 지표 시스템입니다. M1 시간대에 맞춰 설계된 화살표 지표입니다. 이 지표는 M1 시간대 스캘핑을 위한 단독 시스템으로 사용할 수 있으며, 기존 거래 시스템의 일부로도 사용할 수 있습니다. 이 거래 시스템은 M1 시간대 거래용으로 특별히 설계되었지만, 다른 시간대에도 사용할 수 있습니다. 원래는 XAUUSD와 BTCUSD 거래를 위해 이 방법을 설계했지만, 다른 시장 거래에도 유용하다는 것을 알게 되었습니다. 이 지표의 신호는 추세 방향과 반대로 거래될 수 있습니다. 저는 지표의 신호를 활용하여 양방향으로 거래할 수 있도록 돕는 특별한 거래 기법을 알려드립니다. 이 방법은 특별한 동적 지지선과 저항선 가격 영역을 활용하는 것을 기반으로 합니다. 구매하시면 M1 SNIPER 화살표 지표를 바로 다운로드하실 수 있습니다. 또한, 아래 스크린샷에 표시된 Apollo Dynamic SR 지표는 M1 SNIPER 도구를 사용하는 모든 사용자에게 무료로
Divergence Bomber
Ihor Otkydach
4.89 (94)
이 지표를 구매하신 분께는 다음과 같은 혜택이 무료로 제공됩니다: 각 거래를 자동으로 관리하고, 손절/익절 수준을 설정하며, 전략 규칙에 따라 거래를 종료하는 전용 도우미 툴 "Bomber Utility" 다양한 자산에 맞게 지표를 설정할 수 있는 셋업 파일(Set Files) "최소 위험", "균형 잡힌 위험", "관망 전략" 모드로 설정 가능한 Bomber Utility의 셋업 파일 이 전략을 빠르게 설치, 설정, 시작할 수 있도록 돕는 단계별 영상 매뉴얼 주의: 위의 모든 보너스를 받기 위해서는 MQL5 개인 메시지 시스템을 통해 판매자에게 연락해 주세요. 독창적인 커스텀 지표인 “Divergence Bomber(다이버전스 봄버)”를 소개합니다. 이 지표는 MACD 다이버전스(괴리) 전략을 기반으로 한 올인원(All-in-One) 거래 시스템입니다. 이 기술 지표의 주요 목적은 가격과 MACD 지표 간의 다이버전스를 감지하고, **향후 가격이 어느 방향으로 움직일지를 알려주
Unix Scalper
Issam Kassas
4 (4)
Unix Scalper — MetaTrader 5 구매 후 MQL5에서 저에게 메시지를 보내시면 Smart Universal Expert Advisor를 무료로 받으실 수 있으며, 온라인 강좌, PDF 매뉴얼 및 비공개 그룹 이용 권한도 함께 제공됩니다. 매매 기회를 찾고, 거래 계획을 확인하고, 실행 방법을 선택하세요. UNIX Scalper는 시장 분석, BUY/SELL/WAIT 판단, Entry, Stop Loss, TP1 및 TP2 가격 수준을 하나의 정돈된 패널에 제공합니다. 신호와 거래 계획을 한눈에 • 명확한 판단: BUY, SELL 또는 WAIT. • 구체적인 가격 수준: Entry, Stop Loss, TP1 및 TP2. • 다중 시간대 개요: 패널의 여러 시간대 신호를 비교하세요. • 판단을 돕는 분석: 추세, 모멘텀, 거래량, 변동성, 지지와 저항, 시장 품질. • 다양한 레이아웃: Minimized, Compact, Standard 또는 Full. 신호와
Scalper Vault 는 성공적인 스캘핑에 필요한 모든 것을 제공하는 전문 스캘핑 시스템입니다. 이 표시기는 외환 및 바이너리 옵션 거래자가 사용할 수 있는 완전한 거래 시스템입니다. 권장 시간 프레임은 M5입니다. 시스템은 추세 방향으로 정확한 화살표 신호를 제공합니다. 또한 상단 및 하단 신호와 Gann 시장 수준을 제공합니다.  이 시스템은 사용하기가 매우 쉽습니다. 원하는 시장 지역의 화살표만 따라가면 됩니다. 엑시트는 가격이 적정 수준에 도달하거나 시장의 고점 또는 저점 신호가 나타날 때 수행됩니다.  표시기는 PUSH 알림을 포함한 모든 유형의 경고를 제공합니다. 인디케이터 구매 후 연락주세요. 내 개인 거래 권장 사항과 훌륭한 보너스 지표를 무료로 공유합니다! 나는 당신에게 행복하고 유익한 거래를 기원합니다!
Tokyo mt5 Indicator
Vasiliy Strukov
5 (8)
Tokyo Indicator는 추세 방향, 잠재적 거래 신호 및 시장 상황을 명확하고 시각적으로 보여줍니다. 색상으로 구분된 계단식 추세선은 강세 구간(파란색)과 약세 구간(자홍색)을 명확히 구별해 줍니다. 추세가 전환될 때 나타나는 방향성 화살표는 잠재적인 매수 및 매도 기회를 강조하여 보여줍니다. 통합 대시보드는 현재 신호, 시장 성향(bias), 모멘텀, 변동성, 신호 품질 등의 정보를 한눈에 파악할 수 있도록 구성되어 있습니다. 이를 통해 트레이더는 별도의 패널을 오갈 필요 없이 가격 움직임(price action)과 지표의 데이터를 동시에 분석할 수 있습니다. 깔끔한 차트 화면과 간결한 시장 개요를 제공하는 Tokyo Indicator는 체계적인 추세 분석과 거래 결정을 지원합니다. 모든 시간대와 다양한 자산(특히 금)에서 활용할 수 있습니다. 추세 방향, 잠재적 거래 신호 및 시장 상황을 명확하고 시각적으로 보여줍니다. 색상으로 구분된 계단식 추세선은 강세 구간(파란색)
RelicusRoad Pro MT5
Relicus LLC
4.96 (25)
거래를 더 이상 감으로 하지 마세요. 언제 진입할지, 어디서 청산할지, 시장이 어느 쪽으로 기울어 있는지를 한 차트에서 확인하세요. RelicusRoad Pro는 20개 가까운 도구를 인디케이터 하나에 담았고, 내 매매 방식에 맞는 도구만 켜서 쓰면 됩니다. 명확한 진입. 명확한 청산. 차트마다 확실한 계획. 이런 경험, 익숙하지 않으신가요? 매수하면 1분 뒤 가격이 반대로 돌아섭니다. 너무 일찍 청산하고, 그다음 움직임이 나 없이 이어지는 것을 지켜봅니다. 지표를 5개 띄우면 답도 5가지가 나옵니다. 손절(스톱로스)은 그냥 감입니다. 우리가 이걸 만든 이유 우리는 18년 동안 외환 거래를 해 왔습니다. RelicusRoad는 처음에 우리끼리 쓰려고, 전문 트레이더 모임을 위해 비공개로 만들었습니다. 이유는 개인적이었습니다. 같은 선을 손으로 계속 그리는 일에 지쳤고, 스스로 정한 규칙을 어기고, 차트에서 정말 중요한 한 가지를 놓치곤 했습니다. 우리에게 통한 것은 일관성입니다. 매
FiboSniper Pro
Van Minh Nguyen
5 (3)
FiboSniper Pro – Multi-Filter Fibonacci System with Auto SL/TP and Control Panel FiboSniper Pro는 동적 Fibonacci Envelopes와 여러 확인 필터를 결합하여 선별된 Buy 및 Sell 신호를 생성하는 기술적 지표입니다. Fibonacci 레벨은 Moving Average와 ATR을 기반으로 계산된 후 ADX, EMA, RSI, ATR, Volume, Time 및 Candle 구조를 통해 필터링됩니다. 이 지표는 ATR 기반의 자동 Stop Loss 및 Take Profit 레벨을 차트에 직접 표시하며, 빠른 설정 조정을 위한 인터랙티브 Control Panel을 제공합니다. 구매 후 권장 설정 파일과 자세한 사용 방법을 받으려면 저에게 문의해 주세요. Auto Trader X를 사용하여 FiboSniper Pro 신호를 자동화할 수 있습니다: [Auto Trader X] User Guide 및 Se
Market Structure Order Block Dashboard MT5는 시장 구조와 주요 가격 반응 구역을 차트에서 직접 읽고자 하는 트레이더를 위해 설계된 MT5 지표입니다. BOS, ChoCH, 오더 블록, Fair Value Gap (FVG), 유동성, Kill Zones, Volume Profile 그리고 빠른 분석을 위한 콤팩트한 대시보드를 결합합니다. 이 지표는 시장 구조, ICT 및 Smart Money 개념을 의사결정 프레임워크로 사용하는 트레이더를 대상으로 합니다. 추세 지속, 가능한 반전, 가격 불균형, 유동성 타겟 및 관심 구역을 보다 체계적으로 식별하는 데 도움을 줄 수 있습니다. 구매자를 위한 포함 리소스 구매 후 MQL5 개인 메시지로 요청하시면 완전한 PDF 사용 설명서와 파라미터 설정 팁을 제공해 드립니다. MQL5 개인 메시지를 통한 직접 기술 지원. 1.20 버전은 두 가지 주요 추가 기능을 제공합니다: Pending BOS / Pending
소개       Quantum Breakout PRO   , 브레이크아웃 존 거래 방식을 변화시키는 획기적인 MQL5 지표! 13년 이상의 거래 경험을 가진 숙련된 트레이더 팀이 개발한       퀀텀 브레이크아웃 PRO       혁신적이고 역동적인 브레이크아웃 존 전략으로 거래 여정을 새로운 차원으로 끌어올리도록 설계되었습니다. Quantum Breakout Indicator는 5개의 이익 목표 영역이 있는 브레이크아웃 영역의 신호 화살표와 브레이크아웃 상자를 기반으로 한 손절 제안을 제공합니다. 초보자 거래자와 전문 거래자 모두에게 적합합니다. Quantum EA 채널:       여기를 클릭하세요 중요한! 구매 후 설치 매뉴얼을 받으려면 개인 메시지를 보내주십시오. 추천: 기간: M15 통화쌍: GBPJPY, EURJPY, USDJPY,NZDUSD, XAUUSD 계정 유형: 스프레드가 매우 낮은 ECN, Raw 또는 Razor 브로커 시간: GMT +3 중개인 :
Trend Catcher ind mt5
Ramil Minniakhmetov
5 (18)
트렌드 캐처 인디케이터 트렌드 캐처 인디케이터는 개발자가 자체 개발한 맞춤형 적응형 트렌드 분석 지표들을 조합하여 시장 가격 움직임을 분석합니다. 단기적인 노이즈를 제거하고 근본적인 모멘텀 강도, 변동성 확대, 가격 구조 움직임에 집중하여 진정한 시장 방향을 파악합니다. 또한 이동 평균, RSI, 변동성 필터와 같은 맞춤형 지표들을 활용하여 가격을 평활화하고 트렌드를 필터링합니다. 실제 운영 모니터링 및 기타 제품은 다음 링크에서 확인하실 수 있습니다:   https://www.mql5.com/en/users/mechanic/seller 텔레그램에서는 EA나 설정 파일을 판매하지 않습니다. 사기이니 주의하세요. 모든 설정 파일은 블로그에서 무료로 제공됩니다. 중요! 구매 후 즉시 연락 주시면 사용 방법 및 보너스를 드립니다!
Quant Direction MT5
Georgios Kalomoiropoulos
Quant Direction 은 3D 시장 분석 도구입니다. 다양한 매개변수에 걸쳐 정확한 백분율 편차를 계산하면서 완벽하게 객관적인 알고리즘 기반 시장 분석을 제공합니다. 첨단 AI 기반 모델링 도구와 엄격한 테스트를 거쳐 개발된 이 알고리즘은 타의 추종을 불허하는 정확도로 시장을 분석합니다. 플랫폼에서 모든 통화쌍 또는 금융 상품을 분석할 수 있습니다. 단기 거래, 데이 트레이딩, 스윙 트레이딩 등 어떤 유형의 거래를 하든 Quant Direction은 최적의 선택입니다. 운영자가 되는 것의 진정한 이점 퀀트 디렉션의 진정한 장점은 감정, 눈의 피로, 과도한 분석을 완전히 배제한다는 점입니다. 더 이상 수십 개의 차트를 일일이 살펴보며 방향을 찾거나 자신의 판단에 끊임없이 의문을 품을 필요가 없습니다. 이 시스템은 8개의 시간 간격(5개월에서 수개월까지)을 밀리초 단위로 처리합니다. 특정 시점의 주요 시장 참여자를 정확하게 식별하여 항상 성공 확률이 가장 높은 방향으로 거래할
Volatility Master for MetaTrader is a real-time dashboard tool that scans up to  50 symbols  to identify high-volatility , trending markets instantly. With bullish/bearish signals, customizable alerts, and a user-friendly interface, it helps you avoid range-bound conditions and focus on high-probability trades. Clarity leads to confidence. Trade confidently and protect your capital effectively with this powerful dashboard. We don't offer free or bonus indicators in exchange of reviews from you.
Quantum TrendPulse
Bogdan Ion Puscasu
5 (26)
SuperTrend   ,   RSI   ,   Stochastic   의 힘을 하나의 포괄적인 지표로 결합하여 트레이딩 잠재력을 극대화하는 궁극의 트레이딩 도구   인 Quantum TrendPulse를   소개합니다. 정밀성과 효율성을 추구하는 트레이더를 위해 설계된 이 지표는 시장 추세, 모멘텀 변화, 최적의 진입 및 종료 지점을 자신 있게 식별하는 데 도움이 됩니다. 주요 특징: SuperTrend 통합:   주요 시장 추세를 쉽게 따라가고 수익성의 물결을 타세요. RSI 정밀도:   매수 과다 및 매도 과다 수준을 감지하여 시장 반전 시점을 파악하는 데 적합하며 SuperTrend 필터로 사용 가능 확률적 정확도:   변동성이 큰 시장에서 숨겨진 기회를 찾기 위해 확률적 진동   을 활용하고 SuperTrend의 필터로 사용 다중 시간대 분석:   M5부터 H1 또는 H4까지 다양한 시간대에 걸쳐 시장을 최신 상태로 유지하세요. 맞춤형 알림:   맞춤형 거래 조건이 충족되면
FX Trend MT5 NG
Daniel Stein
5 (6)
FX Trend NG: 차세대 멀티 마켓 트렌드 인텔리전스 개요 FX Trend NG 는 다중 시간 프레임 기반의 전문 트렌드 분석 및 시장 모니터링 도구입니다. 몇 초 만에 전체 시장 구조를 파악할 수 있도록 설계되었습니다. 여러 차트를 일일이 전환할 필요 없이, 어떤 종목이 추세에 있는지, 어디에서 모멘텀이 약화되고 있는지, 그리고 어떤 시간 프레임이 서로 정렬되어 있는지 즉시 확인할 수 있습니다. 출시 기념 특별 혜택 – FX Trend NG 를 $30 (6개월) 또는 $80 평생 라이선스 로 이용할 수 있습니다. 이미 Stein Investments 고객이신가요? -> 메시지를 보내 전용 고객 그룹에 참여하세요. 설정이나 사용 방법이 필요하신가요? -> Stein Investments 공식 페이지 를 방문하세요. 1. FX Trend NG가 특별한 이유 3단계 추세 로직 – 단순한 Buy / Sell이 아닙니다 • 대부분의 지표는 Buy 또는 Sell 두 가지 상태만 제
Reversal Master for MT5
Alexey Minkov
5 (1)
Reversal Master for MT5 Reversal Master for MT5 is a non‑repainting reversal indicator for MetaTrader 5. It helps you detect potential market reversal points and shows the maximum favourable price movement after each historical signal, so you can better understand how price behaved after similar situations in the past. The MT5 version keeps the familiar reversal‑signal logic of the original Reversal Master for MT4, but adds improved visualisation, historical statistics and a points summary panel
Atomic Analyst MT5
Issam Kassas
4.47 (60)
Atomic Analyst — MetaTrader 5 구매 후 MQL5에서 저에게 메시지를 보내시면 Smart Universal Expert Advisor를 무료로 받으실 수 있으며, 온라인 강좌, PDF 매뉴얼 및 비공개 그룹 이용 권한도 함께 제공됩니다. Atomic Analyst는 가격 움직임 분석, 추세 방향, 진입·청산 신호, 손절 수준, 여러 익절 수준을 차트에 모아 보여줍니다. 신호를 확인하고 매매 상황을 이해하세요 Atomic Analyst는 분석 결과를 명확한 시각 정보로 정리합니다. • 잠재적인 진입 기회를 확인할 수 있는 매수·매도 화살표. • 거래 계획에 도움이 되는 손절 수준과 여러 익절 수준. • 시장 방향을 평가할 수 있는 추세, 강도, 모멘텀 수치. • 더 넓은 시장 맥락을 비교할 수 있는 여러 시간대 분석. • 변화하는 시장 상황을 따라갈 수 있는 색상별 캔들과 알림. 신호와 보조 분석을 함께 검토한 다음, 해당 매매 상황이 자신의 거래 규칙에
Axiom Matrix
Issam Kassas
5 (8)
구매 후 MQL5에서 저에게 메시지를 보내시면 Smart Universal Expert Advisor를 무료로 받으실 수 있으며, 온라인 강좌, PDF 매뉴얼 및 비공개 그룹 이용 권한도 함께 제공됩니다. 시장을 탐색하세요. 기회를 비교하세요. 다음 차트를 선택하세요. Axiom Matrix (MetaTrader 5)는 여러 종목과 시간대의 분석을 하나의 대시보드에 모읍니다. 모든 차트를 따로 확인하지 않고 집중할 시장을 찾으세요. 종합시세 또는 선택한 종목을 여러 시간대에서 탐색. 추세, 모멘텀, 거래량, 변동성 및 시장 품질 정보 비교. Best Axiom Pick, 신호 상태 및 클릭 가능한 셀로 거래 조건 확인. Axiom Matrix는 분석 대시보드이며 거래를 실행하지 않습니다. 스크린샷으로 인터페이스를 살펴보고 구매자 리뷰를 확인하세요. 제품 문의, 설정 안내 또는 기술 지원이 필요하면 MQL5에서 직접 메시지를 보내 주세요. — Issam 거래에는 위험이 따릅니다. 과거
제작자의 제품 더 보기
Dynamic Fibonacci Grid
Tsvetan Tsvetanov
5 (1)
MT5용 Dynamic Fibonacci Grid Dashboard 최신 버전을 소개합니다. 많은 새로운 기능이 추가된 이번 대시보드는 거래 경험을 완전히 변화시키며, 시장과 가격 움직임을 완전히 새로운 관점에서 볼 수 있게 합니다. 여러 시간대와 여러 심볼을 동시에 분석하여 새로운 가능성을 발견하세요. 수동 거래와 포지션 관리에 친화적인 사용자 인터페이스와 미리 정의된 자동 전략을 적용할 수 있는 확장된 기능을 제공합니다. 또한 DFG는 이제 전략 테스터(Strategy Tester)에서 트레이딩 시뮬레이터로 완벽하게 작동하며, 과거 데이터를 사용하여 다양한 거래 조건을 재현할 수 있습니다. 시각 모드에서 수동 거래를 연습하고, 고속 모드에서 자동 전략을 테스트할 수 있습니다. 주요 기능 • Dynamic Fibonacci Bands 개념을 기반으로 한 다중 시간대 및 다중 심볼 고급 기술 분석 실시간 시장 모니터링 대시보드를 통해 탁월한 효율성을 경험할 수 있습니다. M1,
일중 통화 강도를 그래픽으로 표현한 것입니다. 계산은 28개 통화쌍을 기반으로 합니다. 값은 일일 캔들 시작 시간부터 현재까지 추적됩니다. 이 지표는 원래 FX28 Trader 대시보드용 무료 도구로 개발되었습니다. 이제 무료로 사용하실 수 있습니다. 이 지표는 다양한 사용자 정의 설정을 제공하며, FX28 Trader 차트 제어 시스템에 직접 연결할 수도 있습니다. 참고! 이 지표는 전략 테스터에서 작동하지 않습니다. 테스트하려면 라이브 차트에서 다운로드하여 설치해야 합니다. 일중 통화 강도를 그래픽으로 표현한 것입니다. 계산은 28개 통화쌍을 기반으로 합니다. 값은 일일 캔들 시작 시간부터 현재까지 추적됩니다. 이 지표는 원래 FX28 Trader 대시보드용 무료 도구로 개발되었습니다. 이제 무료로 사용하실 수 있습니다. 이 지표는 다양한 사용자 정의 설정을 제공하며, FX28 Trader 차트 제어 시스템에 직접 연결할 수도 있습니다. 참고! 이 지표는 전략 테스터에서 작동하
FREE
DFG Chart
Tsvetan Tsvetanov
The DFG Chart Indicator displays the historical DFG levels used in the DFG dashboard. These levels are generated dynamically using moving averages and Fibonacci ratios. The Fibonacci Bands automatically adjust to reflect changes in the price range and trend direction. The indicator also features buttons for selecting chart symbol and timeframe, along with a wide range of customization options. Key Features Dynamic DFG Levels Automatically calculated using moving averages and Fibonacci ratios. H
FREE
SDX Chart
Tsvetan Tsvetanov
4.5 (2)
The SDX Chart is a free additional indicator which can be used in combination with SDX Dashboard . Features Ability to review the history of each symbol and time frame. Ability to change symbols and time frames with one click. Works perfectly in combination with SDX Dashboard and helps you to understand the system better. Settings MA Period - number of periods for the calculation of the moving average and the standard deviation. Number of Bars - how far back to draw the indicator. Buttons Size
FREE
Custom Pivots
Tsvetan Tsvetanov
4 (4)
Pivots Points are significant levels traders can use to determine directional movement, support and resistance. Pivot Points use the prior period's high, low and close to formulate future support and resistance. In this regard, Pivot Points are predictive and leading indicators. Pivot Points were originally used by floor traders to set key levels. Floor traders are the original day traders. They deal in a very fast moving environment with a short-term focus. At the beginning of the trading day,
The Dynamic Fibonacci Grid Dashboard ( DFG-360 ) is a multi functional trading app designed for work primarily in the Forex market. The app combines several modules and tools into one complete trading system. The unique interface of the app is optimized for active day trading, scalping, news trading, short term trend following as well as counter trend and grid trading. Main features Advanced Multi Time Frame and Multi Market analysis. Quick and efficient position management. Semi-Automated trad
Custom Market Watch
Tsvetan Tsvetanov
3.33 (3)
The Custom Market Watch ( CMW ) is a professional grade trading application which allows you to operate effortlessly with large number of symbols and multiple open positions simultaneously from one chart. The Custom Market Watch shows the most essential daily technical information for each symbol in combination with very simple and easy to use trading interface where you can monitor the net exposure for each symbol and you can open and close positions with one click. The app is automatically syn
Interactive RSI Matrix
Tsvetan Tsvetanov
5 (7)
This indicator shows the current RSI values for multiple symbols and multiple timeframes and allows you to switch between timeframes and symbols with one click directly from the matrix. With this indicator, you can analyze large number of symbols across multiple timeframes and detect the strongest trends in just a few seconds. Features Shows RSI values for multiple symbols and timeframes simultaneously. Colored cells with progressive color intensity depending on the RSI values. Ability to chang
DFGX Dashboard
Tsvetan Tsvetanov
5 (2)
Take your trading to the next level with DFGX - our second generation Dynamic Fibonacci Grid. This new, powerful and easy to use application is specially designed and optimized for contrarian intraday trading, scalping and news trading on the Forex market. This system is the ideal solution for active professional traders and scalpers who are looking for innovative ways to optimize their strategy. The system also provides excellent opportunity for new traders who want to learn to trade in a syste
This indicator is using the Central Limit Theorem in combination with historical volatility and Fibonacci ratios in order to create unique type of chart tool called Projected Volatility Distribution. This tool allows you to perform highly accurate intraday technical analysis where in a split second you can detect overbought and oversold conditions as well as strong trends. In addition you have at your disposal multi-functional panel which shows signals in real time and gives you the ability to o
SDX Dashboard
Tsvetan Tsvetanov
SDX is our latest and most advanced dashboard for manual trading. The app is based on our proven grid platform and offers unique trading opportunities for both experienced and new traders. This unique combination of innovative tools is designed to simplify the trading process and to give you real advantage. The system is ideal for short term trend following, counter-trend trading and scalping on the Forex market. Main Features Ability to work simultaneously with 10 pairs from one screen. Abilit
Interactive BB Matrix
Tsvetan Tsvetanov
2 (1)
This indicator displays Bollinger Bands signals for multiple symbols and multiple time frames. The signals are created as a simple ratios which represent the distance between the current price and the moving average measured in standard deviations. This way we create a very versatile and easy to use indicator which helps us to identify not only the strongest trends but also the most overbought and oversold conditions. Features Accurate signals in real time for multiple time frames and multiple
Pivot Points Pro
Tsvetan Tsvetanov
This indicator is based on the classic Pivot Points concept combined with additional optimizations and advanced features.  The levels of support and resistance are calculated by taking into account the average historical volatility.  The added multi-symbol scanner allows you to detect the best conditions and trade setups.  You can see in real time the current situation for all of your favorite symbols and you can switch the chart to any symbol with one click. The build in alert system allows you
Currency Strength 28 Pro
Tsvetan Tsvetanov
4.5 (2)
This indicator allows you to analyze the hidden trends and correlations between the 8 most traded currencies via unique strength meter which creates multiple charts in a single window based on the price action of each currency in relation to all other currencies. The indicator also includes interactive panel where you can see the trends for all 28 pairs as well as the distance to the highest and the lowest price for the selected period. With this panel you can switch between currency pairs with
FX28 Trader
Tsvetan Tsvetanov
5 (1)
FX28 Trader Dashboard 소개 - 귀하의 궁극적인 트레이드 매니저 FX28 Trader Dashboard는 외환 거래를 새로운 차원으로 끌어올릴 수 있는 포괄적이고 직관적인 트레이드 매니저로 귀하의 거래 경험의 전체 잠재력을 발휘합니다. 귀하가 경험이 풍부한 트레이더이든, 금융 여정을 시작한 지 얼마 안 된 초보자이든, 이 강력한 도구는 귀하의 거래 활동을 효율적으로 정리하고 의사 결정 과정을 향상시키기 위해 개발되었습니다. 주요 특징: 사용자 친화적 인터페이스: FX28 Trader Dashboard는 모든 수준의 트레이더에게 적합한 사용자 친화적 인터페이스를 자랑합니다. 다양한 기능과 도구를 쉽게 탐색하여 몇 번의 클릭으로 거래를 완전히 통제할 수 있습니다. 실시간 시장 데이터: 실시간 시장 데이터 피드를 통해 통화 쌍, 트렌드 및 시장 변동에 대한 최신 정보를 얻어 자신감 있게 거래를 실행하세요. 고급 트레이드 분석: FX28 Trader Dashboard를 사
Interactive RSI Matrix MT5
Tsvetan Tsvetanov
5 (1)
This indicator shows the current RSI values for multiple symbols and multiple timeframes and allows you to switch between timeframes and symbols with one click directly from the matrix. With this indicator, you can analyze large number of symbols across multiple timeframes and detect the strongest trends in just a few seconds. Features Shows RSI values for multiple symbols and timeframes simultaneously. Colored cells with progressive color intensity depending on the RSI values. Ability to chang
Custom Pivots MT5
Tsvetan Tsvetanov
5 (1)
Pivots Points are significant levels traders can use to determine directional movement, support and resistance. Pivot Points use the prior period's high, low and close to formulate future support and resistance. In this regard, Pivot Points are predictive and leading indicators. Pivot Points were originally used by floor traders to set key levels. Floor traders are the original day traders. They deal in a very fast moving environment with a short-term focus. At the beginning of the trading day,
FX28 Trader MT5
Tsvetan Tsvetanov
3 (1)
FX28 Trader Dashboard 소개 - 귀하의 궁극적인 트레이드 매니저 FX28 Trader Dashboard는 외환 거래를 새로운 차원으로 끌어올릴 수 있는 포괄적이고 직관적인 트레이드 매니저로 귀하의 거래 경험의 전체 잠재력을 발휘합니다. 귀하가 경험이 풍부한 트레이더이든, 금융 여정을 시작한 지 얼마 안 된 초보자이든, 이 강력한 도구는 귀하의 거래 활동을 효율적으로 정리하고 의사 결정 과정을 향상시키기 위해 개발되었습니다. 주요 특징: 사용자 친화적 인터페이스: FX28 Trader Dashboard는 모든 수준의 트레이더에게 적합한 사용자 친화적 인터페이스를 자랑합니다. 다양한 기능과 도구를 쉽게 탐색하여 몇 번의 클릭으로 거래를 완전히 통제할 수 있습니다. 실시간 시장 데이터: 실시간 시장 데이터 피드를 통해 통화 쌍, 트렌드 및 시장 변동에 대한 최신 정보를 얻어 자신감 있게 거래를 실행하세요. 고급 트레이드 분석: FX28 Trader Dashboard를 사
Score EA
Tsvetan Tsvetanov
5 (2)
MT5 버전의 완전 자동화된 적응형 거래 시스템인 Score EA를 소개합니다. 이 새로운 버전은 기능과 성능이 크게 향상되어 거래 경험을 새로운 차원으로 끌어올립니다. 주요 업데이트 사항은 다음과 같습니다: 최대 28개의 심볼을 지원하여 더 넓은 시장 노출과 다각화를 제공합니다. 확장된 사용자 인터페이스, 이제 포지션 목록과 더 큰 유연성을 위한 수동 제어 버튼이 추가되었습니다. 거래 결정과 성과를 향상시키기 위해 설계된 새로운 거래 알고리즘과 개선된 머신러닝 모델. 많은 다른 시스템들이 외부 AI 리소스나 ChatGPT와 같은 일반적인 언어 모델에 의존하는 반면, 우리 시스템인 Score EA는 맞춤형으로 개발된 독점적인 머신러닝 알고리즘으로 구동됩니다. 이 모델들은 거래와 시간 순서 데이터에서 통계적으로 중요한 패턴을 감지하는 데 특화되어 있어 시장에서 독특한 이점을 제공합니다. 주요 특징: 고급 거래 로직 : 독점적인 머신러닝 및 통계 모델에서 파생됨. 높은 구성 가능성 :
Smart Detector EA
Tsvetan Tsvetanov
Smart Detector EA – 스마트한 트레이딩을 간단하게 Smart Detector EA는 복잡한 기술을 단순하고 사용자 친화적인 솔루션으로 변환하는 첨단 트레이딩 시스템입니다. 모든 수준의 트레이더를 위해 설계되었으며, 몇 가지 기본적인 외부 설정만으로 수동 설정을 최소화하고, 강력한 실시간 최적화와 적응형 머신러닝이 나머지를 처리합니다. 주요 기능: 완전 자동화: 높은 수준의 자동화로 사용자의 개입이 거의 필요 없음. 적응형 인텔리전스: 전략이 스스로 최적화되며 시장 상황에 실시간으로 적응. 견고한 전략: 다양한 거래 환경에 둔감하여 안정적인 성능 제공. 위험 관리 중심 설계: 마틴게일, 그리드, 물타기 기법 미사용. 간소화된 트레이딩: 한 번에 하나의 포지션만 보유하여 관리 용이. 유연한 보유 기간: 일반적인 거래는 몇 시간에서 며칠 동안 지속. 스마트한 청산: 반대 신호가 발생하면 자동으로 포지션 종료. 사용자 지정 위험 관리: 고정 스톱/타깃 수준 및 포지션 손실 제
HL Signals
Tsvetan Tsvetanov
HL Signals는 실시간으로 돌파 기회를 감지하도록 설계된 멀티 심볼 지표입니다. 가격이 일간, 주간 또는 월간의 새로운 고점이나 저점에 도달하면 즉시 알림을 제공하여 중요한 시장 움직임에 한발 앞서 대응할 수 있도록 도와줍니다. 효율성과 명확성을 위해 설계된 HL Signals는 정밀한 감지 기능과 직관적인 인터랙티브 패널을 결합하여 여러 종목을 손쉽게 모니터링하고 전환할 수 있게 합니다. 주요 장점 돌파 기회를 발생하는 순간 포착할 수 있습니다. 차트를 수동으로 전환하지 않고도 여러 종목을 모니터링할 수 있습니다. 여러 시간대에 걸친 주요 시장 레벨에 맞춰 대응할 수 있습니다. 즉각적인 사운드 및 모바일 알림으로 신호를 놓치지 않습니다. 자신의 트레이딩 스타일에 맞게 지표를 커스터마이즈할 수 있습니다. 기능 실시간 돌파 감지 — 텍스트와 색상을 활용한 명확한 시각 신호로 새로운 고점과 저점을 즉시 식별합니다. 멀티 타임프레임 신호 — 일간, 주간, 월간 레벨의 신호를 동시에
필터:
리뷰 없음
리뷰 답변