ATR Bands Matrix

ATR Bands & Multi-Timeframe Trend Matrix pour MT5

Capturez la volatilité. Évaluez la force des tendances. Ne manquez aucun mouvement majeur du marché.

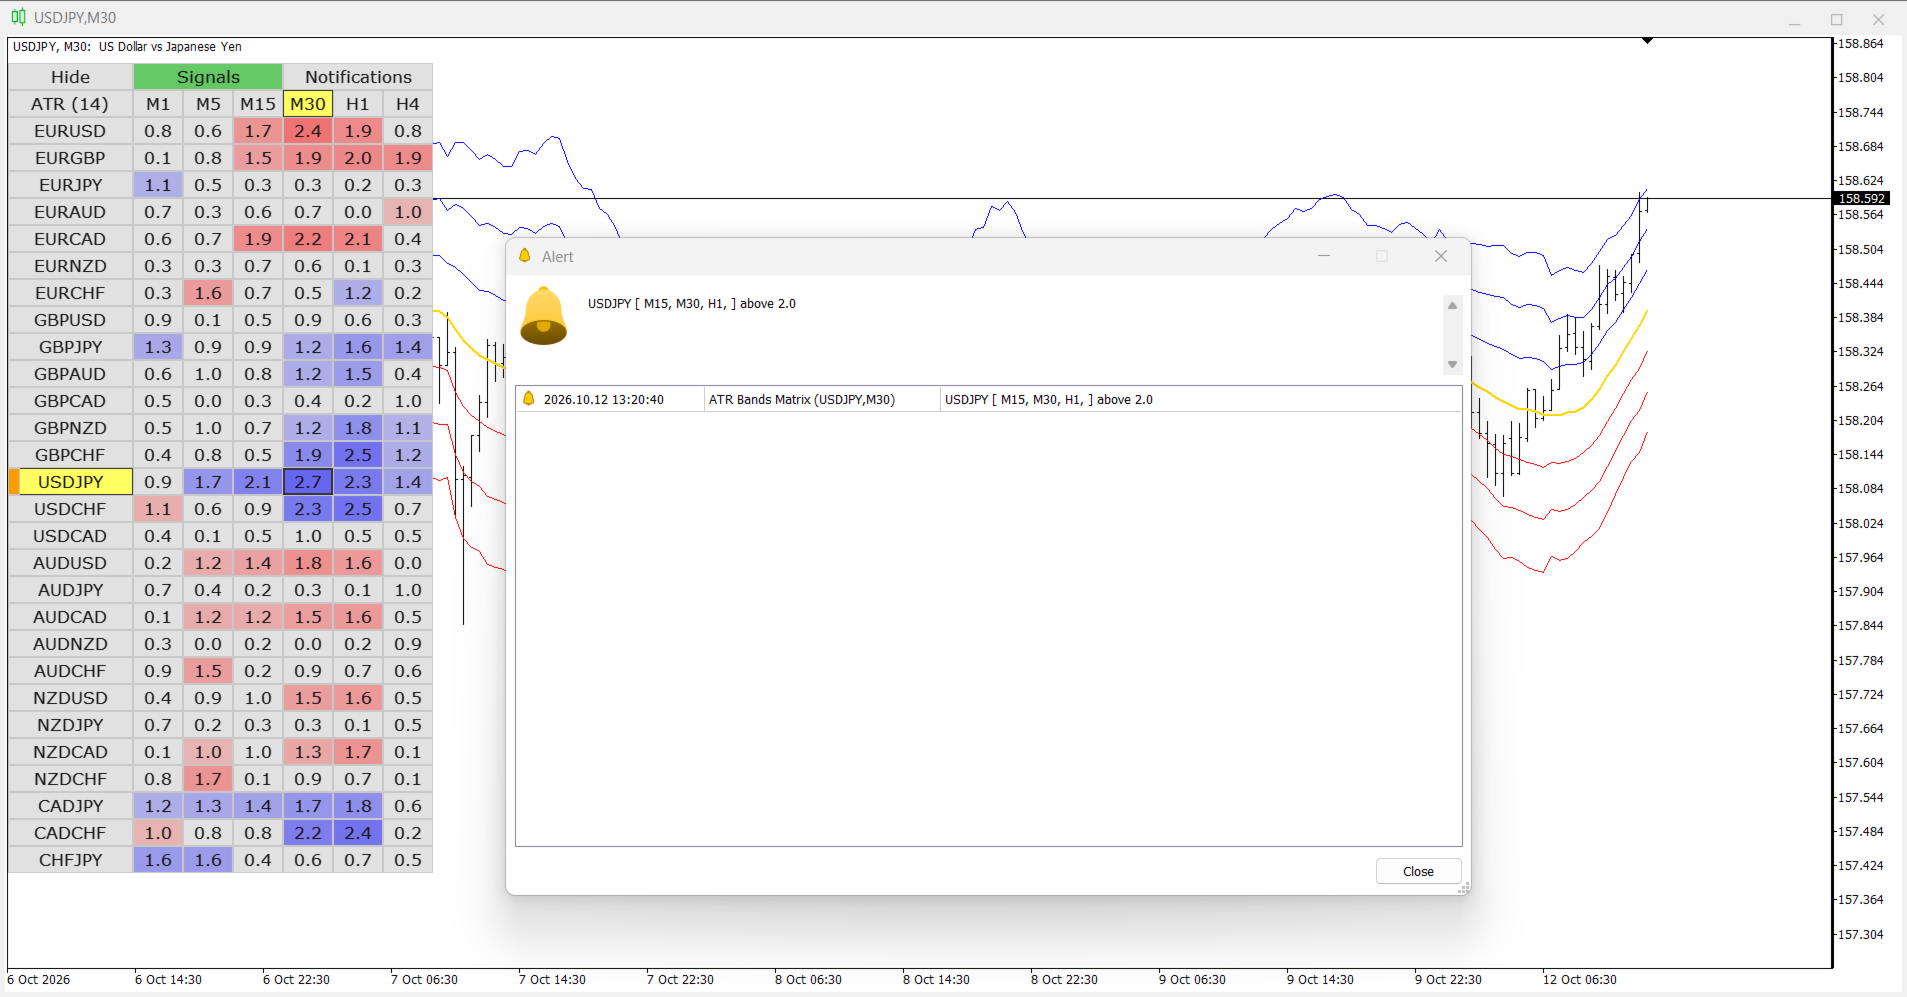
ATR Bands & Multi-Timeframe Trend Matrix est un outil de trading professionnel pour MetaTrader 5 qui combine des bandes ATR dynamiques avec un tableau de bord interactif d'analyse des marchés. En surveillant simultanément des dizaines de paires de devises et plusieurs unités de temps, il filtre instantanément le bruit du marché, détecte les tendances fortes et repère les opportunités de trading à forte probabilité dès leur formation.

Fonctionnalités et avantages clés

Matrice multi-symboles et multi-unités de temps

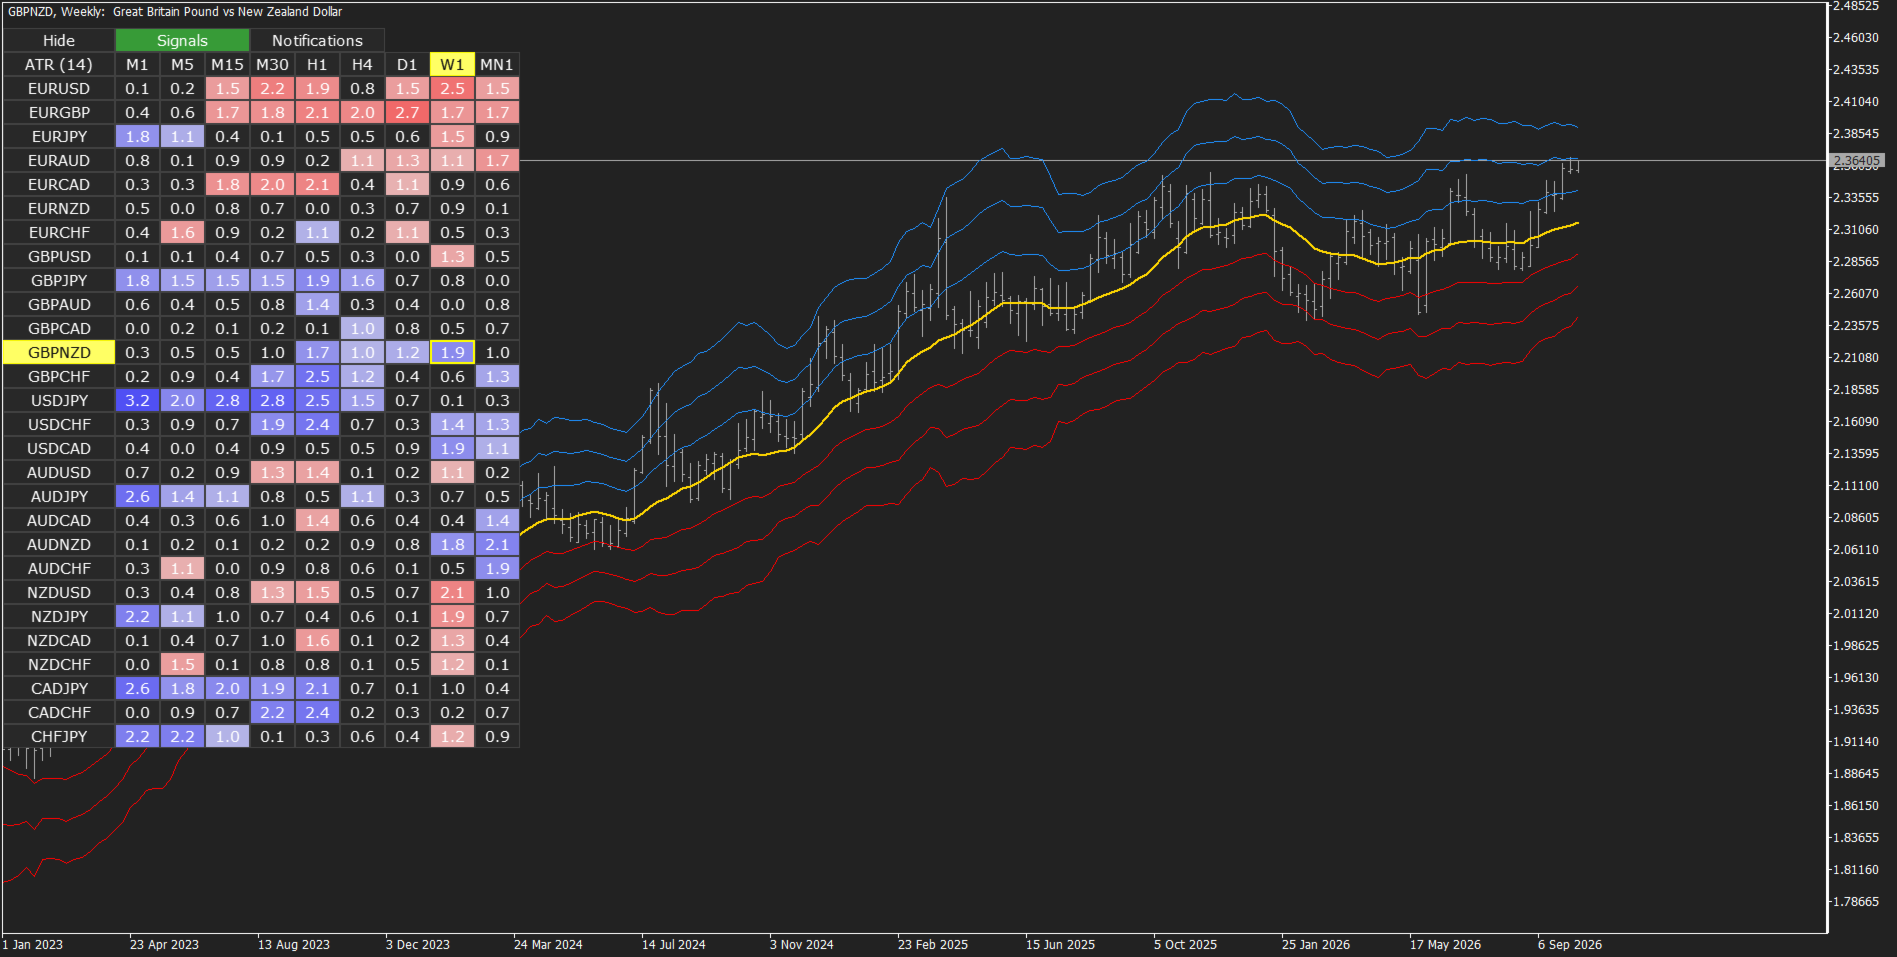
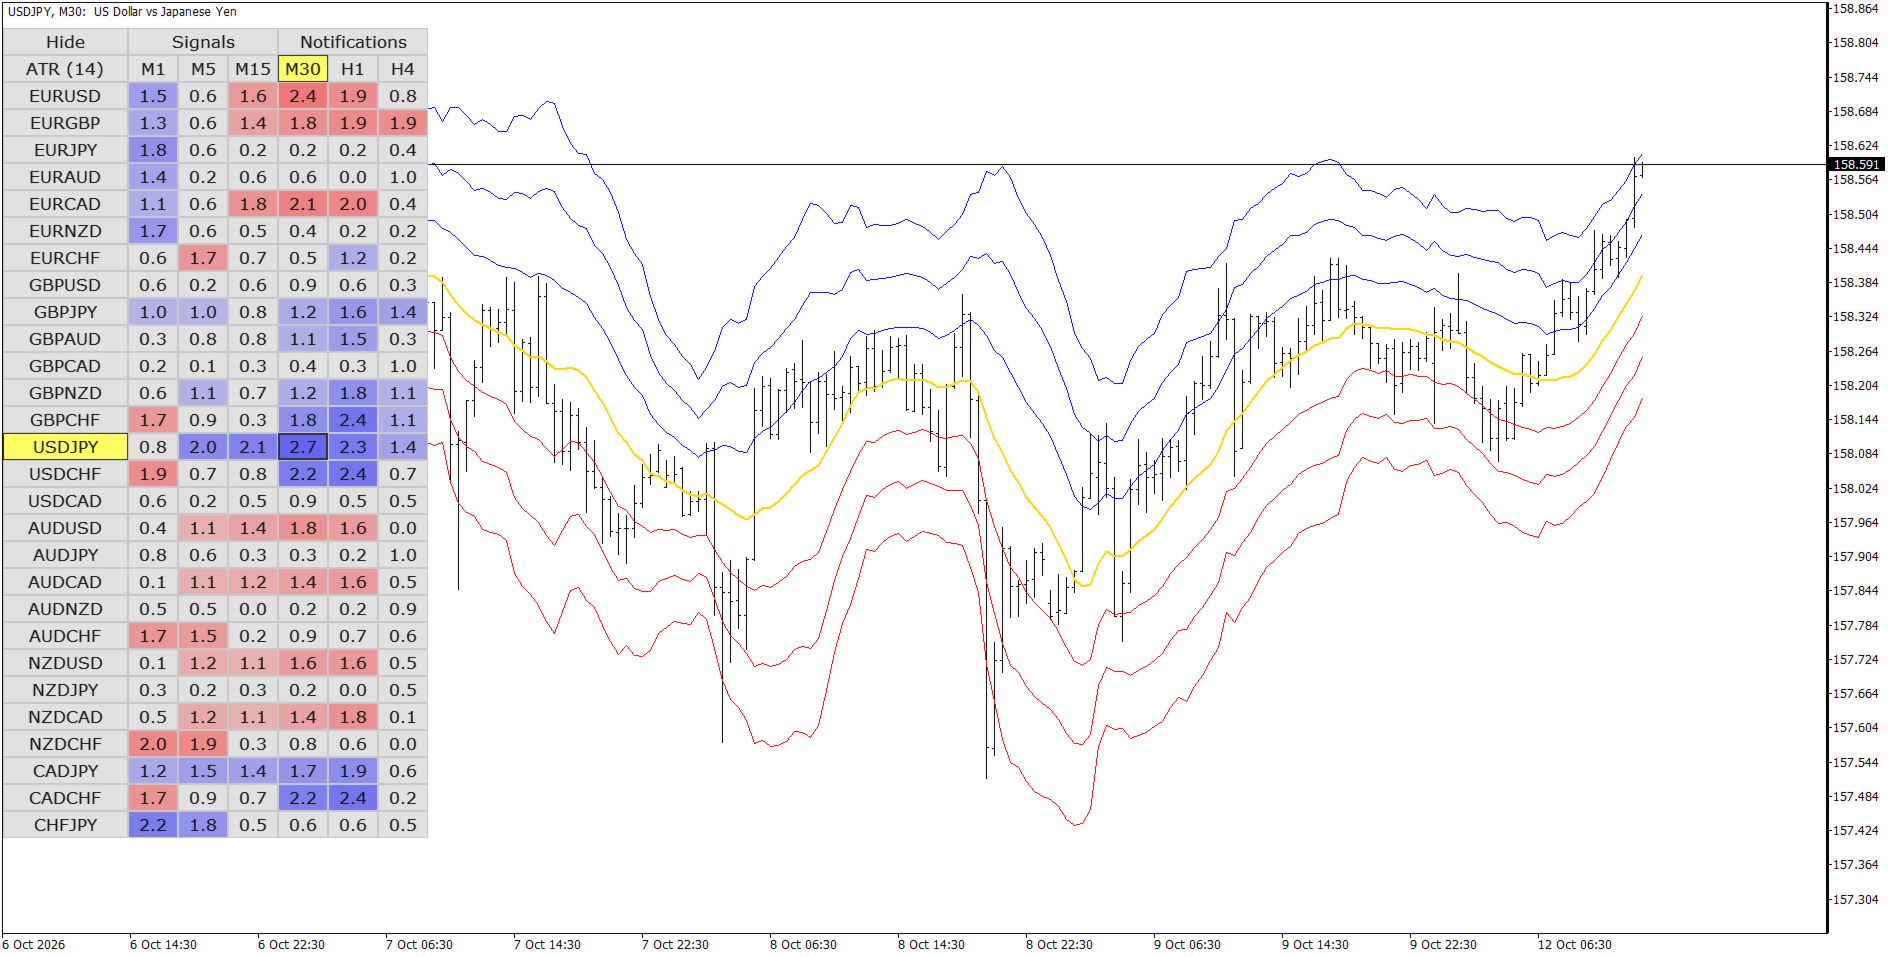
Ne perdez plus de temps à passer d'un graphique individuel à un autre parmi des dizaines de graphiques. Notre tableau de bord intuitif, doté d'un code couleur, vous offre une vue d'ensemble du marché. Il analyse simultanément la volatilité et les conditions de tendance sur plusieurs actifs, vous permettant de vous concentrer exclusivement sur les instruments présentant le plus fort potentiel de trading.

Navigation interactive en un clic

Gérez votre espace de travail avec une efficacité maximale. Cliquez sur n'importe quel symbole ou unité de temps directement dans la matrice pour basculer instantanément vers le graphique actif correspondant. Plus besoin de rechercher manuellement les instruments dans la fenêtre « Observation du marché » ni de réappliquer constamment les modèles de graphiques.

Bandes ATR pour une analyse précise des tendances

Visualisez l'évolution des prix par rapport à leur moyenne mobile grâce aux bandes ATR dynamiques (Average True Range, ou amplitude réelle moyenne). Cet indicateur vous aide à identifier facilement les conditions de surachat et de survente (écarts excessifs du prix par rapport à sa moyenne) et à évaluer la véritable dynamique d'une tendance en fonction de l'écart entre le prix et sa moyenne.

Signaux de force de tendance sur plusieurs unités de temps

Tradez en suivant les flux institutionnels en alignant vos entrées sur plusieurs unités de temps. L'indicateur génère automatiquement des alertes lorsque le prix dépasse simultanément un seuil ATR personnalisable sur plusieurs intervalles de temps.

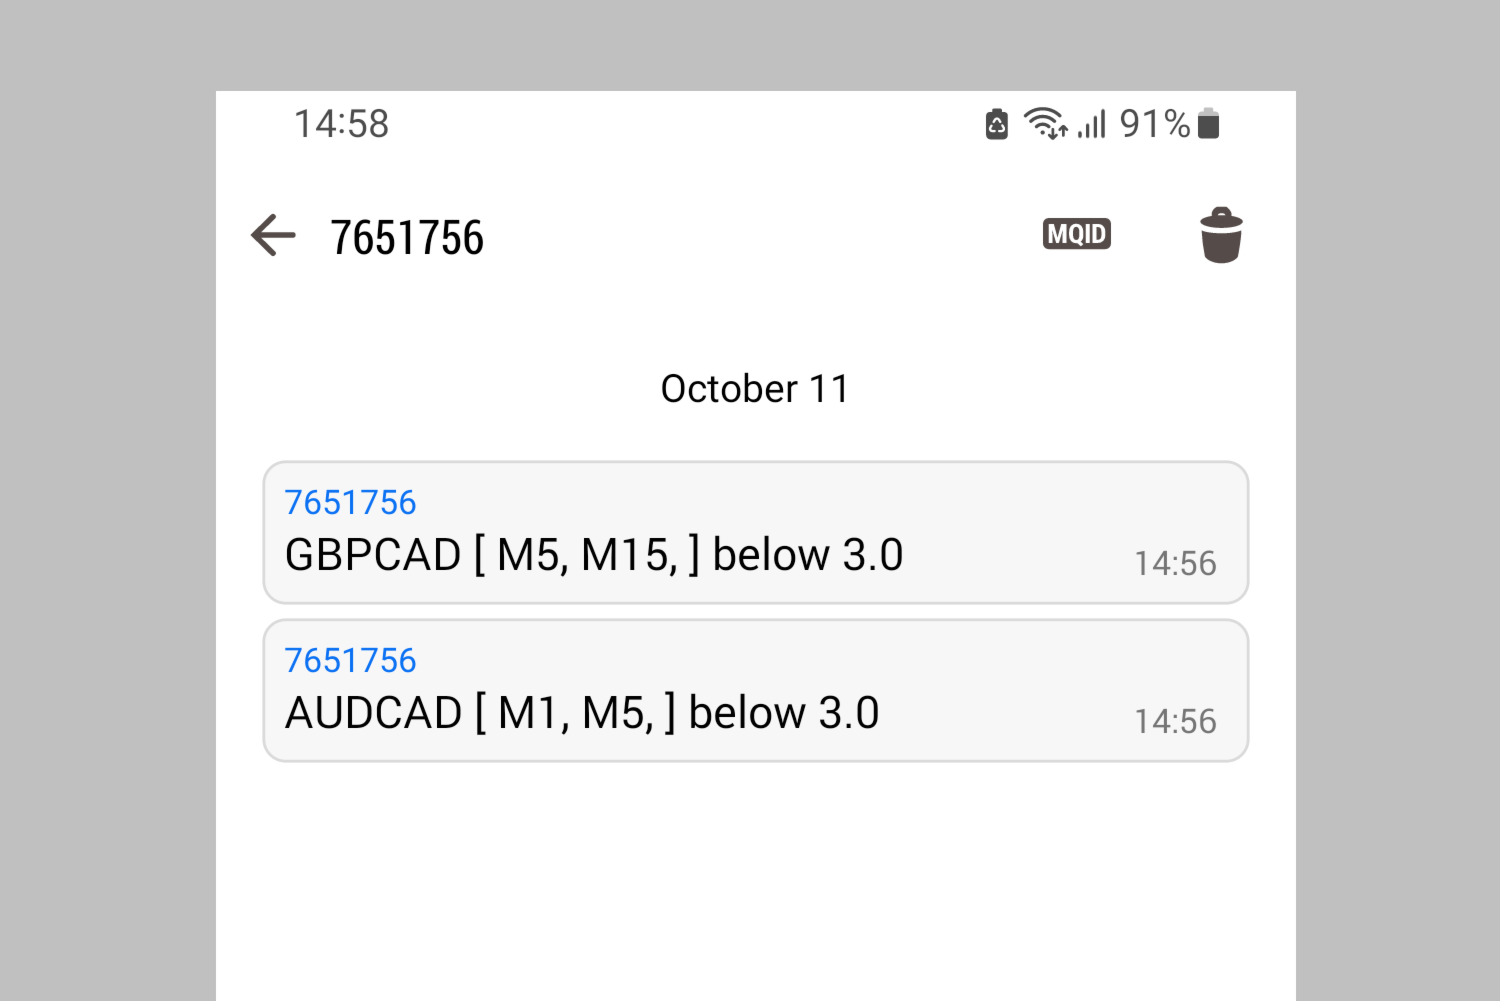
  • Exemple : EURUSD [M15, M30, H1] au-dessus de 3.0 — cela signifie que le prix a dépassé de plus de 3 ATR sa moyenne mobile, simultanément sur les graphiques de 15 minutes, 30 minutes et 1 heure. Lorsque plusieurs unités de temps indiquent la même direction, vous obtenez une confirmation de tendance avec une forte probabilité de continuation.

Système d'alertes fiable (ne manquez aucune entrée)

Restez connecté aux marchés même lorsque vous êtes loin de votre ordinateur ou occupé à d'autres tâches :

  • Alertes sonores et fenêtres contextuelles : directement dans votre plateforme MT5.
  • Marqueurs visuels : pour analyser rapidement les signaux passés.
  • Journaux textuels enregistrés localement : pour conserver un historique des signaux.
  • Notifications push sur mobile : envoyées directement sur votre smartphone (iOS et Android) dès le déclenchement d'un signal.

À qui s'adresse cet indicateur ?

  • Scalpeurs et traders intrajournaliers : qui doivent réagir rapidement aux cassures et aux pics de volatilité.
  • Swing traders : qui souhaitent confirmer leur biais directionnel grâce à l'alignement de plusieurs unités de temps.
  • Traders multi-actifs : qui cherchent à optimiser leur temps passé devant l'écran et à automatiser le processus fastidieux de balayage des marchés.

Passez dès aujourd'hui à la vitesse supérieure avec ATR Matrix

Optimisez vos graphiques, éliminez la paralysie de l'analyse et commencez à trader en tirant parti de l'avantage mathématique offert par une analyse professionnelle sur plusieurs unités de temps.
Plus de l'auteur
Dynamic Fibonacci Grid
Tsvetan Tsvetanov
5 (1)
Présentation de la dernière version du Dynamic Fibonacci Grid Dashboard pour MT5. Désormais doté de nombreuses nouvelles fonctionnalités, ce tableau de bord transforme votre expérience de trading et vous permet de visualiser le marché et l’action des prix sous un angle totalement différent. Découvrez de nouvelles possibilités grâce à l’analyse simultanée de plusieurs périodes et de plusieurs symboles. Interface conviviale pour le trading manuel et la gestion des positions, avec une capacité éte
Représentation graphique de la force intrajournalière des devises. Le calcul est basé sur 28 paires. Les valeurs sont suivies depuis le début de la bougie quotidienne jusqu'à l'heure actuelle. Cet indicateur a été initialement créé comme un outil gratuit pour le tableau de bord FX28 Trader. Vous pouvez désormais l'utiliser gratuitement. L'indicateur offre de nombreux paramètres de personnalisation et peut également être lié directement au système de contrôle graphique de FX28 Trader. Remarque !
FREE
DFG Chart
Tsvetan Tsvetanov
The DFG Chart Indicator displays the historical DFG levels used in the DFG dashboard. These levels are generated dynamically using moving averages and Fibonacci ratios. The Fibonacci Bands automatically adjust to reflect changes in the price range and trend direction. The indicator also features buttons for selecting chart symbol and timeframe, along with a wide range of customization options. Key Features Dynamic DFG Levels Automatically calculated using moving averages and Fibonacci ratios. H
FREE
SDX Chart
Tsvetan Tsvetanov
4.5 (2)
The SDX Chart is a free additional indicator which can be used in combination with SDX Dashboard . Features Ability to review the history of each symbol and time frame. Ability to change symbols and time frames with one click. Works perfectly in combination with SDX Dashboard and helps you to understand the system better. Settings MA Period - number of periods for the calculation of the moving average and the standard deviation. Number of Bars - how far back to draw the indicator. Buttons Size
FREE
Custom Pivots
Tsvetan Tsvetanov
4 (4)
Pivots Points are significant levels traders can use to determine directional movement, support and resistance. Pivot Points use the prior period's high, low and close to formulate future support and resistance. In this regard, Pivot Points are predictive and leading indicators. Pivot Points were originally used by floor traders to set key levels. Floor traders are the original day traders. They deal in a very fast moving environment with a short-term focus. At the beginning of the trading day,
The Dynamic Fibonacci Grid Dashboard ( DFG-360 ) is a multi functional trading app designed for work primarily in the Forex market. The app combines several modules and tools into one complete trading system. The unique interface of the app is optimized for active day trading, scalping, news trading, short term trend following as well as counter trend and grid trading. Main features Advanced Multi Time Frame and Multi Market analysis. Quick and efficient position management. Semi-Automated trad
Custom Market Watch
Tsvetan Tsvetanov
3.33 (3)
The Custom Market Watch ( CMW ) is a professional grade trading application which allows you to operate effortlessly with large number of symbols and multiple open positions simultaneously from one chart. The Custom Market Watch shows the most essential daily technical information for each symbol in combination with very simple and easy to use trading interface where you can monitor the net exposure for each symbol and you can open and close positions with one click. The app is automatically syn
Interactive RSI Matrix
Tsvetan Tsvetanov
5 (7)
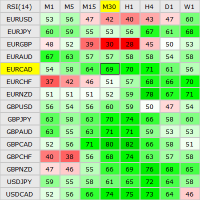
This indicator shows the current RSI values for multiple symbols and multiple timeframes and allows you to switch between timeframes and symbols with one click directly from the matrix. With this indicator, you can analyze large number of symbols across multiple timeframes and detect the strongest trends in just a few seconds. Features Shows RSI values for multiple symbols and timeframes simultaneously. Colored cells with progressive color intensity depending on the RSI values. Ability to chang
DFGX Dashboard
Tsvetan Tsvetanov
5 (2)
Take your trading to the next level with DFGX - our second generation Dynamic Fibonacci Grid. This new, powerful and easy to use application is specially designed and optimized for contrarian intraday trading, scalping and news trading on the Forex market. This system is the ideal solution for active professional traders and scalpers who are looking for innovative ways to optimize their strategy. The system also provides excellent opportunity for new traders who want to learn to trade in a syste
This indicator is using the Central Limit Theorem in combination with historical volatility and Fibonacci ratios in order to create unique type of chart tool called Projected Volatility Distribution. This tool allows you to perform highly accurate intraday technical analysis where in a split second you can detect overbought and oversold conditions as well as strong trends. In addition you have at your disposal multi-functional panel which shows signals in real time and gives you the ability to o
SDX Dashboard
Tsvetan Tsvetanov
SDX is our latest and most advanced dashboard for manual trading. The app is based on our proven grid platform and offers unique trading opportunities for both experienced and new traders. This unique combination of innovative tools is designed to simplify the trading process and to give you real advantage. The system is ideal for short term trend following, counter-trend trading and scalping on the Forex market. Main Features Ability to work simultaneously with 10 pairs from one screen. Abilit
Interactive BB Matrix
Tsvetan Tsvetanov
2 (1)
This indicator displays Bollinger Bands signals for multiple symbols and multiple time frames. The signals are created as a simple ratios which represent the distance between the current price and the moving average measured in standard deviations. This way we create a very versatile and easy to use indicator which helps us to identify not only the strongest trends but also the most overbought and oversold conditions. Features Accurate signals in real time for multiple time frames and multiple
This indicator is based on the classic Pivot Points concept combined with additional optimizations and advanced features.  The levels of support and resistance are calculated by taking into account the average historical volatility.  The added multi-symbol scanner allows you to detect the best conditions and trade setups.  You can see in real time the current situation for all of your favorite symbols and you can switch the chart to any symbol with one click. The build in alert system allows you
Currency Strength 28 Pro
Tsvetan Tsvetanov
4.5 (2)
This indicator allows you to analyze the hidden trends and correlations between the 8 most traded currencies via unique strength meter which creates multiple charts in a single window based on the price action of each currency in relation to all other currencies. The indicator also includes interactive panel where you can see the trends for all 28 pairs as well as the distance to the highest and the lowest price for the selected period. With this panel you can switch between currency pairs with
FX28 Trader
Tsvetan Tsvetanov
5 (1)
Présentation du FX28 Trader Dashboard - Votre gestionnaire de transactions ultime Découvrez tout le potentiel de votre expérience de trading avec le FX28 Trader Dashboard, un gestionnaire de transactions complet et intuitif conçu pour élever votre trading Forex à de nouveaux sommets. Que vous soyez un trader expérimenté ou que vous débutiez votre parcours financier, cet outil puissant a été développé pour simplifier vos activités de trading et améliorer votre processus de prise de décision. Car
This indicator shows the current RSI values for multiple symbols and multiple timeframes and allows you to switch between timeframes and symbols with one click directly from the matrix. With this indicator, you can analyze large number of symbols across multiple timeframes and detect the strongest trends in just a few seconds. Features Shows RSI values for multiple symbols and timeframes simultaneously. Colored cells with progressive color intensity depending on the RSI values. Ability to chang
Custom Pivots MT5
Tsvetan Tsvetanov
5 (1)
Pivots Points are significant levels traders can use to determine directional movement, support and resistance. Pivot Points use the prior period's high, low and close to formulate future support and resistance. In this regard, Pivot Points are predictive and leading indicators. Pivot Points were originally used by floor traders to set key levels. Floor traders are the original day traders. They deal in a very fast moving environment with a short-term focus. At the beginning of the trading day,
FX28 Trader MT5
Tsvetan Tsvetanov
3 (1)
Présentation du FX28 Trader Dashboard - Votre gestionnaire de transactions ultime Découvrez tout le potentiel de votre expérience de trading avec le FX28 Trader Dashboard, un gestionnaire de transactions complet et intuitif conçu pour élever votre trading Forex à de nouveaux sommets. Que vous soyez un trader expérimenté ou que vous débutiez votre parcours financier, cet outil puissant a été développé pour simplifier vos activités de trading et améliorer votre processus de prise de décision. Car
Score EA
Tsvetan Tsvetanov
5 (2)
Nous vous présentons la version MT5 de notre système de trading adaptatif entièrement automatisé – Score EA . Cette nouvelle version offre des capacités et des fonctionnalités considérablement améliorées, élevant votre expérience de trading à de nouveaux sommets. Les principales mises à jour incluent : Support de jusqu'à 28 symboles, permettant une exposition plus large au marché et une meilleure diversification. Une interface utilisateur étendue, maintenant avec une liste de positions complète
Smart Detector EA
Tsvetan Tsvetanov
Smart Detector EA – Le trading intelligent en toute simplicité Smart Detector EA est un système de trading avancé qui transforme une technologie complexe en une solution simple et conviviale. Conçu pour les traders de tous niveaux, cet EA réduit la configuration manuelle à seulement quelques réglages externes de base, tandis que l’optimisation en temps réel et l’apprentissage automatique adaptatif prennent en charge le reste. Caractéristiques principales : Entièrement automatisé : haut niveau d’
HL Signals
Tsvetan Tsvetanov
HL Signals est un indicateur multi-symboles conçu pour détecter les opportunités de cassure en temps réel. Il vous alerte instantanément lorsque le prix atteint de nouveaux plus hauts et plus bas quotidiens, hebdomadaires ou mensuels, vous aidant à anticiper les mouvements clés du marché. Conçu pour l’efficacité et la clarté, HL Signals combine une détection précise avec un panneau interactif et intuitif qui vous permet de surveiller et de basculer entre les symboles facilement. Principaux avant
Filtrer:
Aucun avis
Répondre à l'avis