BoxRangeSnap Range Boxes with Snapshots MT5

  • 지표
  • Naoto Shimoda
    Naoto Shimoda
    • MetaTrader 4/5 Indicator & EA Developer 에  FX.Hamrat
    • 일본
    • 966
    FX.Hamrat - MetaTrader 4/5 indicator and Expert Advisor developer based in Japan.
    Over 10 years of trading experience (discretionary and systematic), and 90+ MT4/MT5 programs built so far - including 30+ custom-made projects for individual traders.
  • 버전: 1.2
  • 활성화: 10

Where is the price inside the range — in one panel.

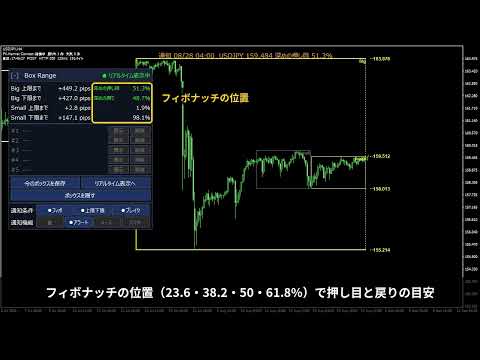
BoxRangeSnap looks for price zones where the highs and lows touched the same top and bottom again and again, and draws them as a big box and a small box. The panel keeps showing the distance from the price to the top and bottom of the current box.

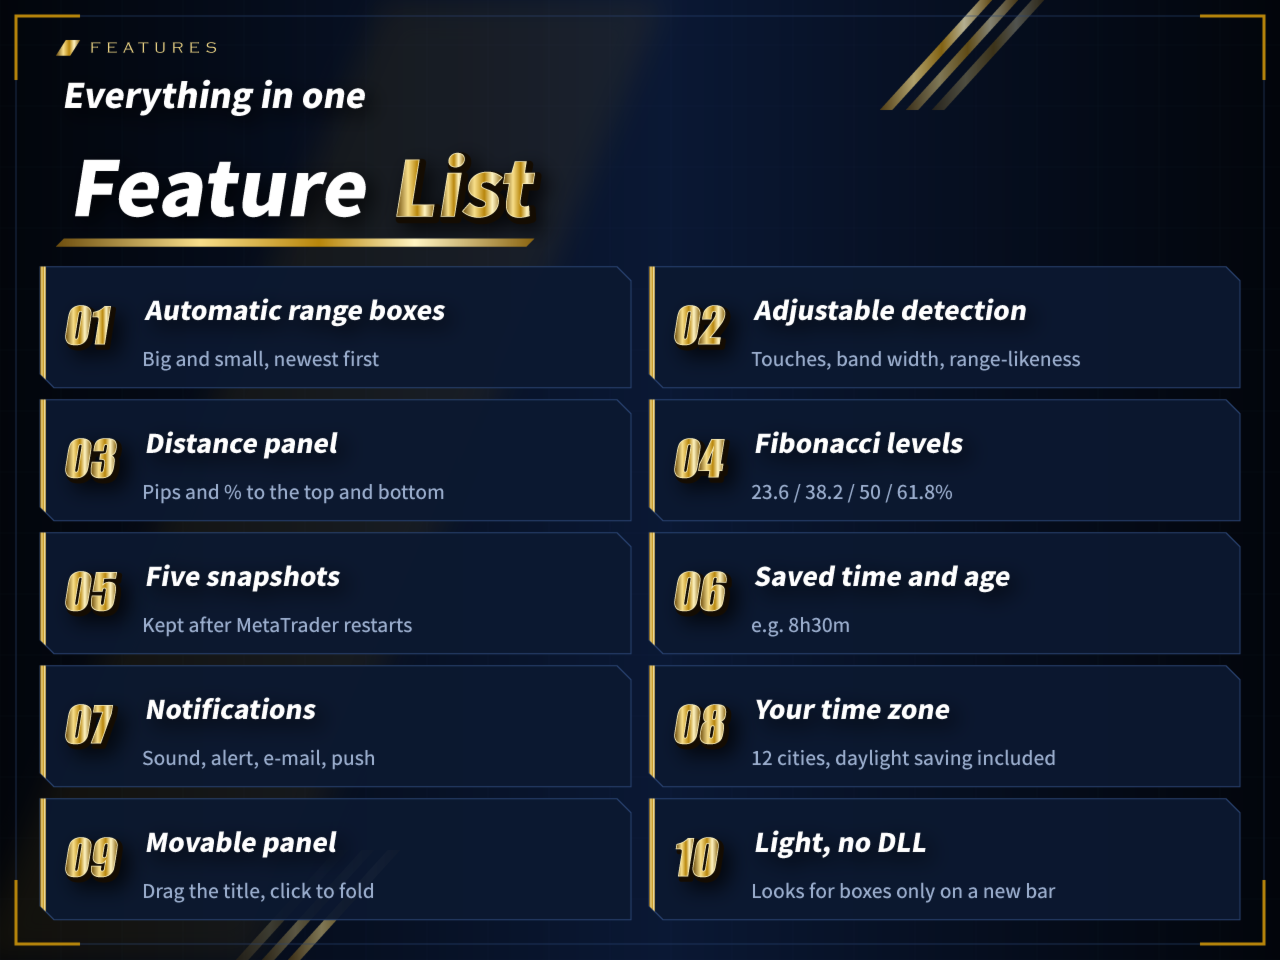
Features

  1. Automatic range boxes: a big box and a small box, newest first. The current box is highlighted and extends to the last closed bar.
  2. Adjustable detection: minimum touches on the top and bottom, touch band width, and how concentrated the closes must be.
  3. Distance panel: distance in pips from the Bid to the top and bottom, and the position inside the box in %.
  4. Fibonacci levels: at 23.6 / 38.2 / 50 / 61.8% the panel shows "Shallow pullback", "Deep rebound" and so on.
  5. Five snapshots: save a recent box with one button and show it again later to check the top, bottom and Fibonacci levels that are still working. Kept after MetaTrader restarts (per chart and symbol).
  6. Saved time and age: timeframe, saved time and how long ago (e.g. 8h30m).
  7. Notifications: sound, alert, e-mail and push when the price reaches a Fibonacci level, touches the top or bottom, or breaks out. Each kind at most once per 60 seconds (adjustable).
  8. Your time zone: Tokyo, London, New York and 9 more cities, daylight saving included.
  9. Movable panel: drag the title to move it, click it to fold. Works on 125% / 150% display scaling.

How the boxes are found

A window of bars slides from the newest bar back in time. A window becomes a box when the highs and lows touched the top band and the bottom band alternately at least twice each, and the closes stay concentrated (standard deviation of closes / box height under the limit). The window length follows the timeframe, so H1 and M15 give boxes covering roughly the same calendar time. Only closed bars are used.

Inputs (main)

  • Touch band width, minimum touches (top / bottom), range-likeness limit, days to look back
  • Big / small box: number shown, colors, line width, fill, label
  • Panel: show, position, colors, font size, transparent background
  • Time zone, notification interval, notification messages

It does not give buy or sell signals and does not guarantee profits.
추천 제품
Big Players Last Fight
Flavio Javier Jarabeck
5 (2)
A very useful Price Action point is the previous day Closing VWAP. We call it Big Players Last Fight . This indicator will draw a line showing on your chart what was the last VWAP price of the previous trading session. Simple and effective. As an additional bonus, this indicator saves the VWAP value on the Public Terminal Variables, so you EA could read easily its value! Just for the "Prefix + Symbol name" on the variables list and you will see! SETTINGS How many past days back do you want to s
FREE
Candle Timer Jason v001
Jason Ramalho Nascimento
Here is the description translated and optimized for the MQL5 Market : Candle Timer Jason – Candle Countdown Indicator (MT5) Candle Timer Jason is a lightweight, high-performance utility developed for MetaTrader 5. It is designed for Forex, Stock, and Crypto traders who need to monitor the exact remaining time before the current candle closes. Knowing precisely how many minutes and seconds are left in a bar is essential for execution timing, helping you avoid premature entries or getting caught
Short Market Description (recommended) Market Periods Synchronizer highlights higher-timeframe (HTF) sessions directly on your current chart, so you can trade the lower timeframe with full higher-timeframe context. Draws vertical lines for each HTF bar (e.g., H1 on an M5 chart) Optional body fill (green for bullish, red for bearish) for each HTF candle Optional Open/Close markers with labels to spot key reference levels fast Optional minor-timeframe dividers (e.g., M30 & M15) only inside each
FREE
Broker Environment Inspector is a professional MetaTrader 5 compatibility and diagnostics utility for examining the current terminal, account and symbol environment. It presents trading permissions, quote conditions, contract settings and supported execution capabilities in a clear technical dashboard. MAIN FEATURES • Terminal connection and trading-permission flags • Quote freshness and current spread inspection • Trading-session availability • Contract size, tick size and tick value details •
Vector Local Copier
Sotirios Apostolos Adaloglou
This is the FREE DEMO version of Vector Local Copier. It's the complete copier — real-time local copying, symbol mapping, multipliers, SL/TP sync, the safety guards, the live dashboard — with one limitation: slave trades are capped to 0.01 lots. That's enough to prove it works perfectly on your exact terminals, brokers, and symbols before you buy the full-size version. GET THE FULL VERSION (no lot cap) HERE: https://www.mql5.com/en/market/product/187169 Vector Local Copier mirrors trades
FREE
TradePulseMonitor for MetaTrader 4 & 5 Overview: TradePulseMonitor is a comprehensive, real-time dashboard indicator designed for MetaTrader 4 and MetaTrader 5. It provides traders with an at-a-glance overview of their account's financial health, risk exposure, position metrics, and historical performance. By consolidating critical data into a single, customizable on-chart dashboard, it eliminates the need to constantly check the Terminal window, allowing for faster and more informed trading de
FREE
Automated Timeframe cycling with Symbols centered.  Force every timeframe onto one clock window, so the story you see on Daily is the same story you are slicing on H4, H1, and M1.  Traders usually flip timeframes and lose the span. A Daily chart shows a few weeks, then M15 shows a few hours, and the eye treats them as different markets. TASSERACT locks the window to N bars of the highest enabled timeframe — default 10 Daily — and maps every lower timeframe to that same stretch. You stay inside o
FREE
VWAP session
Kettani abdouessalam
VWAP (Volume Weighted Average Price) indicator with ±1σ and ±2σ bands calculated from real traded volume. The start and end times of the session are fully configurable, as well as the standard deviation levels and the number of bands displayed. It shows the day’s volume-weighted average price and helps traders identify value areas, price extremes, and intraday trading opportunities with precision.
Level Alert Utility is an essential workflow tool for MetaTrader 5 designed to eliminate constant screen fatigue. Effortlessly drag the interactive level line directly on your chart—the indicator instantly configures trigger rules and delivers real-time notifications via customizable sound repeats, popup alerts, mobile Push notifications, and email. Equipped with high-speed millisecond monitoring, gap and impulse protection, quick-action chart buttons, hotkey support, and state persistence acros
EventCalendar Lite - 다음 경제지표까지의 카운트다운 (무료) 무엇을 하는가 경제지표 발표 예정을 차트에 표시하고, 지금 보고 있는 종목을 움직일 수 있는 다음 한 건까지 카운트다운합니다. 그게 전부입니다. 거래하지 않고, 매매 신호를 그리지 않으며, 아무것도 예측하지 않습니다. 내장 내용 2084건의 발표 일정이 내장되어 있습니다(2019-01-03 ~ 2028-12-07). 각 건에 통화 태그가 붙어 있습니다: FOMC, NFP, US_CPI, US_RETAIL_SALES, USD_JOBLESS, EIA_CRUDE, AUCTION_LONG, ECB, BOE, GB_CPI, BOJ, RBA, RBNZ, BOC, CH_CPI. 외부 파일도 인터넷 연결도 필요 없습니다. 발표는 차트 종목의 구성 통화로 매칭됩니다. EURUSD에서는 유로와 달러, XAUUSD 에서는 달러 관련 발표가 보입니다. MatchSymbol을 끄면 전체, EventFilter에 태그를 나열
FREE
Algo Trading Indicaor MT5 The ATC ALGO indicator has been developed to work on the MetaTrader 5 platform. It has the same specifications and zones as the MetaTrader 4 version. There may be slight lag, which we believe is due to differences in MetaTrader 5 programming. We will work on improving it, God willing. MT5 Version                    https://www.mql5.com/en/market/product/170028 MT4 Version                    https://www.mql5.com/en/market/product/88034 With this indicator , you’ll have
The Market Structures Pro indicator finds and displays 5 (five) patterns of the Smart Money Concepts (SMC) system on the chart, namely: Break Of Structures (BoS)       Change of character (CHoCH) Equal Highs & Lows Premium, Equilibrium and Discount zones with Fibo grid High-high, Low-low, High-low and Low-high extremes Patterns are displayed for two modes - Swing and Internal and are easily distinguished by color on the chart. Internal mode features higher contrast colors, finer lines, and smal
RSIScalperPro
PATRICK WENNING
RSIScalperPro를 소개합니다 - 메타트레이더 5용 RSI 기반의 혁신적인 인디케이터로, 1분 차트에서의 스캘핑에 최적화되어 있습니다! RSIScalperPro를 사용하면 정확한 진입 및 청산 신호를 제공하는 강력한 도구를 손에 넣을 수 있습니다. RSIScalperPro는 서로 다른 두 가지 RSI 지표를 사용하여 과매수 및 과매도 레벨에 대한 명확한 신호를 제공합니다. 2개의 RSI의 시간 프레임 및 제한 값을 원하는 대로 조정하여 트레이딩 전략에 최적화된 결과를 얻을 수 있습니다. 차트 상의 개별 화살표는 거래 진입 및 청산 타이밍을 쉽게 파악하는 데 도움이 됩니다. 또한 RSIScalperPro의 특징 중 하나는 사용자 정의 가능한 3개의 이동 평균선입니다. 이를 통해 트렌드의 방향을 판단하고 강력한 거래 신호를 확인하는 데 도움이 됩니다. 이를 통해 조기에 트렌드를 감지하고 수익성 높은 거래에 참여할 수 있습니다. 뿐만 아니라 RSIScalperPro는 새로운 거래
Fvg Edge
Ahmad Meftah Abdulsalam Alawwami
5 (3)
FVG Smart Zones – 무료 버전 MetaTrader 5 (MT5)용 공정 가치 갭(FVG) 탐지 지표 단순한 지표가 아닌 실제 트레이딩 도구 를 찾고 계신가요? FVG Smart Zones – 무료 버전 은 **공정 가치 갭(FVG)**을 자동으로 감지하고 차트에 고확률 거래 구역 을 표시하여 전문적인 시장 통찰력을 제공합니다. 다음을 따르는 트레이더를 위해 설계됨: 스마트 머니 컨셉(SMC) ICT 트레이딩 컨셉 가격 행동(Price Action) 수요와 공급 분석 기관 트레이딩 전략 이 지표는 가격이 반응할 가능성이 높은 구역 에 집중할 수 있도록 도와줍니다. 주요 기능: 스마트 존 감지 상승 및 하락 FVG 자동 감지 깔끔하고 전문적인 시각적 구역 약하거나 관련 없는 갭 제거를 위한 지능형 필터링 고급 확인 기능 상위 시간대(HTF) 컨플루언스 확인 가격이 채워지면 유효하지 않은 구역 자동 제거 활성 구역과 채워
FREE
FibRetrace Zones 최근 스윙의 피보나치 되돌림 구간 FibRetrace Zones는 전문가 어드바이저 FibRetrace의 무료 비주얼 보조 도구입니다. 피보나치 되돌림 레벨을 그리고 최근 스윙의 풀백 구간을 강조 표시하여, 매매 전에 되돌림 진입점이 어디에 위치하는지 확인할 수 있습니다. 구간은 방향에 따라 색상으로 구분됩니다. 강세 셋업은 녹색, 약세 셋업은 빨간색입니다. 모든 종목과 모든 타임프레임에서 동작하며, 확정된 봉은 다시 그려지지 않습니다. 주요 기능 조정 가능한 룩백으로 자동 스윙 감지 클래식 피보나치 레벨(23.6%, 38.2%, 50%, 61.8%, 78.6%) 개별 표시 설정 가능 색상 설정이 가능한 강조 풀백 구간 방향 색상 코딩: 녹색 = 강세, 빨간색 = 약세 봉 마감 시 확정 — 리페인트 없음. 형성 중인 봉에 대한 선택적 실시간 업데이트 사용 방법 아무 차트에나 적용하세요. 가격이 색상 구간으로 되돌아오면, 바로 그곳이 FibRetrace가
FREE
QuantMatrix Probability AI Free QuantMatrix Probability AI Free is a technical indicator for MetaTrader 5 that combines several measurements of current market conditions into three numerical estimates. The indicator uses exponential moving averages, Relative Strength Index (RSI), Average True Range (ATR) and the current price position in its calculation. These measurements are combined into a normalized market score. The resulting information is displayed on the chart as: BUY percentage SELL p
FREE
The utility displays the order book, as well as increases its depth, remembering the location of applications that have gone beyond the current "window" view. With the utility user can perform quick trading actions in one click - placing/cancelling/editing of explicit and hidden orders, and also opening/editing positions. Utility features The orders book display works only on those trading symbols for which it is broadcast by the broker. To reset the information about the rows that were recorde
DGem Trade Manager Panel
Damien Jean Michel Gremillet
Trade Manager Panel ## Short description  Manage your manual trades with one click: automatic break-even, trailing stop, two-level partial close and risk-based lot sizing — all from a single on-chart panel. --- ## Full description Trade Manager Panel is an on-chart utility that takes care of your open trades so you can focus on the market instead of the order ticket. Drop it on any chart and it manages every position on that symbol automatically, while an interactive panel lets you size new
HTF Candles PO3 SMC shows candles from a higher timeframe directly on your current chart, to the right of price. You can follow the forming 4H candle, or any other timeframe, while you trade on M5 or M15, without switching charts. The indicator is built for traders who use the Power of 3 concept (accumulation, manipulation and distribution) and Smart Money Concepts. Next to the candles it shows the levels that matter for this approach, so you can read the higher timeframe context at a glance. Wh
RBM Volume Ultimate
Renato Brendim Medici
RBM Volume Ultimate RBM Volume Ultimate is an indicator for MetaTrader 5 that combines buyer and seller financial volume, cumulative delta, daily VWAP and automatic detection of absorption and exhaustion in a single panel. The purpose of the indicator is to give traders a clearer view of buying and selling flow in real time. The histogram separates financial volume between buyers and sellers on a bar by bar basis, making it easier to identify moments when pressure shifts from one side of the ma
FREE
MarginGrid
Andrej Nikitin
3 (1)
The analyzer allow estimating how the margin level changes when a position price or volume changes. It also displays price level at which StopOut and MarginCall may occur. Parameters: volume position upgrading - the number of lot position changes. number of levels on the chart - the number of levels plotted on the chart levels color - color for drawing levels
Malik Naveed Volume — Better Volume Multi Timeframe Malik Naveed Volume shows you what the volume is really doing. It reads each candle's volume and price range, splits it into buying vs selling pressure, and colours the bars so you can instantly see climax moves, absorption (churn), and low-volume exhaustion. It then draws support/resistance levels from those key bars and alerts you when price breaks and retests them — across six timeframes at once, on any symbol. Works on ANY symbol and ANY
FREE
Donchian Breakout And Rsi
Mattia Impicciatore
4.5 (2)
개요 이 지표는 클래식 돈치안 채널(Donchian Channel) 의 향상된 버전으로, 실전 트레이딩을 위한 다양한 기능이 추가되었습니다. 표준 세 개의 선(상단, 하단, 중앙선) 외에도 브레이크아웃 을 감지하여 차트에 화살표로 시각적으로 표시하며, 차트를 깔끔하게 보기 위해 현재 추세 방향의 반대 라인만 표시 합니다. 지표 기능: 시각적 신호 : 브레이크아웃 시 컬러 화살표 표시 자동 알림 : 팝업, 푸시 알림, 이메일 RSI 필터 : 시장의 상대 강도를 기반으로 신호 검증 사용자 맞춤 설정 : 색상, 선 두께, 화살표 코드, RSI 임계값 등 동작 원리 돈치안 채널은 다음을 계산합니다: 상단선 : 최근 N개의 종가 완료 캔들에서 가장 높은 고가 하단선 : 최근 N개의 종가 완료 캔들에서 가장 낮은 저가 중앙선 : 고가와 저가의 평균값 상방 브레이크아웃 은 종가가 상단선을 돌파할 때 발생하며, 하방 브레이크아웃 은 종가가 하단선 아래로 내려갈 때 발생합니다. 이 지표는: 세 개의
FREE
An indicator of patterns #45 and #46 (Three Falling Peaks and Three Rising Valleys) from Encyclopedia of Chart Patterns by Thomas N. Bulkowski. Parameters: Alerts - show alert when an arrow appears   Push - send a push notification when an arrow appears (requires configuration in the terminal) PeriodBars - indicator period K - an additional parameter that influences the accuracy of pattern shape recognition. The smaller the value is, the smoother the row of peaks/valleys should be, so fewer patt
Clock Et Mt5
Andrew Tsujiguchi
미국 동부 시간(ET)을 표시하는 간단한 시계. 미국 시장 거래 시간과 자동 동기화. 매초 업데이트. Full description: ClockET — 현재 날짜와 시간을 미국 동부 시간(ET) 기준으로 차트에 직접 표시하는 경량 인디케이터. 수동으로 시간대를 계산할 필요 없이 미국 세션이 어느 시점에 있는지 항상 정확히 알 수 있습니다. 표시 내용 • 실시간 시계 — 요일, 월, 날짜, ET 시간을 매초 업데이트하여 표시 (예: "Thu Jul 24  07:36:45 ET") • 중앙 정렬 라벨 — 차트 하단에 표시되며, 차트 크기 변경 시 자동으로 재중앙 정렬 • 자동 서머타임(DST) 감지 — 미국 공식 서머타임 일정(3월 둘째 주 일요일 ~ 11월 첫째 주 일요일)에 따라 EDT(UTC-4)와 EST(UTC-5)를 자동 전환 — 연 2회 수동 조정 불필요 설정 • 글꼴 크기, 색상, 이름 — 시계 외관 커스터마이즈 • Y축 오프셋 — 차트 하단으로부터의 수직 위치
FREE
Bar Follow EA
Aurelio Miguel Machado Da Silva
1 (1)
This robot has the purpose of operating in favor of force bars, the size of the force bar can be configured, the takeprofit and stoploss can be defined by the users or can be automatically placed by the robot (in this case the takeprofit and stoploss targets are the size of the previous bar). The values ​​defined in the parameters must be changed according to the users' needs. 
FREE
The indicator colors the candles relative to their volume delta. The calculation of the candles delta is based on the tick history or on the deals tape history (see below for a description of the input variable "Volumes"). Coloring is performed by two parameters : by delta sign, as candle color, by delta value, as candle color contrast against chart window background color. In addition to coloring the candles, the indicator also displays the delta profile on the interval specified by the user
NHK Local Time Scale NHK Local Time Scale displays your PC/local time directly on the MT5 chart , alongside the broker's native chart time. The trader can easily compare both time zones for any candle. Benefits for Traders: Quickly convert Broker Time ↔ Local/PC Time . Helps accurately set News Stop/News Filter times. Makes London, New York, Asian and other trading sessions easier to identify in your local time. Helps verify that EA session and news time settings are correct. Reduces mistakes ca
FREE
Cable Hunter EA
Mathis Philippe Jean Deroy
Cable Hunter EA Turtle Soup Strategy — Counter-breakout + RSI Divergence | GBPUSD M15 Profit Factor Max Drawdown Annual Return Walk-Forward IS/OOS 1.67 5% ~15%/year 1.51 / 1.53 Compatible: GBPUSD M15 | All MT5 brokers | FTMO / Prop firms | VPS 1. Strategy Description Cable Hunter EA is based on the Turtle Soup strategy, a counter-breakout approach that exploits false breakouts of swing levels. Markets regularly trap traders who follow classic breakouts. Cable Hunter detects these traps and trade
Rainbow MT5
Jamal El Alama
4 (1)
Description : Rainbow MT5 is a technical indicator based on Moving Average with period 34 and very easy to use. When price crosses above MA and MA changes color to green, then this is a signal to buy. When price crosses below MA and MA changes color to red, then this is a signal to sell. The Expert advisor ( Rainbow EA MT5 ) based on Rainbow MT5 indicator is now available here . MT4 version is available here .
FREE
이 제품의 구매자들이 또한 구매함
Trend Sniper X
Sarvarbek Abduvoxobov
4.9 (40)
Trend Sniper X 는 트레이더가 추세 방향과 잠재적 반전 지점을 명확하고 정확하게 포착할 수 있도록 도와주는 MetaTrader 5용 멀티 타임프레임 추세 추종 지표입니다. MT4용: https://www.mql5.com/en/market/product/193245 가격 정보: 현재 가격은 프로모션 할인가이며, 향후 업데이트 및 새로운 기능이 출시됨에 따라 변동될 수 있습니다. 보너스 혜택: 본 지표 전용 무료 자동매매 Assistant EA를 받으시려면 구매 후 작성자에게 메시지를 보내주시기 바랍니다. Code2Profit 채널 멀티 타임프레임 분석으로 시장을 마스터하세요! Trend Sniper X로 승률을 극대화하는 방법: 핵심 규칙 및 세션 팁 기술 사양 플랫폼 MetaTrader 5 지표 유형 멀티 타임프레임 추세 지표 운용 타임프레임 모든 차트 타임프레임 지원, 독립적으로 선택 가능한 상위 타임프레임(M1–MN1) 주요 상품 외환, 금(XAUUSD) 및 기타 C
Smart Trend Trading System — MetaTrader 5 구매 후 MQL5에서 저에게 메시지를 보내시면 Smart Universal Expert Advisor를 무료로 받으실 수 있으며, 온라인 강좌, PDF 매뉴얼 및 비공개 그룹 이용 권한도 함께 제공됩니다. STTS는 추세 방향, 진입·청산 신호, 반전 구간, 주요 가격 수준을 차트에 모아 보여줍니다. 시스템을 참고해 수동으로 거래하거나, 별도의 호환 EA를 연결하여 선택한 설정에 따라 자동으로 거래를 실행할 수 있습니다. 하나의 시스템, 네 가지 트레이딩 접근법 STTS의 트레이딩 접근법은 크게 네 가지로 나뉩니다. • 스캘핑 — 단기 신호와 시장 움직임을 살펴봅니다. • 추세 매매 — 방향을 평가하고 추세 안에서 기회를 찾습니다. • 반전 매매 — 잠재적인 전환 구간과 방향 변화를 파악합니다. • 거래량 매매 — 거래량 기반 정보로 시장 활동을 평가합니다. 진입·청산 화살표, 추세 정보, 지지·저항 수
Zoryk Gold
Reda El Koutbane
5 (15)
ZORYK — MetaTrader 5용 XAUUSD 전문 신호 및 트레이드 플래닝 시스템 이런 경험이 있을 것입니다. 골드를 분석하고 진입을 기다린 뒤 마침내 포지션을 열었지만 가격이 곧바로 반대 방향으로 움직입니다. 너무 일찍 청산하거나 Stop Loss를 옮기거나 몇 초 동안 망설입니다. 그 후 시장은 내가 없이도 처음 예상했던 목표까지 정확히 움직입니다. 문제는 항상 방향이 아니었습니다. 진짜 문제는 불확실성이었습니다. 정확한 진입 위치를 몰랐습니다. 어느 지점에서 원래의 트레이드 아이디어가 무효가 되는지 몰랐습니다. 가까운 수익을 확보해야 할지 더 큰 움직임을 기다려야 할지 판단하기 어려웠습니다. 현재 setup이 정말 강한지 아니면 단지 새로운 거래를 억지로 찾고 있는지도 확신하기 어려웠습니다. 골드는 매우 빠르게 움직입니다. 명확한 계획이 없다면 좋은 분석도 몇 초 만에 나쁜 결정으로 바뀔 수 있습니다. ZORYK는 이 문제를 해결하기 위해 개발되었습니다.
SuperScalp Pro
Van Minh Nguyen
4.66 (35)
SuperScalp Pro - Professional Multi-Layer Confluence Scalping System SuperScalp Pro는 클래식 Supertrend에 여러 지능형 확인 필터를 추가한 고급 스캘핑 지표입니다. 더 높은 확률의 Buy/Sell 거래 기회를 식별하는 데 도움을 주며, 잘못된 신호를 크게 줄이는 데 도움을 줍니다. 명확한 Buy 및 Sell 화살표가 차트에 직접 표시되며, ATR 기반 Stop Loss 및 Take Profit 수준이 실시간으로 자동 계산됩니다. 구매 후 설정 방법 및 권장 구성에 대한 안내가 필요하시면 저에게 문의해 주세요. SuperScalp Pro Auto Trader를 사용하여 신호를 쉽게 자동화할 수 있습니다: [Auto Trader] 권장 설정 파일 다운로드: [Set File] 전체 문서는 제품 블로그에서 확인할 수 있습니다: [User Guide] 업데이트를 확인하려면 공식 채널에 참여하세요: [Official C
SMC Intraday Formula
VividMind Digital Solutions
5 (26)
먼저 솔직하게 말하겠습니다. 어떤 인디케이터도 단독으로 당신을 수익성 있게 만들어주지 않습니다. 누군가 그렇게 말한다면, 그는 당신에게 꿈을 파는 것입니다. 완벽한 매수/매도 화살표를 보여주는 모든 인디케이터는 완벽하게 보이도록 만들 수 있습니다 — 단지 올바른 과거 구간을 확대하고 승리한 거래만 캡처하면 됩니다. 우리는 그렇게 하지 않습니다.  SMC Intraday Formula는 도구입니다. 시장 구조를 읽고, 가장 높은 확률의 가격 구간을 표시하며, 현재 스마트 머니의 흐름이 어떻게 보이는지 아주 단순한 언어로 보여줍니다. 최종 결정은 여전히 당신이 합니다. 실행도 당신이 합니다. 하지만 이제는 희망이 아니라 정확성으로 거래하게 됩니다. 우리는 이 인디케이터를 지난 약 3년 동안 골드(XAUUSD) 및 주요 외환 통화쌍의 데이 트레이딩 스캘핑에 사용해 왔습니다. M1, M5, M15, M30에서 우리의 핵심 도구입니다. 이 도구는 미래를 예측하려 하지 않습니다 — 지금 형성
Gann Made Easy MT5
Oleg Rodin
5 (10)
Gann Made Easy 는 mr.의 이론을 사용하여 최고의 거래 원칙을 기반으로 하는 전문적이고 사용하기 쉬운 Forex 거래 시스템입니다. W.D. 간. 이 표시기는 Stop Loss 및 Take Profit Levels를 포함하여 정확한 BUY 및 SELL 신호를 제공합니다. PUSH 알림을 사용하여 이동 중에도 거래할 수 있습니다. 구매 후 거래 방법 안내 및 유용한 추가 지표를 무료로 받으시려면 저에게 연락주세요! 아마도 Gann 거래 방법에 대해 이미 여러 번 들었을 것입니다. 일반적으로 Gann의 이론은 초보자 거래자뿐만 아니라 이미 거래 경험이 있는 사람들에게도 매우 복잡한 것입니다. Gann의 거래 방식은 이론적으로 적용하기 쉽지 않기 때문입니다. 나는 그 지식을 연마하고 Forex 지표에 최고의 원칙을 적용하기 위해 몇 년을 보냈습니다. 표시기는 적용하기가 매우 쉽습니다. 차트에 첨부하고 간단한 거래 권장 사항을 따르기만 하면 됩니다. 지표는 지속적으로 시장 분석
새로운 왕의 등장 - 인디케이터 + 주문 관리 표시(TP1 + TP2 + TP3) + 선택형 텔레그램 시그널 전송 기능 포함 (무료) (완전한 트레이딩 및 시그널 시스템) 골드를 위한 최고의 EA: Gold Slayer 이 인디케이터는 고급 전략, 사용자 지정 가능한 주문 관리 시스템, 그리고 엔벨로프 확장을 결합한 평균 회귀(mean reversion) 시스템을 포함하고 있습니다. 또한 RSI와 같은 여러 지능형 확인 필터를 통해 높은 확률의 반전 진입 구간을 포착하여 BUY 및 SELL 시그널을 제공합니다. 단순히 거래 방법만 배우는 것이 아니라, 여러 포지션을 효과적으로 관리하고 이전에 수익 중인 오픈 포지션으로 손실 거래를 커버하는 방법까지 익힐 수 있습니다. M5 전용으로 설계 및 최적화되었으며, 유동성이 풍부해 시그널이 더 깔끔하고 신뢰도 높은 BTCUSD와 XAUUSD에서 뛰어난 성능을 발휘합니다. 이 인디케이터는 ATR 기반으로 자동 계산된 진입가, 손절가, 익절가와
GoldenX Entry MT5
VividMind Digital Solutions
5 (16)
GoldenX Entry는 MT5용 인디케이터로, 적응형 Smart Entry Trend 알고리즘, 신호 스코어링 시스템, 시장 레짐 감지 기능, 그리고 변동성 필터를 포함합니다. 각 신호에는 계산된 진입 레벨, 3개의 익절(TP1, TP2, TP3) 레벨, 그리고 손절(Stop-Loss) 레벨이 포함됩니다. 이 인디케이터는 다양한 시장 환경에 적응하도록 설계된 다중 분석 레이어 구조 위에 구축되어 있으며, 내장 최적화기와 통계 추적 시스템을 결합합니다. 또한 Risk-to-Reward(RR) 지표와 과거 거래 행동 기반의 정량 분석을 제공합니다. 시작은 간단합니다 — 선택한 타임프레임에서 최적화기를 실행한 뒤 차트에서 바로 인디케이터를 사용하면 됩니다. 핵심 기능 GoldenX Entry는 하나의 차트에서 신호 엔진, 트레이드 관리 기능, 그리고 과거 통계 추적을 통합합니다: - 내장 최적화기: 최적화기는 차트에서 원클릭으로 실행됩니다. 200개의 파라미터 조합을 두 단계 탐색
ARIPoint
Temirlan Kdyrkhan
1 (4)
ARIPoint is a powerful trading companion designed to generate high-probability entry signals with dynamic TP/SL/DP levels based on volatility. Built-in performance tracking shows win/loss stats, PP1/PP2 hits, and success rates all updated live. Key Features: Buy/Sell signals with adaptive volatility bands Real-time TP/SL/DP levels based on ATR Built-in MA Filter with optional ATR/StdDev volatility Performance stats panel (Success, Profit/Loss, PP1/PP2) Alerts via popup, sound, push, or email Cu
Auto Optimized SpeedAngle 은 지속적인 워크포워드 최적화(Walk-Forward Optimization, WFO)를 통해 곡선 적합(curve-fitting)을 제거한 기관 수준의 모멘텀 벡터화 시스템입니다. 시장 체제가 바뀔 때 성능이 떨어지는 정적 입력에 의존하는 대신, 이 지표는 표본 외(Out-of-Sample, OOS) 검증을 사용하여 매개변수를 동적으로 재보정하며, 표시되는 신호가 과거의 우연이 아닌 진정한 통계적 우위를 나타내도록 보장합니다. 핵심 기관용 프레임워크 워크포워드 최적화 엔진: 핵심 알고리즘은 수천 가지의 룩백(lookback) 및 임계값 조합을 지속적으로 스캔하며, 데이터를 인샘플(in-sample)과 표본 외(out-of-sample) 세트로 엄격하게 분리합니다. 미지의 데이터 환경에서 수학적 우수성이 증명된 경우에만 새로운 매개변수 구성을 채택합니다. 정량적 목적 함수: 순수한 총이익을 쫓는 대신, 최적화 엔진은 기관 수준의 안정성
Neuro Poseidon MT5
Daria Rezueva
4.75 (52)
Neuro Poseidon is a new indicator by Daria Rezueva. It combines precise trading signals with adaptive TP/SL levels - creating best possible trades as a result! Message me and get  Neuro Poseidon Assistant  as a gift to automize your trading process! What makes it stand out? 1. Proven profitability on all assets and timeframes 2. Only confirmed BUY and SELL signals present on the chart 3. Adaptive TP & SL levels generated by the software for each trade 4. Easy to understand - suitable for al
Entry Points Pro for MT5
Yury Orlov
4.52 (151)
전설이 돌아왔습니다: Entry Points Pro 10. MQL5 마켓 Top-3 자리를 3년간 지켜온 전설적인 지표의 재출시입니다. 수백 개의 호평 리뷰(두 버전 합산 589개), 매일 이 지표로 거래하는 수천 명의 트레이더, 31,000회 이상의 데모 다운로드   MT4+MT5 . 지난 5년간 여러분이 남긴 리뷰를 하나도 빠짐없이 읽었고, 약속 대신 그 답을 버전 10에 담았습니다. 1999년부터 시장에서 활동하며 정직함과 자신의 평판, 그리고 고객을 소중히 여기는 개발자가 만들었습니다. Entry Points Pro의 진입 시그널은 절대 리페인팅되지 않습니다. 그리고 이번에는 개발자의 말뿐이 아니라 검증 가능한 사실입니다: 확정 시그널은 캔들 종가에서만 표시되며, 자동화 테스트에서 리페인팅 0건 이 확인되었습니다(EURUSD, XAUUSD, BTCUSD에서 2,486,568회의 불변조건 검사 — 위반 0건). 검증 방법은 공개되어 있으니 전략 테스터에서 직접 재현해 보실 수
FiboSniper Pro
Van Minh Nguyen
5 (3)
FiboSniper Pro – Multi-Filter Fibonacci System with Auto SL/TP and Control Panel FiboSniper Pro는 동적 Fibonacci Envelopes와 여러 확인 필터를 결합하여 선별된 Buy 및 Sell 신호를 생성하는 기술적 지표입니다. Fibonacci 레벨은 Moving Average와 ATR을 기반으로 계산된 후 ADX, EMA, RSI, ATR, Volume, Time 및 Candle 구조를 통해 필터링됩니다. 이 지표는 ATR 기반의 자동 Stop Loss 및 Take Profit 레벨을 차트에 직접 표시하며, 빠른 설정 조정을 위한 인터랙티브 Control Panel을 제공합니다. 구매 후 권장 설정 파일과 자세한 사용 방법을 받으려면 저에게 문의해 주세요. Auto Trader X를 사용하여 FiboSniper Pro 신호를 자동화할 수 있습니다: [Auto Trader X] User Guide 및 Se
Welcome to ENTRY IN THE ZONE AND SMC MULTI TIMEFRAME SPECIAL BENEFIT / FOR OUR MQL5 CUSTOMERS FREE ACCESS TO THE NEW TOOL  — COMING SOON — Learn more on our official website  : https://www.fableedge.net Entry In The Zone and SMC Multi Timeframe is a real-time market analysis tool based on Smart Money Concepts (SMC), designed to analyze market structure, price direction, and key trading zones. It supports both Single-Timeframe Analysis and Multi-Timeframe Analysis, providing a clearer view of the
Unix Scalper
Issam Kassas
4 (4)
Unix Scalper — MetaTrader 5 구매 후 MQL5에서 저에게 메시지를 보내시면 Smart Universal Expert Advisor를 무료로 받으실 수 있으며, 온라인 강좌, PDF 매뉴얼 및 비공개 그룹 이용 권한도 함께 제공됩니다. 매매 기회를 찾고, 거래 계획을 확인하고, 실행 방법을 선택하세요. UNIX Scalper는 시장 분석, BUY/SELL/WAIT 판단, Entry, Stop Loss, TP1 및 TP2 가격 수준을 하나의 정돈된 패널에 제공합니다. 신호와 거래 계획을 한눈에 • 명확한 판단: BUY, SELL 또는 WAIT. • 구체적인 가격 수준: Entry, Stop Loss, TP1 및 TP2. • 다중 시간대 개요: 패널의 여러 시간대 신호를 비교하세요. • 판단을 돕는 분석: 추세, 모멘텀, 거래량, 변동성, 지지와 저항, 시장 품질. • 다양한 레이아웃: Minimized, Compact, Standard 또는 Full. 신호와
M1 Sniper MT5
Oleg Rodin
5 (7)
M1 SNIPER 는 사용하기 쉬운 거래 지표 시스템입니다. M1 시간대에 맞춰 설계된 화살표 지표입니다. 이 지표는 M1 시간대 스캘핑을 위한 단독 시스템으로 사용할 수 있으며, 기존 거래 시스템의 일부로도 사용할 수 있습니다. 이 거래 시스템은 M1 시간대 거래용으로 특별히 설계되었지만, 다른 시간대에도 사용할 수 있습니다. 원래는 XAUUSD와 BTCUSD 거래를 위해 이 방법을 설계했지만, 다른 시장 거래에도 유용하다는 것을 알게 되었습니다. 이 지표의 신호는 추세 방향과 반대로 거래될 수 있습니다. 저는 지표의 신호를 활용하여 양방향으로 거래할 수 있도록 돕는 특별한 거래 기법을 알려드립니다. 이 방법은 특별한 동적 지지선과 저항선 가격 영역을 활용하는 것을 기반으로 합니다. 구매하시면 M1 SNIPER 화살표 지표를 바로 다운로드하실 수 있습니다. 또한, 아래 스크린샷에 표시된 Apollo Dynamic SR 지표는 M1 SNIPER 도구를 사용하는 모든 사용자에게 무료로
Tokyo mt5 Indicator
Vasiliy Strukov
5 (7)
Tokyo Indicator는 추세 방향, 잠재적 거래 신호 및 시장 상황을 명확하고 시각적으로 보여줍니다. 색상으로 구분된 계단식 추세선은 강세 구간(파란색)과 약세 구간(자홍색)을 명확히 구별해 줍니다. 추세가 전환될 때 나타나는 방향성 화살표는 잠재적인 매수 및 매도 기회를 강조하여 보여줍니다. 통합 대시보드는 현재 신호, 시장 성향(bias), 모멘텀, 변동성, 신호 품질 등의 정보를 한눈에 파악할 수 있도록 구성되어 있습니다. 이를 통해 트레이더는 별도의 패널을 오갈 필요 없이 가격 움직임(price action)과 지표의 데이터를 동시에 분석할 수 있습니다. 깔끔한 차트 화면과 간결한 시장 개요를 제공하는 Tokyo Indicator는 체계적인 추세 분석과 거래 결정을 지원합니다. 모든 시간대와 다양한 자산(특히 금)에서 활용할 수 있습니다. 추세 방향, 잠재적 거래 신호 및 시장 상황을 명확하고 시각적으로 보여줍니다. 색상으로 구분된 계단식 추세선은 강세 구간(파란색)
FX Trend MT5 NG
Daniel Stein
5 (6)
FX Trend NG: 차세대 멀티 마켓 트렌드 인텔리전스 개요 FX Trend NG 는 다중 시간 프레임 기반의 전문 트렌드 분석 및 시장 모니터링 도구입니다. 몇 초 만에 전체 시장 구조를 파악할 수 있도록 설계되었습니다. 여러 차트를 일일이 전환할 필요 없이, 어떤 종목이 추세에 있는지, 어디에서 모멘텀이 약화되고 있는지, 그리고 어떤 시간 프레임이 서로 정렬되어 있는지 즉시 확인할 수 있습니다. 출시 기념 특별 혜택 – FX Trend NG 를 $30 (6개월) 또는 $80 평생 라이선스 로 이용할 수 있습니다. 이미 Stein Investments 고객이신가요? -> 메시지를 보내 전용 고객 그룹에 참여하세요. 설정이나 사용 방법이 필요하신가요? -> Stein Investments 공식 페이지 를 방문하세요. 1. FX Trend NG가 특별한 이유 3단계 추세 로직 – 단순한 Buy / Sell이 아닙니다 • 대부분의 지표는 Buy 또는 Sell 두 가지 상태만 제
Adaptive Price Action Engine 지표를 구매하면 EA(자동매매 프로그램)가 무료 멀티 타임프레임 기반 자기 최적화 추세 & 캔들 패턴 분석 시스템 시장은 끊임없이 변화하며, 모든 Price Action 패턴이 모든 시장 환경에서 동일한 가치를 가지는 것은 아닙니다. Adaptive Price Action Engine 은 변화하는 시장 환경에 적응할 수 있도록 설계되었으며, 추세 구조, 멀티 타임프레임 분석, 캔들 패턴 및 통계적 최적화 를 하나의 분석 프레임워크로 결합합니다. 두 가지 적응형 모드 Dual Alpha Trend Mode 낮은 타임프레임과 높은 타임프레임에서 적합한 Alpha Trend 파라미터를 자동으로 탐색하여, 최근 시장 움직임에 맞춰 추세 분석을 조정합니다. Candlestick + Alpha Mode Alpha Trend를 통한 시장 국면 분석과 22개의 상승 및 하락 캔들 패턴 을 결합합니다. 모든 패턴을 동일하게 취급하는 대신, 다양
Smart Price Action Concepts — MetaTrader 5 구매 후 MQL5에서 저에게 메시지를 보내시면 Smart Universal Expert Advisor를 무료로 받으실 수 있으며, 온라인 강좌, PDF 매뉴얼 및 비공개 그룹 이용 권한도 함께 제공됩니다. 구조를 확인하고, 구간을 파악하고, 거래 계획을 세우세요. Smart Money Concepts(SMC), ICT 방식의 분석, 가격 행동 분석을 하나의 정돈된 차트에서 활용하세요. 시장 구조, 오더 블록, 유동성 참고 수준과 불균형을 파악하고, Smart Panel에서 표시할 요소를 선택할 수 있습니다. 시장을 더 체계적으로 분석하세요 • 시장 구조: 내부 및 스윙 구조, HH/HL/LL/LH, BOS와 CHoCH, 상위 시간대 분석 및 다중 시간대 대시보드. • 주요 구간: 내부 및 스윙 오더 블록, 수요와 공급, Fair Value Gaps, 프리미엄·균형·디스카운트 구간. • 유동성 참고 수준:
Power Candles MT5
Daniel Stein
4.58 (12)
Power Candles V3 - 자체 최적화 강도 지표 파워 캔들 V3는 적용된 모든 차트에서 통화 및 상품의 강세를 실행 가능한 거래 계획으로 전환합니다. 단순히 캔들에 색상을 입히는 대신, 백그라운드에서 실시간 자동 최적화를 수행하여 현재 보고 있는 종목에 대한 최적의 손절매, 익절 및 신호 임계값을 제공합니다. 한 번의 클릭으로 실시간 거래에 적용할 수 있으며, 진입점, 손절매 및 익절 선이 정확한 가격에 맞춰 차트에 표시되고, 방향과 함께 알림이 발령됩니다. 이 도구는 Stein Investments 에코시스템의 일부입니다. 18개 이상의 도구와 함께 당신의 1대1 AI 트레이딩 멘토 Max.  항상 대기 중, 모든 인디케이터를 깊이 있게 이해, 무언가를 차근차근 생각해보고 싶은 순간에 도움을 줍니다.  https://stein.investments 에서 만나보세요 매 종가 바마다 3,000회 이상의 트레이딩 시뮬레이션. 9가지 강도 상태. 2가지 전략을 병렬로 테스트.
Market Structure Order Block Dashboard MT5는 시장 구조와 주요 가격 반응 구역을 차트에서 직접 읽고자 하는 트레이더를 위해 설계된 MT5 지표입니다. BOS, ChoCH, 오더 블록, Fair Value Gap (FVG), 유동성, Kill Zones, Volume Profile 그리고 빠른 분석을 위한 콤팩트한 대시보드를 결합합니다. 이 지표는 시장 구조, ICT 및 Smart Money 개념을 의사결정 프레임워크로 사용하는 트레이더를 대상으로 합니다. 추세 지속, 가능한 반전, 가격 불균형, 유동성 타겟 및 관심 구역을 보다 체계적으로 식별하는 데 도움을 줄 수 있습니다. 구매자를 위한 포함 리소스 구매 후 MQL5 개인 메시지로 요청하시면 완전한 PDF 사용 설명서와 파라미터 설정 팁을 제공해 드립니다. MQL5 개인 메시지를 통한 직접 기술 지원. 1.20 버전은 두 가지 주요 추가 기능을 제공합니다: Pending BOS / Pending
Scalper Vault 는 성공적인 스캘핑에 필요한 모든 것을 제공하는 전문 스캘핑 시스템입니다. 이 표시기는 외환 및 바이너리 옵션 거래자가 사용할 수 있는 완전한 거래 시스템입니다. 권장 시간 프레임은 M5입니다. 시스템은 추세 방향으로 정확한 화살표 신호를 제공합니다. 또한 상단 및 하단 신호와 Gann 시장 수준을 제공합니다.  이 시스템은 사용하기가 매우 쉽습니다. 원하는 시장 지역의 화살표만 따라가면 됩니다. 엑시트는 가격이 적정 수준에 도달하거나 시장의 고점 또는 저점 신호가 나타날 때 수행됩니다.  표시기는 PUSH 알림을 포함한 모든 유형의 경고를 제공합니다. 인디케이터 구매 후 연락주세요. 내 개인 거래 권장 사항과 훌륭한 보너스 지표를 무료로 공유합니다! 나는 당신에게 행복하고 유익한 거래를 기원합니다!
Atomic Analyst MT5
Issam Kassas
4.47 (60)
Atomic Analyst — MetaTrader 5 구매 후 MQL5에서 저에게 메시지를 보내시면 Smart Universal Expert Advisor를 무료로 받으실 수 있으며, 온라인 강좌, PDF 매뉴얼 및 비공개 그룹 이용 권한도 함께 제공됩니다. Atomic Analyst는 가격 움직임 분석, 추세 방향, 진입·청산 신호, 손절 수준, 여러 익절 수준을 차트에 모아 보여줍니다. 신호를 확인하고 매매 상황을 이해하세요 Atomic Analyst는 분석 결과를 명확한 시각 정보로 정리합니다. • 잠재적인 진입 기회를 확인할 수 있는 매수·매도 화살표. • 거래 계획에 도움이 되는 손절 수준과 여러 익절 수준. • 시장 방향을 평가할 수 있는 추세, 강도, 모멘텀 수치. • 더 넓은 시장 맥락을 비교할 수 있는 여러 시간대 분석. • 변화하는 시장 상황을 따라갈 수 있는 색상별 캔들과 알림. 신호와 보조 분석을 함께 검토한 다음, 해당 매매 상황이 자신의 거래 규칙에
FX Power MT5 NG
Daniel Stein
5 (33)
FX Power: 통화 강세 분석으로 더 스마트한 거래 결정을 개요 FX Power 는 어떤 시장 상황에서도 주요 통화와 금의 실제 강세를 이해하기 위한 필수 도구입니다. 강한 통화를 매수하고 약한 통화를 매도함으로써 FX Power 는 거래 결정을 단순화하고 높은 확률의 기회를 발견합니다. 트렌드를 따르거나 극단적인 델타 값을 사용해 반전을 예측하고자 한다면, 이 도구는 귀하의 거래 스타일에 완벽히 적응합니다. 단순히 거래하지 말고, FX Power 로 더 스마트하게 거래하세요. 1. FX Power가 거래자에게 매우 유용한 이유 통화와 금의 실시간 강세 분석 • FX Power 는 주요 통화와 금의 상대적 강세를 계산하고 표시하여 시장 역학에 대한 명확한 통찰력을 제공합니다. • 어떤 자산이 앞서고 있고 어떤 자산이 뒤처지는지 모니터링하여 보다 현명한 거래 결정을 내릴 수 있습니다. 포괄적인 멀티 타임프레임 뷰 • 단기, 중기 및 장기 타임프레임에서 통화와 금의 강세를
Divergence Bomber
Ihor Otkydach
4.89 (94)
이 지표를 구매하신 분께는 다음과 같은 혜택이 무료로 제공됩니다: 각 거래를 자동으로 관리하고, 손절/익절 수준을 설정하며, 전략 규칙에 따라 거래를 종료하는 전용 도우미 툴 "Bomber Utility" 다양한 자산에 맞게 지표를 설정할 수 있는 셋업 파일(Set Files) "최소 위험", "균형 잡힌 위험", "관망 전략" 모드로 설정 가능한 Bomber Utility의 셋업 파일 이 전략을 빠르게 설치, 설정, 시작할 수 있도록 돕는 단계별 영상 매뉴얼 주의: 위의 모든 보너스를 받기 위해서는 MQL5 개인 메시지 시스템을 통해 판매자에게 연락해 주세요. 독창적인 커스텀 지표인 “Divergence Bomber(다이버전스 봄버)”를 소개합니다. 이 지표는 MACD 다이버전스(괴리) 전략을 기반으로 한 올인원(All-in-One) 거래 시스템입니다. 이 기술 지표의 주요 목적은 가격과 MACD 지표 간의 다이버전스를 감지하고, **향후 가격이 어느 방향으로 움직일지를 알려주
Crystal Heikin Ashi Signals
Muhammad Jawad Shabir
5 (4)
Crystal Heikin Ashi Signals—Professional Trend & Signal Detection Indicator Advanced Heikin Ashi Visualization with Intelligent Signal System for Manual & Automated Trading Final Price: $149 ---------> Price goes up $10 after every 10 sales . Limited slots available — act fast . Overview User Guide PDF Crystal Heikin Ashi Signals is a professional-grade MetaTrader 5 indicator that combines pure Heikin Ashi candle visualization with an advanced momentum-shift detection system. Designed for both m
DayTrader PRO
Davit Beridze
5 (4)
DayTrader PRO DayTrader PRO는 존 에러스(John Ehlers)의 Laguerre 필터와 강력한 자동 최적화 엔진을 결합한 고급 트레이딩 지표입니다. 고정된 파라미터를 사용하는 대신, 최근 시장 상황을 바탕으로 최적의 설정을 자동으로 검색하므로 지속적인 수동 조정 없이도 변화하는 시장 변동성에 대응할 수 있습니다. 이 지표는 명확한 매수(BUY) 및 매도(SELL) 신호를 생성하며, 현재 시장 변동성을 기준으로 계산된 적응형 손절매(Stop Loss) 및 익절(Take Profit) 레벨을 제공합니다. 내장된 추세, 효율성 지수(Efficiency Ratio), 변동성 및 캔들 필터 기능은 저품질의 진입 신호를 제거하여 신호의 정확도를 높여줍니다. 실시간 성능 대시보드에서는 현재 최적화된 설정값, 수익 요인(Profit Factor), 승률(Win Rate), 최대 낙폭(Drawdown) 및 기타 트레이딩 통계를 확인할 수 있습니다. 또한 DayTrader PR
Quant Direction MT5
Georgios Kalomoiropoulos
Quant Direction 은 3D 시장 분석 도구입니다. 다양한 매개변수에 걸쳐 정확한 백분율 편차를 계산하면서 완벽하게 객관적인 알고리즘 기반 시장 분석을 제공합니다. 첨단 AI 기반 모델링 도구와 엄격한 테스트를 거쳐 개발된 이 알고리즘은 타의 추종을 불허하는 정확도로 시장을 분석합니다. 플랫폼에서 모든 통화쌍 또는 금융 상품을 분석할 수 있습니다. 단기 거래, 데이 트레이딩, 스윙 트레이딩 등 어떤 유형의 거래를 하든 Quant Direction은 최적의 선택입니다. 운영자가 되는 것의 진정한 이점 퀀트 디렉션의 진정한 장점은 감정, 눈의 피로, 과도한 분석을 완전히 배제한다는 점입니다. 더 이상 수십 개의 차트를 일일이 살펴보며 방향을 찾거나 자신의 판단에 끊임없이 의문을 품을 필요가 없습니다. 이 시스템은 8개의 시간 간격(5개월에서 수개월까지)을 밀리초 단위로 처리합니다. 특정 시점의 주요 시장 참여자를 정확하게 식별하여 항상 성공 확률이 가장 높은 방향으로 거래할
Smc Pro ToolKit
Talal N Z Aljarusha
5 (13)
SMC PRO TOOLKIT — SMART MONEY ANALYSIS & STRUCTURED TRADE PLANNING SMC Pro ToolKit is a professional Smart Money Concepts analysis workspace for MetaTrader 5. It combines market structure, multi-timeframe analysis, institutional price zones, setup evaluation, confirmation tools, volume context, alerts, and risk planning inside one organized chart environment. One workspace. Multiple layers of confirmation. One structured trading plan. OPEN COMPLETE USER GUIDE MULTI-CONDITION SETUP ENGINE At
제작자의 제품 더 보기
See the Dow Theory direction of six timeframes in one panel. DowgatorPro2 judges the current trend direction (up or down) automatically by Dow Theory, using closed bars only. It carries over the features of the earlier e-DowgatorPro and puts first that even a beginner can read the direction without confusion. The direction of six timeframes (M1 to D1) is shown on the panel in color. Features Check direction mismatch: see on the panel whether your chart's timeframe agrees with the higher timefram
The levels of higher timeframes, on the chart you are watching. LineTraderPro2 finds swing highs and lows with Dow Theory rules and draws horizontal lines at the levels the market watches, for any of 20 timeframes from M1 to W1. Each line is labeled with its timeframe (H1, D1 and so on) and the date of the swing, so you can see at a glance which timeframe a level belongs to without switching charts. What you see on the chart Horizontal lines: the swing highs above the price and the swing lows be
See the market's fear level on the chart you trade. VixChecker shows the VIX (the volatility index often called the fear index) in a sub-window as one bar per day, colored by level: normal (blue), caution (yellow, 20 or above by default) and fear (red, 30 or above). The current value, the change from the previous close and the time of the value are shown in a small panel, and the value can also be shown on the main chart. Where the VIX values come from (please read before buying) The indicator d
Round numbers on your chart, and a notice when the price gets close. RoundNumberAlert draws horizontal lines at round numbers (150.000, 150.500 ...) and watches them for you. When the price enters the touch range, only that line blinks and you get one notification. Major round numbers stand out in gold, and a small panel shows how many pips are left to the next round number above and below. Features Round-number lines: the step starts at 10 pips (for example 50 pips: 150.000, 150.500 ...). Major
Entry signals as finger marks: yellow for trend-following, pink for counter-trend. SignRAMB combines RSI, ATR, MACD, a moving average, Dow theory and the candles, and marks the places where the price may turn up or down, based on past chart patterns. A finger pointing up is a buy, pointing down is a sell. Signals are decided on closed bars and never repaint. Signals are not always right. Use them as one indicator, together with your own reading of the chart. They are meant for the move right aft
Which currency is strong right now — in one panel. CurrencyStrength takes the RSI of the 28 pairs of USD, EUR, JPY, GBP, AUD, CHF, CAD and NZD, turns it into a score from −100 to +100 for each currency, and shows them as bars, strongest first. Features Strength ranking: strong currencies in green, weak ones in red, scored from −100 to +100. Automatic symbol detection: the pairs are found from each symbol's base and profit currency, so suffixes and prefixes (EURUSD#, EURUSD.pro, m.EURUSD, EURUSDm
Trendlines drawn for you — and a good shape kept as your basis. TrendLineSnap finds the swing highs and swing lows on your chart, joins them and draws one high trendline and one low trendline. Triangles, channels, wedges and horizontal levels used in line trading show up as lines. Automatic trendlines are redrawn whenever a new swing forms. When you see a shape you want to trade, save it. The saved line does not move. When the price comes near it again, show the saved line next to the current li
Where is the price inside the range — in one panel. BoxRangeSnap looks for price zones where the highs and lows touched the same top and bottom again and again, and draws them as a big box and a small box. The panel keeps showing the distance from the price to the top and bottom of the current box. Features Automatic range boxes: a big box and a small box, newest first. The current box is highlighted and extends to the last closed bar. Adjustable detection: minimum touches on the top and bottom,
See the Dow Theory direction of six timeframes in one panel. DowgatorPro2 judges the current trend direction (up or down) automatically by Dow Theory, using closed bars only. It carries over the features of the earlier e-DowgatorPro and puts first that even a beginner can read the direction without confusion. The direction of six timeframes (M1 to D1) is shown on the panel in color. Features Check direction mismatch: see on the panel whether your chart's timeframe agrees with the higher timefram
The levels of higher timeframes, on the chart you are watching. LineTraderPro2 finds swing highs and lows with Dow Theory rules and draws horizontal lines at the levels the market watches, for any of 20 timeframes from M1 to W1. Each line is labeled with its timeframe (H1, D1 and so on) and the date of the swing, so you can see at a glance which timeframe a level belongs to without switching charts. What you see on the chart Horizontal lines: the swing highs above the price and the swing lows be
Know exactly how long until the next release, and what came out. EconomicStopper shows the time to each economic release as a countdown, lists the upcoming events with their importance, and shows the actual value and the surprise against the forecast after the release. Everything is in one panel on the chart. It reads the economic calendar built into MetaTrader 5, so it needs no DLL and no web requests. How it behaves over time More than 5 minutes before: the timer counts down every second and t
See the market's fear level on the chart you trade. VixChecker shows the VIX (the volatility index often called the fear index) in a sub-window as one bar per day, colored by level: normal (blue), caution (yellow, 20 or above by default) and fear (red, 30 or above). The current value, the change from the previous close and the time of the value are shown in a small panel, and the value can also be shown on the main chart. Where the VIX values come from (please read before buying) The indicator d
Round numbers on your chart, and a notice when the price gets close. RoundNumberAlert draws horizontal lines at round numbers (150.000, 150.500 ...) and watches them for you. When the price enters the touch range, only that line blinks and you get one notification. Major round numbers stand out in gold, and a small panel shows how many pips are left to the next round number above and below. Features Round-number lines: the step starts at 10 pips (for example 50 pips: 150.000, 150.500 ...). Major
Entry signals as finger marks: yellow for trend-following, pink for counter-trend. SignRAMB combines RSI, ATR, MACD, a moving average, Dow theory and the candles, and marks the places where the price may turn up or down, based on past chart patterns. A finger pointing up is a buy, pointing down is a sell. Signals are decided on closed bars and never repaint. Signals are not always right. Use them as one indicator, together with your own reading of the chart. They are meant for the move right aft
Which currency is strong right now — in one panel. CurrencyStrength takes the RSI of the 28 pairs of USD, EUR, JPY, GBP, AUD, CHF, CAD and NZD, turns it into a score from −100 to +100 for each currency, and shows them as bars, strongest first. Features Strength ranking: strong currencies in green, weak ones in red, scored from −100 to +100. Automatic symbol detection: the pairs are found from each symbol's base and profit currency, so suffixes and prefixes (EURUSD#, EURUSD.pro, m.EURUSD, EURUSDm
Trendlines drawn for you — and a good shape kept as your basis. TrendLineSnap finds the swing highs and swing lows on your chart, joins them and draws one high trendline and one low trendline. Triangles, channels, wedges and horizontal levels used in line trading show up as lines. Automatic trendlines are redrawn whenever a new swing forms. When you see a shape you want to trade, save it. The saved line does not move. When the price comes near it again, show the saved line next to the current li
필터:
리뷰 없음
리뷰 답변