DowTheoryVisual Dow Theory Swing Trend MT4
- 지표
-
Naoto Shimoda
 FX.Hamrat - MetaTrader 4/5 indicator and Expert Advisor developer based in Japan.
Over 10 years of trading experience (discretionary and systematic), and 90+ MT4/MT5 programs built so far - including 30+ custom-made projects for individual traders. - 버전: 1.1
- 활성화: 10
The Dow Theory structure of the chart — in one look.
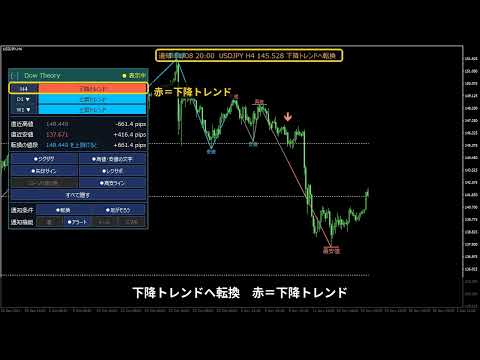
DowTheoryVisual labels every swing high and low as HH, HL, LH or LL and draws a zigzag colored by the trend: blue for an uptrend, red for a downtrend, gray for a range. The panel keeps showing the trend of the current chart and of two higher timeframes side by side.
Features
- HH / HL / LH / LL labels: each swing high and low is compared with the previous one.
- Trend-colored zigzag: up blue, down red, range gray. The color changes on the bar where the trend changed.
- Arrow signs: on the bar where the trend changed. Closed bars only.
- Two higher timeframes on the panel, next to the current chart. Switch them with the v buttons (M5 to MN).
- Turn level: the price where the current trend would turn, and the distance in pips.
- Support / resistance from levels broken again and again, and short lines on the last swing high and low.
- Candle coloring by trend with one button.
- Notifications: sound, alert, e-mail and push when the trend changes and when all three timeframes line up. Each kind at most once per 60 seconds (adjustable).
- Movable panel: drag the title to move it, click it to fold. Works on 125% / 150% display scaling.
How the trend is decided
A bar higher (lower) than the 14 bars on each side is a swing high (low); highs and lows alternate. In an uptrend an LH or LL turns it into a range; in a downtrend an HH or HL turns it into a range. In a range, breaking above the recent high starts an uptrend and breaking below the recent low starts a downtrend. Higher timeframes use the same steps. Swing labels appear after the following bars close, and when a new swing is confirmed the latest arrow sign may move.
Inputs (main)
- Swing bars on each side, bars to calculate
- Trend colors; zigzag, labels, arrow signs, swing lines, candle coloring
- Support / resistance: max lines, merge width, minimum count, style
- Higher timeframes 1 / 2
- Panel: show, position, colors, font size, transparent background
- Time zone, notification interval, notification messages
It does not give buy or sell signals and does not guarantee profits.