ATS Daily Volume Profile
- 지표
-
Andrea Michelon
 Andrea (Andy), 이탈리아. 1990년대부터 독학한 프로그래머이며, 현재 Andy Trading Solutions (ATS) 이름으로 MetaTrader 5 도구를 개발합니다.
제 원칙: 로직을 실제 데이터와 브로커의 실제 스프레드로 검증한 후에만 Market에 올립니다. 그리드, 마틴게일, 리페인트, 수익 약속은 없습니다. 통계가 약하면 제품 페이지에 그대로 씁니다.
무료 도구 - 버전: 1.0
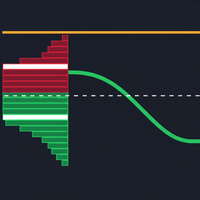
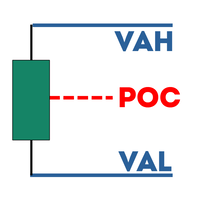
ATS Daily Volume Profile shows where the market actually traded today and yesterday: a horizontal volume histogram for each day, the POC (the most traded price) and the value area.
WHAT YOU SEE
- Daily volume profile for today and yesterday, drawn behind the candles
- Heat colours: cold blue where little was traded, gold and red where most of the volume was
- 3D depth shadow on every row (can be switched off)
- POC as a thick gold line, value area high and low as dotted lines, rows outside the value area dimmed
- Small dashboard: today POC, value area, price above / inside / below the value area, volume source
VOLUME SOURCE
When the broker provides real exchange volume (futures, stocks) it is used automatically. Spot gold, forex and most CFDs have no central exchange, so tick volume (number of price changes) is used instead. This is the standard approach for volume profiles in MetaTrader, and the panel always tells you which one is in use.
SETTINGS
Volume source (auto / real / tick), rows per profile, value area %, histogram width, 3D shadow on/off, heat colours on/off, colours, dashboard on/off, theme and position.
Works on any symbol, best on timeframes from M5 to H1. The indicator only draws: it never opens, modifies or closes an order.
If this tool helps you, a short review is appreciated. Questions or ideas for a feature? Write to me in the comments.
Andy Trading Solutions