ATS Daily Performance
- 지표
-
Andrea Michelon
 Andrea (Andy), 이탈리아. 1990년대부터 독학한 프로그래머이며, 현재 Andy Trading Solutions (ATS) 이름으로 MetaTrader 5 도구를 개발합니다.
제 원칙: 로직을 실제 데이터와 브로커의 실제 스프레드로 검증한 후에만 Market에 올립니다. 그리드, 마틴게일, 리페인트, 수익 약속은 없습니다. 통계가 약하면 제품 페이지에 그대로 씁니다.
무료 도구 - 버전: 1.0
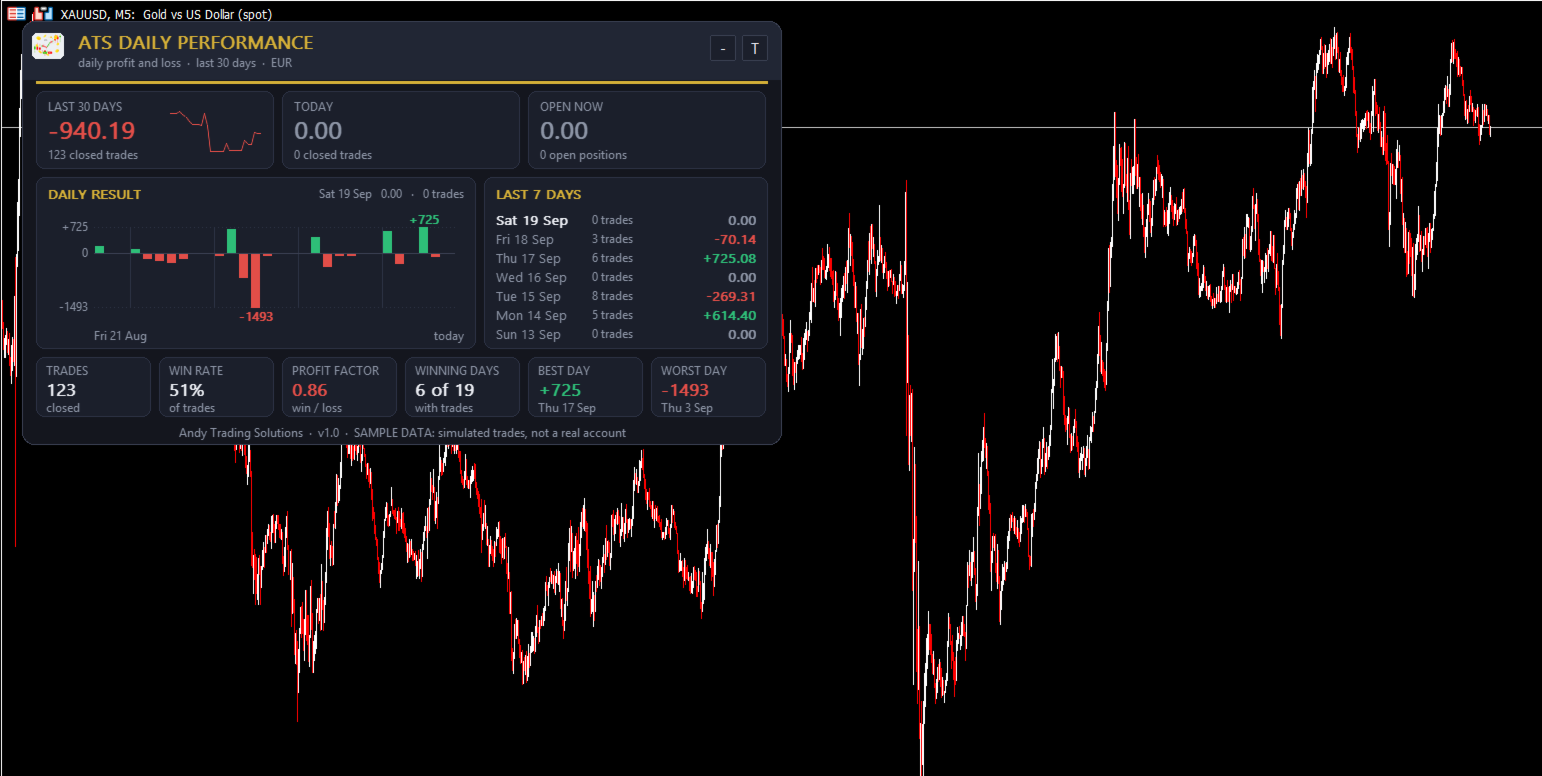
ATS Daily Performance shows your profit and loss day by day for the last 30 days, as bars and numbers on a compact dashboard on your chart. Open it and see at a glance which days made money, which lost, and how your month is going.
WHAT YOU SEE
- One bar per day: green for a winning day, red for a losing one
- Net result of the last 30 days, today's result and the profit or loss of the trades still open
- Win rate, winning days, profit factor, best day and worst day
- The last 7 days listed with their result
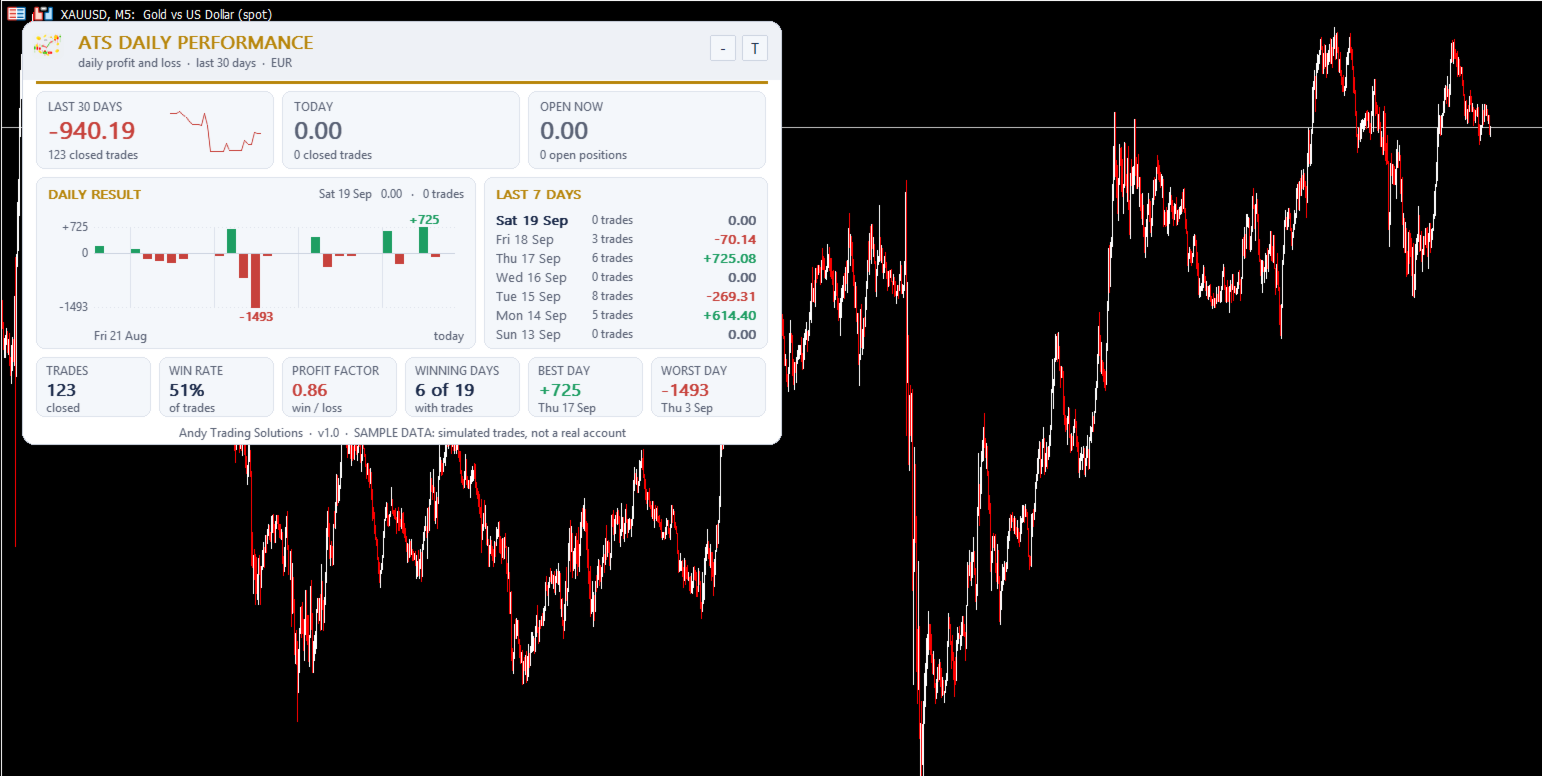
- Dark and light themes, draggable panel
HOW IT WORKS
The indicator reads the deal history of your account and adds up profit, swap and commission for every day. Days follow the broker server time. You can count the whole account or only the symbol of the chart, and you can leave swap and commission out.
The indicator reads the history only. It never opens, modifies or closes an order and needs no trading permission.
Screenshots show simulated sample trades, not a live or demo account. They illustrate the dashboard, not a result.
SETTINGS
Deals counted (whole account / chart symbol), include swap and commission, show panel, theme (dark / light / auto), panel position.
Works on any symbol and timeframe.
CUSTOM VERSION: need these statistics for one EA (magic number), one symbol, or with prop-firm drawdown rules? I build custom editions on request. Send me a private message with what you need.
If this tool helps you, a short review is appreciated. Questions or ideas for a feature? Write to me in the comments.
Andy Trading Solutions