Price Pattern Breakouts
- 지표
- 버전: 3.0
- 활성화: 5

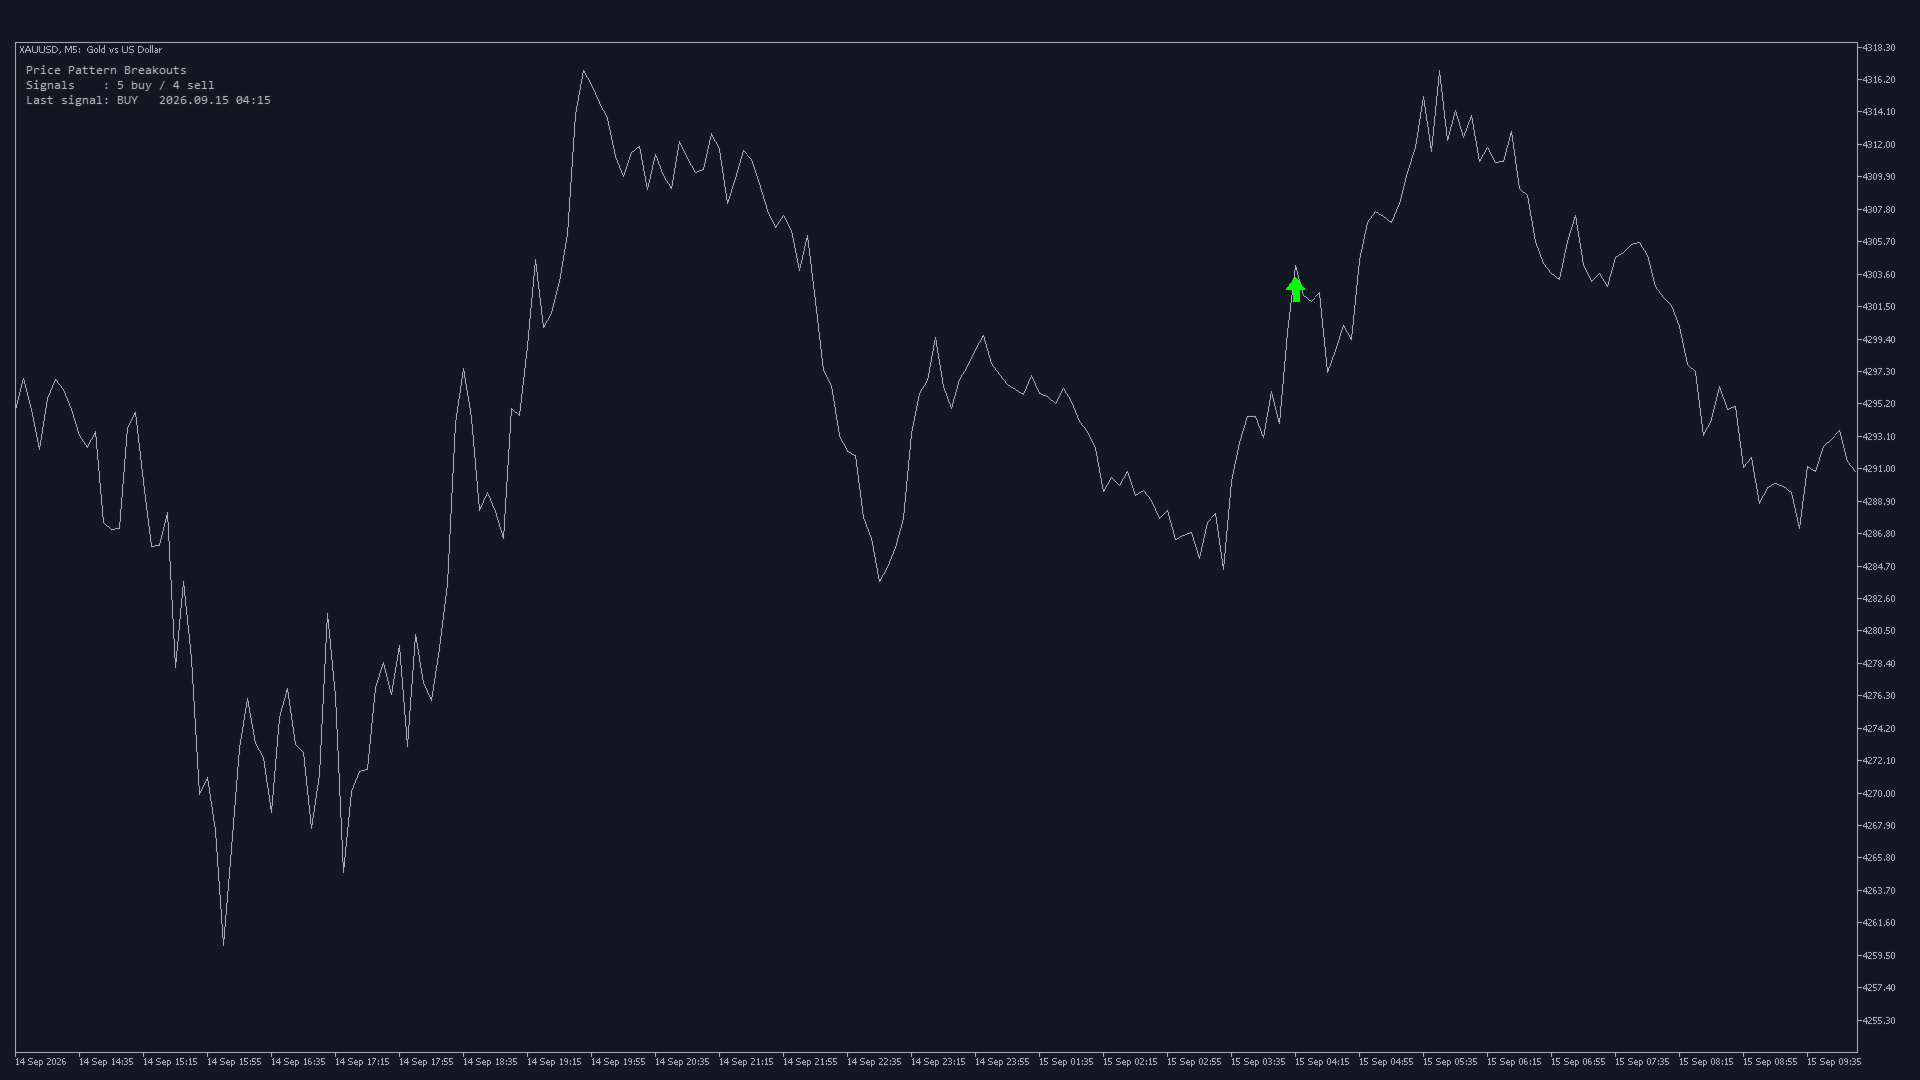
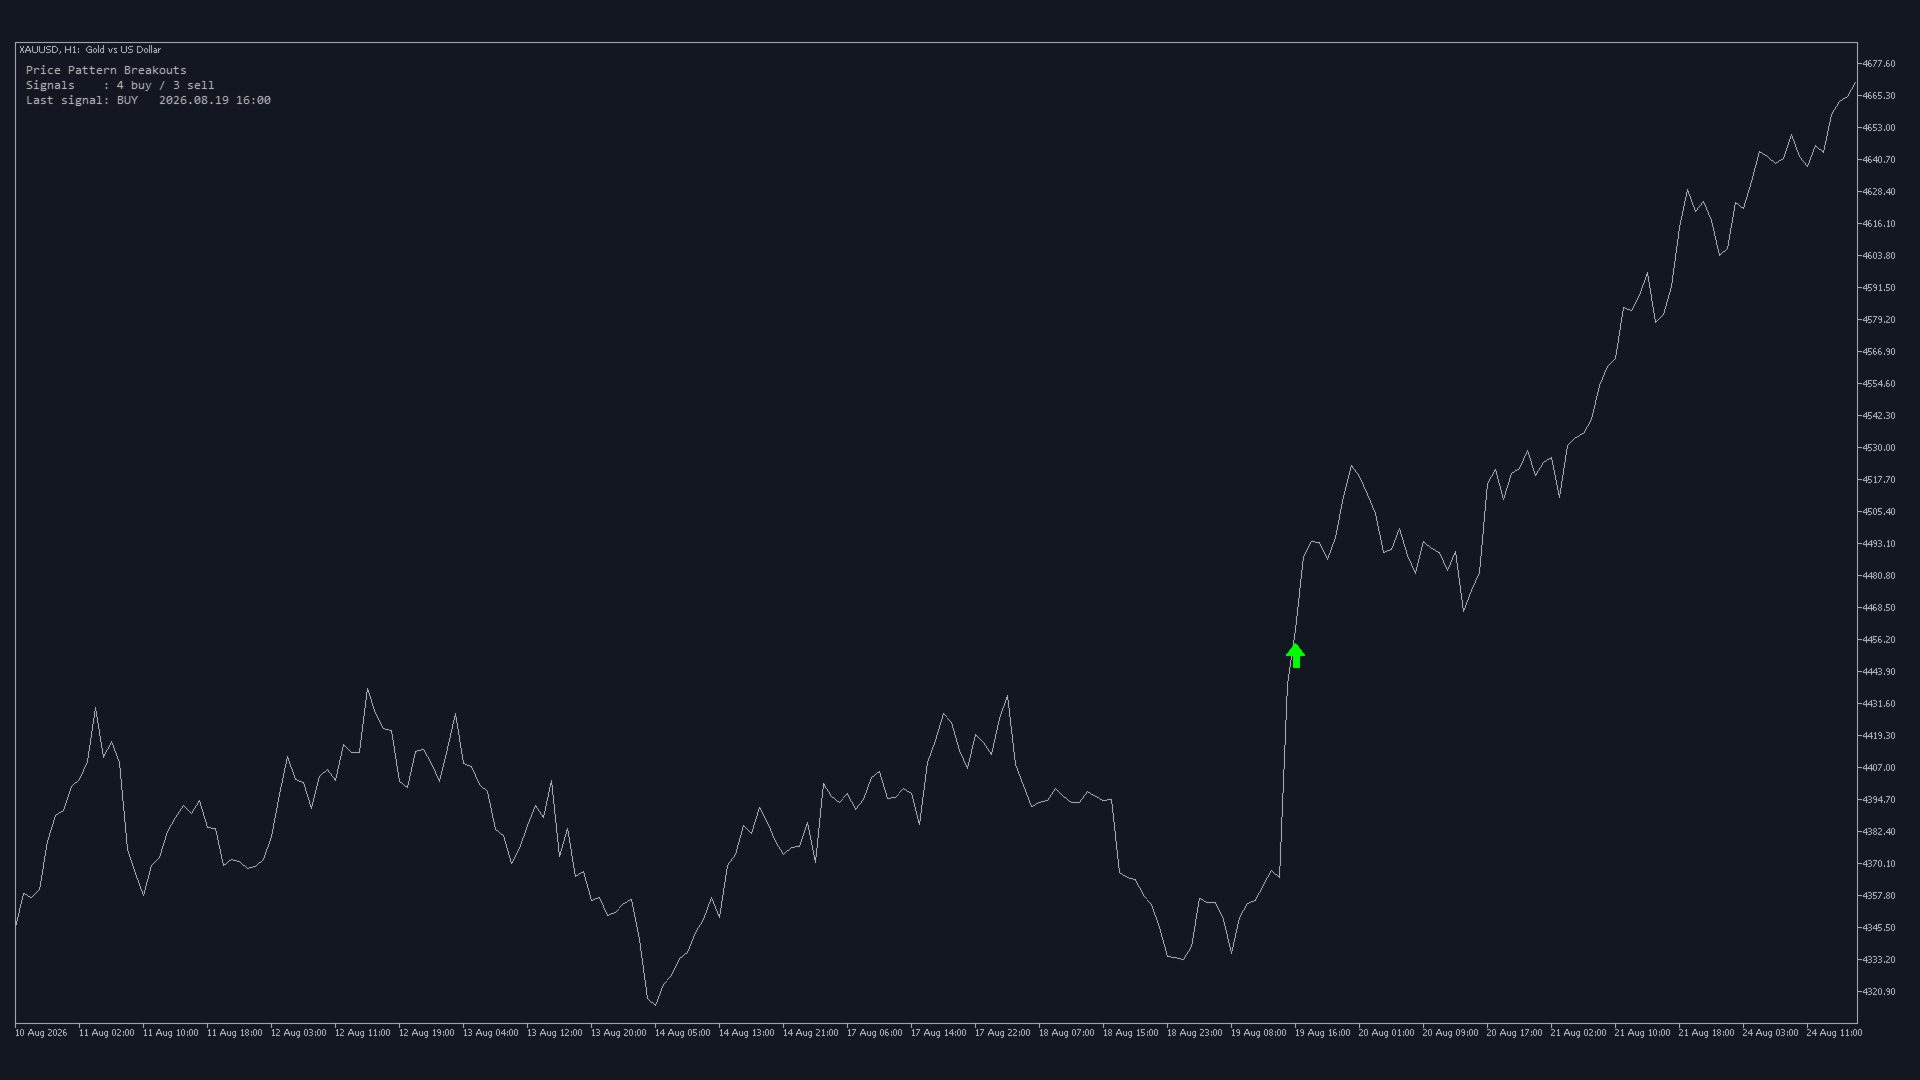
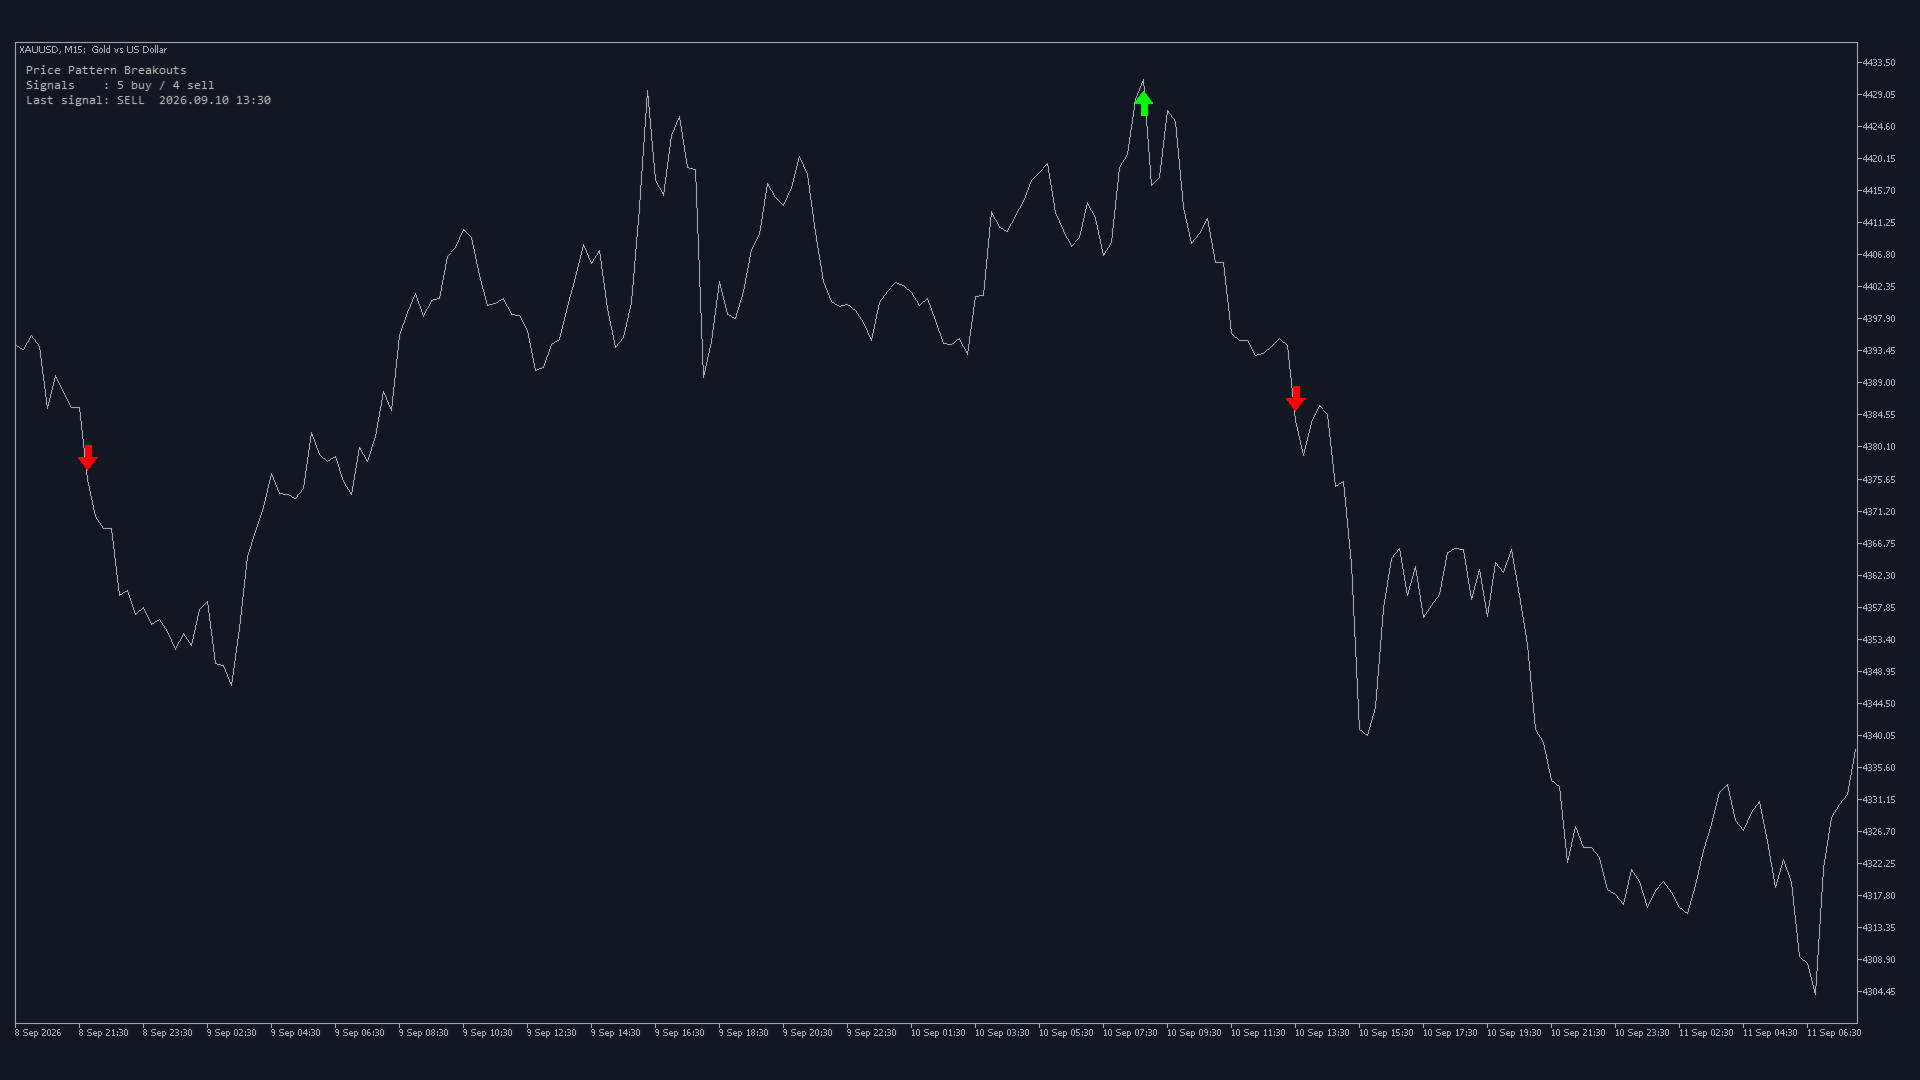
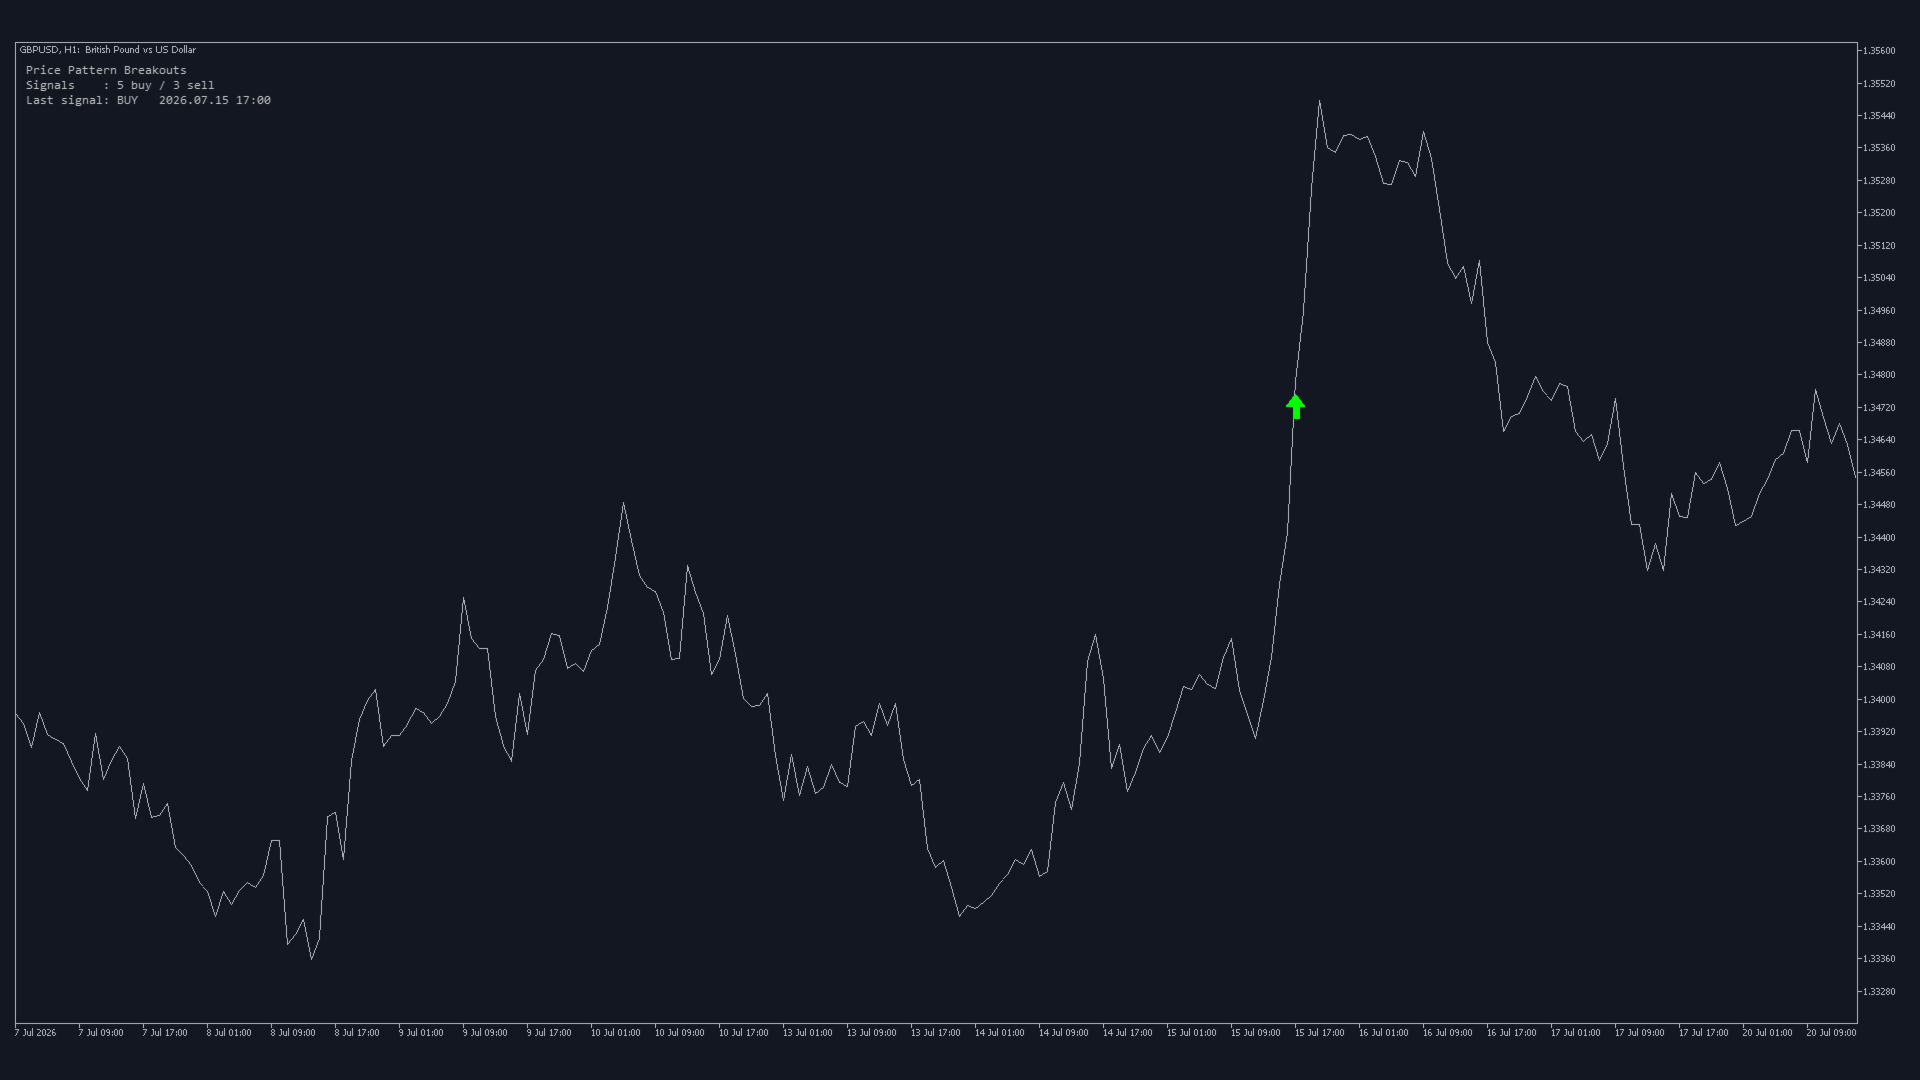
Price Pattern Breakouts scans the price for chart patterns automatically and marks each breakout with a buy or sell arrow. It is made for manual trading on any symbol and timeframe.
Please note
An arrow shows that price has broken out of a pattern. It does not guarantee that a trade will be profitable, and breakouts can fail. Confirm each arrow with other indicators or your own analysis, and always use proper risk management.
What you see on the chart
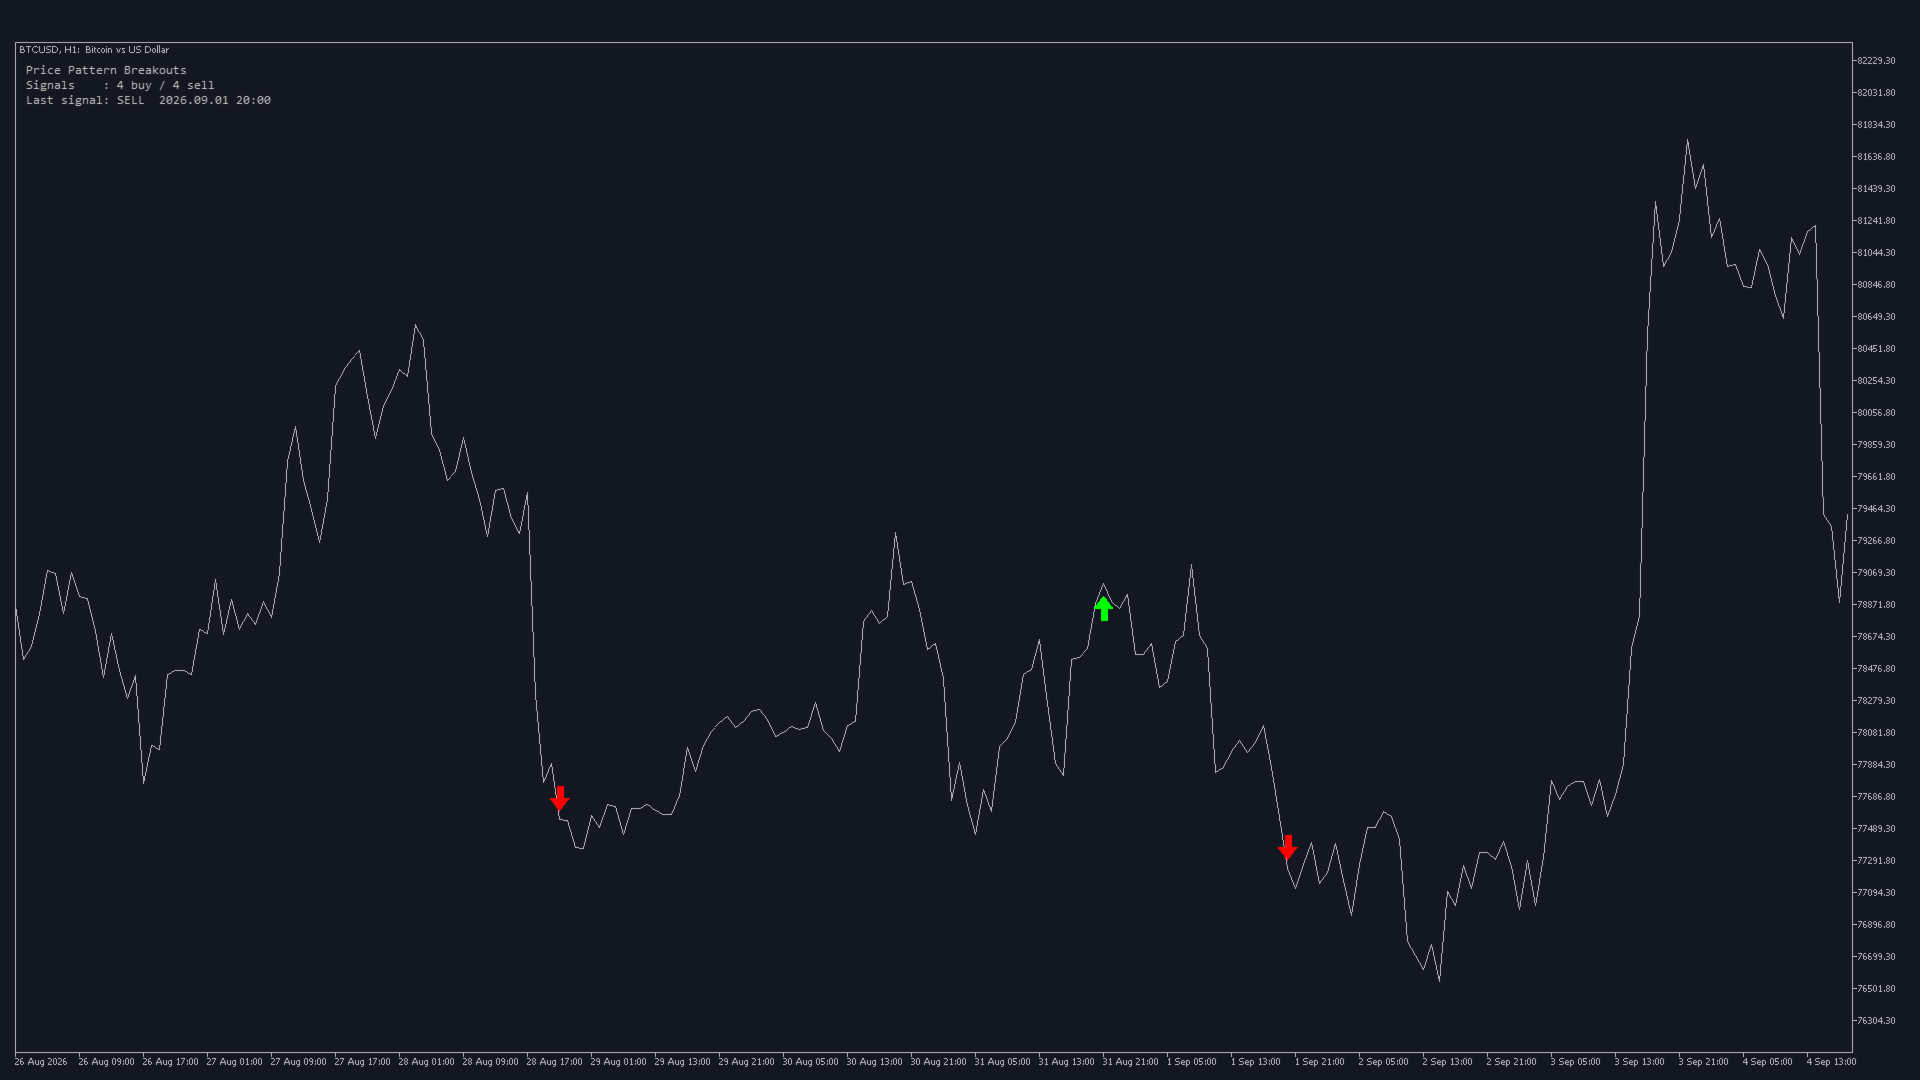
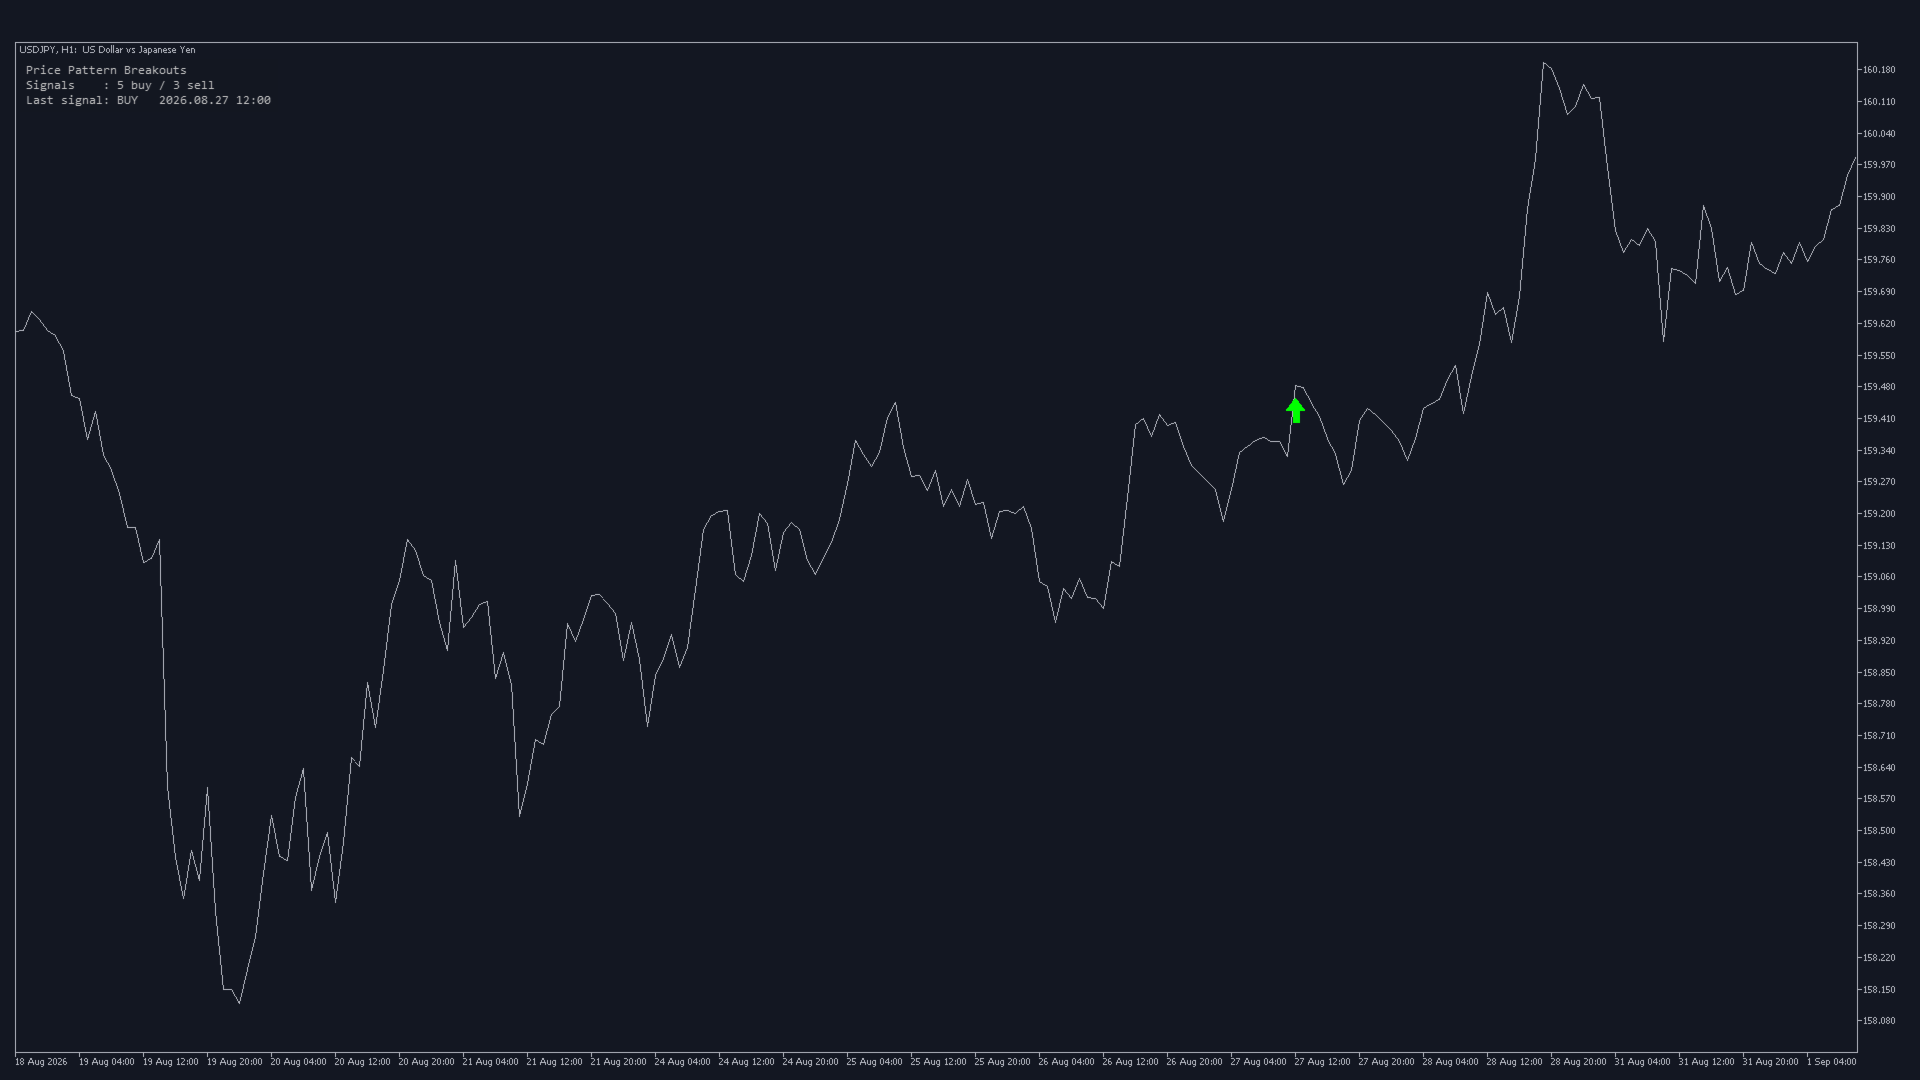
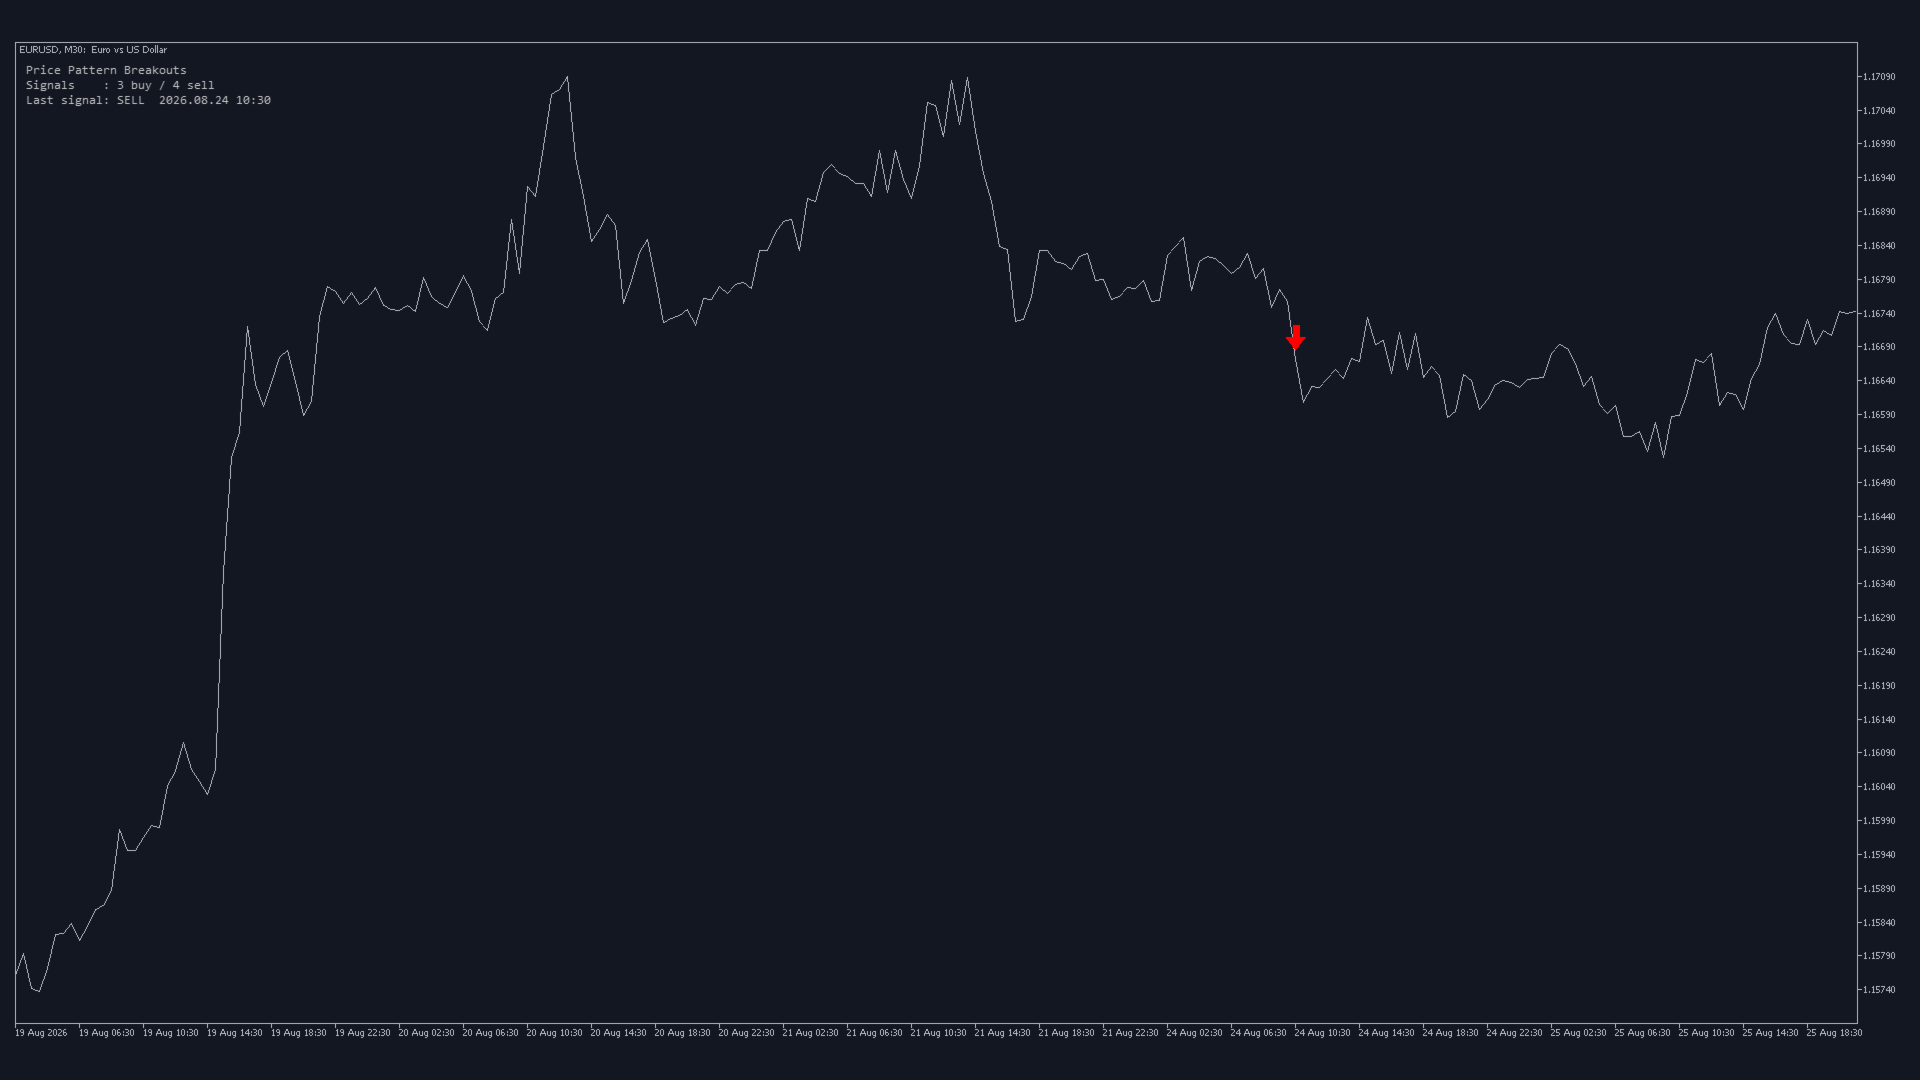
- A buy arrow below the price for an upward breakout, and a sell arrow above the price for a downward breakout.
- Arrows are placed after the breakout candle has closed, and they do not repaint. An optional live mode shows them on the forming candle instead.
- A status panel with the number of buy and sell arrows in the scanned bars and the most recent one.
Alerts
Popup, sound, push notification to the MetaTrader mobile app, and email when a new arrow appears. The alert gives the symbol, timeframe, direction and price.
Parameters
- Sensitivity: automatic (follows volatility), fixed in points or a percentage of price, and the minimum and maximum size of a setup.
- Filters: tolerances that set how strict the scan is.
- Signals: which signal sets are used, trend-reversal and trend-continuation signals on or off, breakout confirmation distance, setup expiry, closed candles or live, and the number of bars scanned.
- Display: line or candle view, arrow colours, size and distance, and the status panel.
- Alerts: popup, push notification, email and sound, each on or off.
Notes
- The indicator does not open or manage trades.
- It has no output buffers, so its signals cannot be read by Expert Advisors or other indicators.
- It works on a chart and in the Strategy Tester in visual mode.