Superwave MT5
- 지표
-
Lasse Mathias Baagoe S Christensen
 I code what I trade.
I also teach how I trade.
______________________________________
Trading Experience: 5 years.
CEO: Powered Traders & Deep Traders.
Tools & chart inspiration. 👇🏽 - 버전: 4.0
- 업데이트됨: 10 9월 2026
How to Read SUPERWAVE
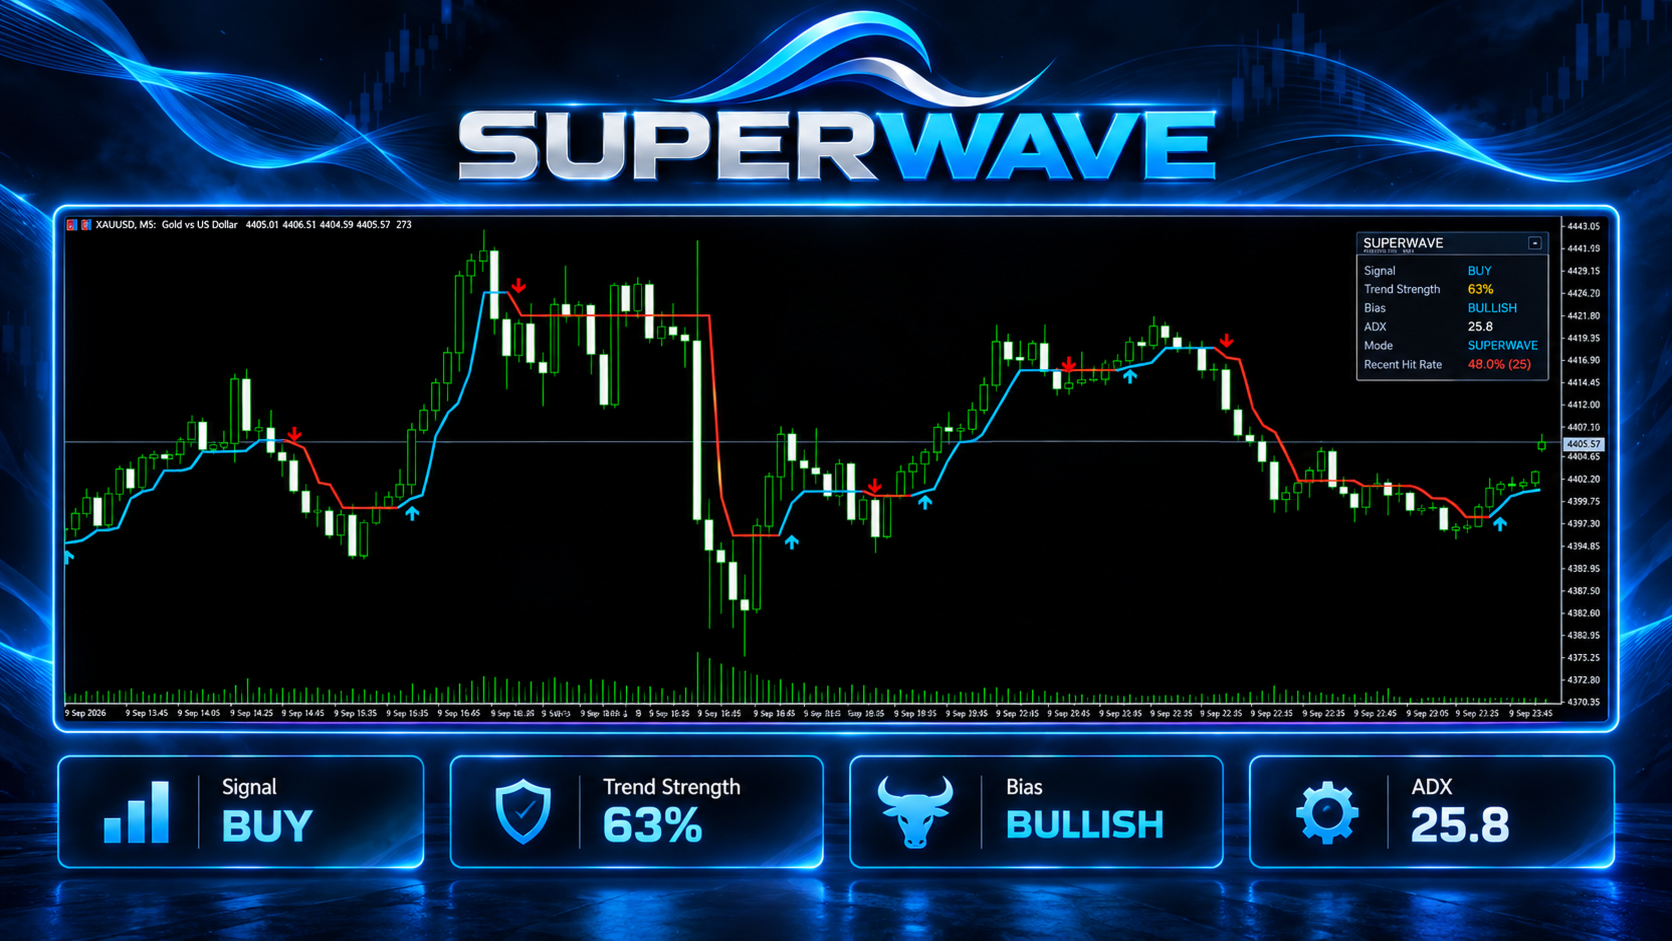
SUPERWAVE is designed to make the current trend state easy to understand at a glance.
During bullish conditions:
- The adaptive trend line is displayed in blue
- The line follows underneath price
- The dashboard shows a bullish market bias
- A BUY signal is displayed when the detected trend changes into bullish conditions
During bearish conditions:
- The adaptive trend line is displayed in red
- The line follows above price
- The dashboard shows a bearish market bias
- A SELL signal is displayed when the detected trend changes into bearish conditions
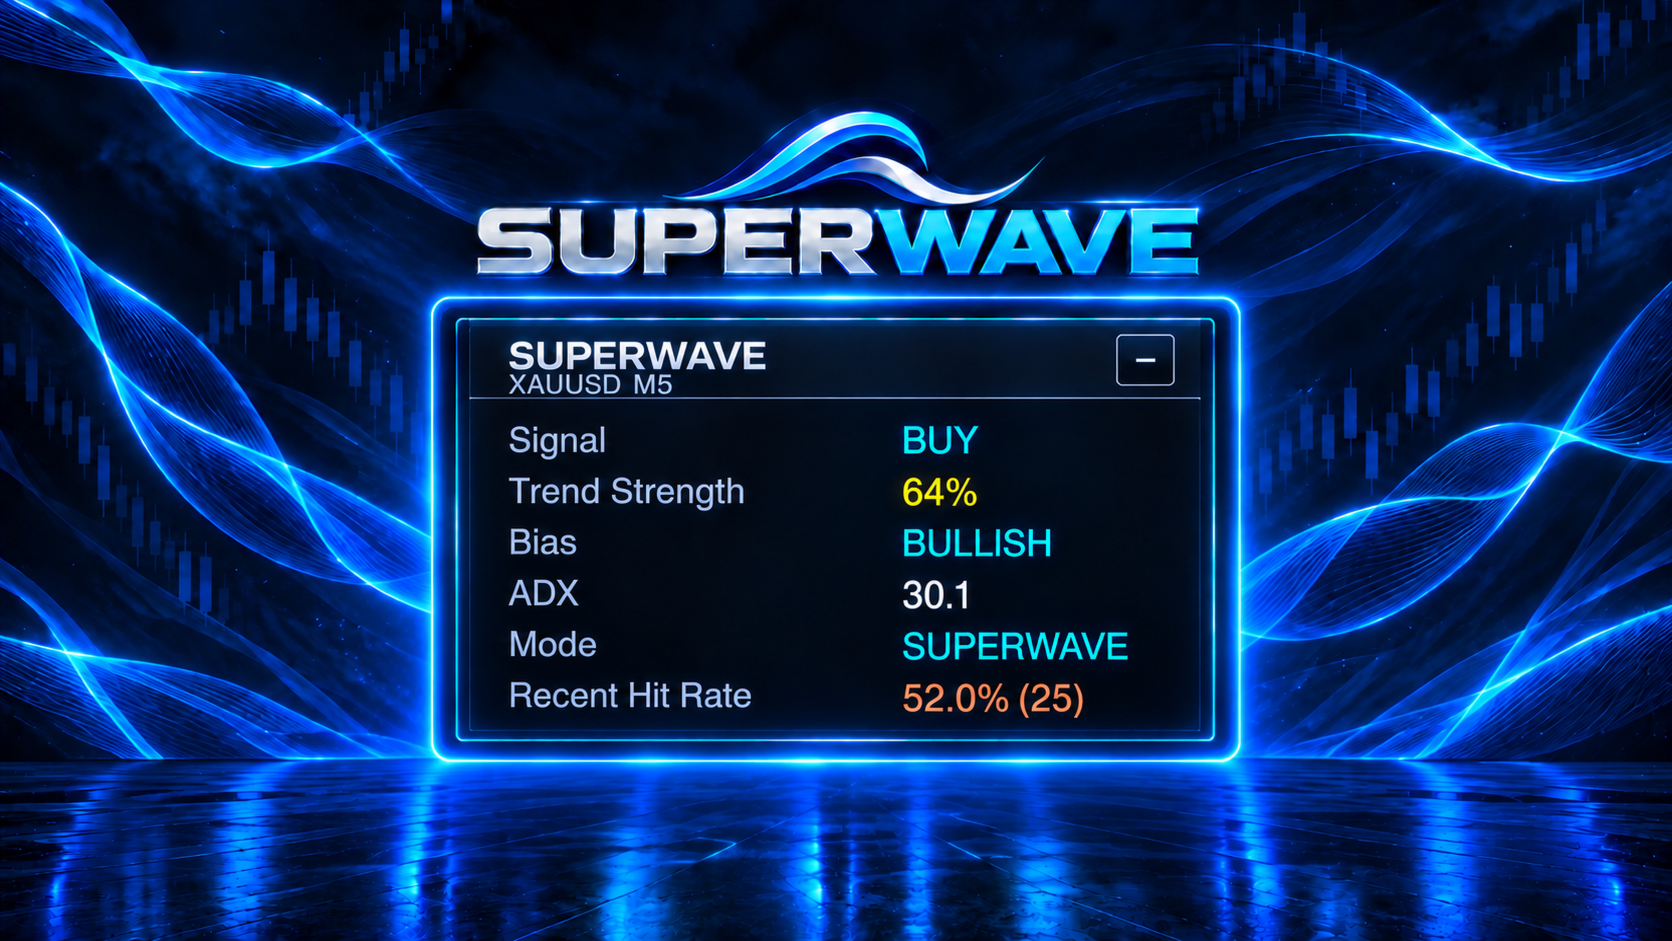
The additional Trend Strength, ADX and Recent Hit Rate information can then be used as extra context when evaluating the current signal.
More Than a BUY or SELL Signal
SUPERWAVE is not designed around blindly following every BUY or SELL label.
The signal shows when the indicator has detected a change in trend direction, while the dashboard provides additional information about the current market environment.
This allows you to combine several pieces of information in one view:
- Current trend direction
- Trend strength
- Market bias
- ADX
- Recent signal behaviour
The final trading decision always remains with you.
Designed to Keep the Chart Clean
SUPERWAVE keeps its main analysis focused around one adaptive trend line, BUY and SELL signals, and a compact dashboard.
The goal is to make trend direction easy to identify without requiring several separate indicators across the chart.
This makes it possible to quickly see whether SUPERWAVE currently detects bullish or bearish conditions while still keeping price action visible.
How to Use SUPERWAVE
A simple way to read the indicator is:
-
Identify whether the adaptive trend line is blue or red.
-
Check whether the latest detected direction is BUY or SELL.
-
Review the current Trend Strength.
-
Check the market Bias and ADX reading.
-
Use the Recent Hit Rate as additional historical context.
-
Decide for yourself whether the current setup fits your trading plan and risk management.
SUPERWAVE does not replace your own analysis, entry rules, stop loss or position sizing.
Recent Hit Rate Explained
The Recent Hit Rate is designed as a quick reference to how the indicator's latest signals have behaved.
For example:
52.0% (25)
means that the displayed percentage is calculated from the latest 25 signals used by the indicator.
The value can change as new signals are generated and older signals leave the recent calculation window.
Recent Hit Rate is historical information only. It is not a forecast, expected win rate or guarantee of future results.
What SUPERWAVE Does Not Do
- Does not open trades automatically
- Does not close trades automatically
- Does not manage your stop loss
- Does not manage your take profit
- Does not use martingale
- Does not use grid trading
- Does not average into losing positions
SUPERWAVE is built as a visual market-analysis and signal tool for manual traders.
SUPERWAVE MT5 in Short
- Adaptive Trend Following
- Blue Bullish Trend Line
- Red Bearish Trend Line
- BUY & SELL Trend-Change Signals
- Trend Strength
- Bullish / Bearish Market Bias
- ADX Context
- Recent Hit Rate
- Compact Dashboard
- Clean Chart Design
- Manual Trading
- No Martingale or Grid
FOLLOW THE TREND. SEE THE CHANGE. YOU MAKE THE DECISION.
Important Information
SUPERWAVE is a technical analysis indicator and does not guarantee profitable trades or future market direction.
BUY and SELL signals represent changes detected by the indicator's internal trend logic and should not be considered financial advice or guaranteed trade entries.
Trend-following indicators can behave differently depending on market conditions, volatility and price behaviour.
Always evaluate signals using your own trading plan and risk management.
Trading leveraged financial products involves substantial risk and can result in loss of capital.
Historical indicator behaviour does not predict future performance.
For product questions or support, use the MQL5 product comments or MQL5 messaging system.